Engineered nanofillers: impact on the morphology and properties of biomedical thermoplastic polyurethane nanocomposites
Azlin F.
Osman
a,
Yosephine
Andriani
a,
Grant A.
Edwards
a,
Tara L.
Schiller
b,
Kevin S.
Jack
c,
Isabel C.
Morrow
ac,
Peter J.
Halley
ad and
Darren J.
Martin
*ad
aAustralian Institute for Bioengineering and Nanotechnology, The University of Queensland, QLD 4072, Australia. E-mail: darren.martin@uq.edu.au; Tel: +61 3346 3870; Fax: +61 3346 3973
bDepartment of Materials Engineering, Monash University, Clayton, 3800, Australia
cCentre for Microscopy and Microanalysis, The University of Queensland, QLD 4072, Australia
dSchool of Chemical Engineering, The University of Queensland, QLD 4072, Australia
First published on 9th August 2012
Abstract
The viability of siloxane-based thermoplastic polyurethane (TPU) nanocomposites as a new insulation material for implantable and electrically active medical devices is investigated. We show that manipulating and controlling the specific interactions between the TPU segments and the engineered nanofiller greatly varies the TPU properties. The incorporation of dual modified organofluoromica as the nanofiller successfully enhanced the tensile strength, toughness and tear strength of the TPU. This is due to the presence of dual surfactants, which form regions of higher and lower surface energy on the layered silicate surface, thus enabling molecular interactions between the organofluoromica and both the hard and the soft TPU segment populations. We show that the addition of a second choline-based modifier with reactive –OH functionality may lead to the formation of positively charged TPU chain end groups as a result of trans-urethanization reactions during high temperature compounding, thus introducing labile “grip-slip-grip-slip” interactions between the TPU and the nanofiller. These molecular interactions assist in achieving a reduced level of stiffening, while at the same time enhance the toughening mechanism. The increase in the creep resistance and retardation in the stress relaxation of the TPU provides evidence that the dual modified organofluoromica also serves to enhance the dimensional stability of the TPU.
Introduction
Thermoplastic polyurethane (TPU) is the material of choice for many biomedical applications due to the relative ease of its fabrication into devices, its flexibility, biocompatibility, biostability and electrical insulation properties.1–7 Previous research demonstrates that the TPUs can be tailored to provide a combination of biostability and advantageous mechanical properties by incorporating organically modified smectic nanosilicates.8–11 They are, therefore, promising candidates for use as biomaterials in the fabrication of a wide range of medical devices. The poly(dimethylsiloxane)(PDMS)/poly(hexamethylene oxide)(PHMO)-based TPU (Elast-Eon™) based on an optimized formulation from AorTech International Pty Ltd exhibits properties comparable to those of medical grade polyether-based TPU materials such as Pellethane™ 80A.12 Elast-Eon™ TPU is now widely accepted as being the most biostable of all the TPUs, and as such is imminently suitable for long-term implantation.13 However, use of this PDMS/PHMO based TPU as the nanocomposite matrix presents some interesting challenges with regards to the understanding of the nanoscale and microscale morphology, due to the preexisting morphology of the segmented TPU domains (the so-called phase-separated soft and hard segment rich phases).12 Layered nanosilicates are potentially well-suited reinforcing nanofillers for this TPU due to the high aspect ratio lamellar elements, having high in-plane strength and stiffness. A necessary prerequisite for successful formation of TPU-silicate nanocomposites is therefore the alteration of the nanosilicate surface energy. The nanosilicate layers can be rendered lipophilic through ion exchange with an organic cation such as an alkylammonium ion.14–18 The resulting ‘organosilicates’ can be more effectively dispersed in the matrix and provide greater nanofiller-matrix interactions. The interactions between the nanofiller and TPU hard/soft segments are the major factor influencing the mechanical properties. These have been described by several research groups,19–23 highlighting the importance of understanding the specific hard segment and soft segment interactions with the nanofillers in correlation with the resulting nanocomposite properties. For current researchers, the clever incorporation of functional nanofillers into the complex TPU nanoscale morphology, and the characterization of the level of interplay between the various system components, remains as a fascinating challenge.We have recently published an extensive study on a series of solvent cast biomedical PDMS-based TPU nanocomposites containing high and low aspect ratio organosilicates with an octadecyltrimethyl ammonium (bromide) (ODTMA) single surfactant modification.24 However, this solvent casting approach led to poor dispersion of the high aspect ratio organofluoromica in the TPU matrix.24 In this present work, E5-325 TPU-organofluoromica nanocomposites were produced by melt compounding, which offers advantages over solvent casting by way of eliminating solvent and enhancing the filler dispersion. In addition, both single and dual surfactants were used to modify the fluoromica, so that the effects of these surface modifications on organo-fluoromica-TPU interactions could be better optimized and understood. This patented surface modification26 involves the exchange of dual polar and non-polar molecules onto the layered silicate surface, thereby forming regions of higher and lower surface energy for better compatibilisation and performance in polyurethane systems. Therefore, it was anticipated that the presence of dual modifiers would provide an additional driving force for promoting TPU intercalation, and consequently improve the organofluoromica dispersion and reinforcement in the TPU matrix. Herein, we describe the complete mechanical and morphological characterization of the E5-325 TPU and associated nanocomposite series and communicate the performance benefits of dual nanofiller surface modification.
Experimental section
Materials
Nusil MED 4860, a biomaterial that is currently used for insulation in Cochlear implants, is a medical grade elastomer with a two-part silicone system in a 1![[thin space (1/6-em)]](https://www.rsc.org/images/entities/char_2009.gif) :
:![[thin space (1/6-em)]](https://www.rsc.org/images/entities/char_2009.gif) 1 mix ratio (Part A
1 mix ratio (Part A![[thin space (1/6-em)]](https://www.rsc.org/images/entities/char_2009.gif) :
:![[thin space (1/6-em)]](https://www.rsc.org/images/entities/char_2009.gif) B). Part A consists of 30 wt% amorphous silica, while part B includes an additional 5 wt% dimethyl, methylhydrogen siloxane copolymer. Once these two parts are mixed, Nusil MED 4860 undergoes rapid curing at 165 °C for 5 min due to the presence of a platinum catalyst. This material was supplied by Cochlear Ltd and is commercially available from Nusil (via EIM distributors, Australia).
B). Part A consists of 30 wt% amorphous silica, while part B includes an additional 5 wt% dimethyl, methylhydrogen siloxane copolymer. Once these two parts are mixed, Nusil MED 4860 undergoes rapid curing at 165 °C for 5 min due to the presence of a platinum catalyst. This material was supplied by Cochlear Ltd and is commercially available from Nusil (via EIM distributors, Australia).
ElastEon E5-325 TPU consists of a 1000 g mol−1 poly(dimethylsiloxane) (PDMS) and 700 g mol−1 poly(hexamethylene oxide) (PHMO) mixed soft segment in a 98![[thin space (1/6-em)]](https://www.rsc.org/images/entities/char_2009.gif) :
:![[thin space (1/6-em)]](https://www.rsc.org/images/entities/char_2009.gif) 2 (w/w) ratio, and a hard segment composed of alternating 4,4′-methylene diphenyl diisocyanate (MDI) and 1,4 butanediol (BDO) sequences. The hard segment concentration is 32.5 wt%. This TPU was supplied by AorTech Biomaterials Pty Ltd. Fluoromica (Somasif ME100), a synthetic mica (tetrasilicic trioctahedral fluoromica), was supplied by Kobo Products, Inc. It is a fine white powder with an average platelet size of approximately 650 nm with the chemical formula Na0.66Mg2.68(Si3.98Al0.02)O10.02F1.96.25 The surface modification of the fluoromica was performed by ion exchange using ODTMA (single surfactant) and 75% ODTMA/25% choline chloride (CC) (dual surfactants) via a previously published method.25,26 These organically modified fluoromica (organofluoromica) were used as nanofillers in the TPU.
2 (w/w) ratio, and a hard segment composed of alternating 4,4′-methylene diphenyl diisocyanate (MDI) and 1,4 butanediol (BDO) sequences. The hard segment concentration is 32.5 wt%. This TPU was supplied by AorTech Biomaterials Pty Ltd. Fluoromica (Somasif ME100), a synthetic mica (tetrasilicic trioctahedral fluoromica), was supplied by Kobo Products, Inc. It is a fine white powder with an average platelet size of approximately 650 nm with the chemical formula Na0.66Mg2.68(Si3.98Al0.02)O10.02F1.96.25 The surface modification of the fluoromica was performed by ion exchange using ODTMA (single surfactant) and 75% ODTMA/25% choline chloride (CC) (dual surfactants) via a previously published method.25,26 These organically modified fluoromica (organofluoromica) were used as nanofillers in the TPU.
TPU nanocomposite sample preparation
The neat host E5-325 TPU and associate nanocomposites containing 2 wt% and 4 wt% nanofillers (organofluoromica with ODTMA (single) and ODTMA/CC (dual) surface modification) were prepared by melt compounding using a Thermo Scientific Haake Rheomex OS twin screw extruder. The extrudate was pelletized and subsequently dried at ∼70 °C for approximately 20 h prior to being compression molded. Compression molding was performed using a hydraulic press. A pair of brass plates was used, with a rectangular cavity machined out of the lower plate. The molds were heated to 185 °C prior to the pellets being added. A ‘pre-press’ was performed at 1 kPa for 1 min followed by another press at 5 kPa for 0.5 min. Pressure was released to remove bubbles then the samples were pressed for a further 0.5 min at 7.5 kPa. The samples were cooled under pressure to about 140 °C using a controlled water flow. Approximately 1 mm thick plaques were produced and they were then annealed under vacuum at 85 °C for approximately 5 h and left for at least a week to age prior to testing. In the subsequent discussion, the nanocomposites are referred to as 2MEO, 4MEO, 2MEO–C and 4MEO–C. A number denotes the nanofiller wt% loading (2 or 4) in the TPU. The first two letters represent the nanofiller used (ME = Somasif ME100), and the last letter or two letters (O or O–C) represent the single ODMTA and dual ODTMA/CC surface modifications, respectively.Mechanical testing
All mechanical tests were carried out at room temperature on an Instron model 5543 universal testing machine with a load cell capacity of 500 N. Five replicates of each material were employed for tensile testing, while for all other tests, three replicates were employed. For the tensile tests, dumbbells were punched from an ASTM D-638-M-3 die and a crosshead speed of 50 mm min−1 was applied. The creep test was conducted according to ISO 899-1![[thin space (1/6-em)]](https://www.rsc.org/images/entities/char_2009.gif) :
:![[thin space (1/6-em)]](https://www.rsc.org/images/entities/char_2009.gif) 2003, with a stress of 2 MPa and a 6 h hold time. Tear strength was measured according to the ISO 34 -1
2003, with a stress of 2 MPa and a 6 h hold time. Tear strength was measured according to the ISO 34 -1![[thin space (1/6-em)]](https://www.rsc.org/images/entities/char_2009.gif) :
:![[thin space (1/6-em)]](https://www.rsc.org/images/entities/char_2009.gif) 1994 Method B(a), using the angle test specimen (type B) without a nick, with a crosshead speed of 500 mm min−1. Stress relaxation tests were performed by stretching the specimens to the desired strain (50%) and recording stress versus time data for ten times the time taken to reach the desired strain. For all tests, pneumatic grips were used to prevent specimen slippage and statistical analysis was performed using a two-tailed Student's t-test for unpaired data to compare among materials. A significance level of 0.05 or less was accepted as statistically significant.
1994 Method B(a), using the angle test specimen (type B) without a nick, with a crosshead speed of 500 mm min−1. Stress relaxation tests were performed by stretching the specimens to the desired strain (50%) and recording stress versus time data for ten times the time taken to reach the desired strain. For all tests, pneumatic grips were used to prevent specimen slippage and statistical analysis was performed using a two-tailed Student's t-test for unpaired data to compare among materials. A significance level of 0.05 or less was accepted as statistically significant.
Transmission electron microscopy (TEM)
Sections of approximately 80 nm thickness were cut using a Diatome diamond knife on a Leica Ultracut UC6FCS cryogenic ultramicrotome at temperatures between −80 and −110 °C to ensure the polymers were in a glassy state. Sections were picked up using 2.3 M sucrose and mounted on 200 mesh copper grids (ProSciTech, Australia). MilliQ water was washed over the grids five times. The grids were then allowed to air dry on filter paper in self closing forceps prior to viewing. Samples were examined at low magnification (12![[thin space (1/6-em)]](https://www.rsc.org/images/entities/char_2009.gif) 000×) on a JEOL 1011 TEM (Japan) at 100 kV and images were captured on a SIS Morada 4 K CCD camera system. Samples examined at higher magnifications (23
000×) on a JEOL 1011 TEM (Japan) at 100 kV and images were captured on a SIS Morada 4 K CCD camera system. Samples examined at higher magnifications (23![[thin space (1/6-em)]](https://www.rsc.org/images/entities/char_2009.gif) 000-93
000-93![[thin space (1/6-em)]](https://www.rsc.org/images/entities/char_2009.gif) 000×) were examined on a Technai F30 FEG TEM (FEI, Netherlands) operating at 300 kV and images were captured with a Direct Electron LC1100 Lens-Coupled 4k × 4k CCD camera system.
000×) were examined on a Technai F30 FEG TEM (FEI, Netherlands) operating at 300 kV and images were captured with a Direct Electron LC1100 Lens-Coupled 4k × 4k CCD camera system.
X-Ray diffraction (XRD)
XRD measurements were conducted on a Bruker D8 Advance X-Ray diffractometer with a 0.2 mm slit, using Cu-Kα radiation generated at 40 kV and 30 mA. Samples were scanned over a range of 2θ = 0.5° to 10° using an increment of 0.02 and a scan speed of 1 s. Samples were mounted on a low background holder and fixed at the edges to ensure the surface was flat.Dynamic mechanical thermal analysis (DMTA)
Dynamic mechanical measurements were made using a Rheometric Scientific dynamic thermal mechanical analyser (DMTA IV) equipped with a tensile head and reducing force option. Analysis was performed at 0.1% strain in tension mode using a frequency of 2 Hz and a heating rate of 2 °C min−1 from −100 to 110 °C. We determined that this strain allowed measurements to be taken in the linear viscoelastic region.Differential scanning calorimetry (DSC)
DSC measurements on the TPU and TPU nanocomposites were carried out using the Mettler Toledo DSC 1 Star. The sample weight was approximately 6 mg and the heating rate employed was 10 °C min−1. The temperature applied was from 25 °C to 250 °C and then samples were cooled to 25 °C at the same ramping rate.Small angle X-Ray scattering (SAXS)
In situ tensile deformation studies using small-angle scattering (SAXS) technique were carried out on the SAXS/WAXS beamline at the Australian Synchrotron, Melbourne, to obtain morphological information during deformation of TPUs in real time. Two sample-to-detector distances of 0.96 m (short) and 7.2 m (long) were used to measure scattering vector (q) ranges of 0.002 to 0.06 Å and 0.015 to 0.50 Å, respectively. The wavelength of the X-ray beam was 1.033 Å (12 keV). Samples were cut with a dumbbell die with a width of ∼2.5 mm and 15 mm gauge length and strained at a rate of 15 mm min−1. Measurements were collected at 0%, 50%, 100%, 200%, 400%, 600% and 800% strain. For SAXS analysis of the TPU under relaxation, the samples were left to relax after straining for 10 min before collecting a SAXS pattern. The SAXS images were taken immediately after the desired values were reached during either the deformation or the relaxation process. Data acquisition times of 1 s and 2 s were used for each measurement at the short and long sample-to-detector distances, respectively.Scattering analysis
Data was analyzed using SAXS15ID version 3299, a program developed at ChemMat CARS as the user interface and control program. The intensity was normalized by the intensity measured at the beamstop to account for changes in transmission due to changes in sample thickness with strain, and then further corrected for background scattering. SAXS data averaged over 10° segments in the strain and transverse directions was analyzed using the Zernike Prins (ZP) model, which was previously used by Laity et al.27 and Finnigan et al.28 to successfully fit SAXS data from TPUs subjected to uniaxial deformation.Based on the ZP model, the scattering from two-phase systems can be represented as the product of the form factor, P(q), and the structure factor, S(q): 27–30
| I(q) = AP(q) S(q) | (1) |
 | (2) |
S(q) represents the interference effects between X-rays scattered by different scattering bodies in the sample and depends on their relative positions and can be described by:27,30
 | (3) |
where
 | (4) |
 | (5) |
where
 | (6) |
In this case, f was calculated from the azimuthally averaged data, where 〈cos2Φ 〉 is the average cosine squared weighted by intensity I as a function of the radial angle, Φ. The value of f is equal to 1 and −0.5 when the orientation of the nanofillers is completely aligned perpendicular and parallel to the direction of strain, respectively, and is zero for random (isotropically) orientated nanofillers.
Results and discussion
Nanofiller and nanocomposites structure
TEM images of the nanocomposites containing MEO and MEO–C are displayed in Fig. 1 and these display obvious differences in both dispersive and distributive mixing of nanofillers when comparing MEO and MEO–C systems. Given the very high aspect ratio of the synthetic fluoromica substrate, the MEO at both 2 and 4 wt% appears to be generally well dispersed and well exfoliated in the TPU matrix. This is probably due to the hydrophobic ODTMA surfactant providing a favorable thermodynamic driving force for TPU (particularly the hydrophobic PDMS soft segment) intercalation.24 In contrast, 2MEO–C and 4MEO–C exhibited good distributive mixing, but relatively poor dispersive mixing. The organoclay tactoids appear as larger, longer, thicker and more separated throughout the TPU matrix. The presence of dual ODTMA and hydroxyl-bearing choline surfactants appears to encourage the molecular interactions between the organofluoromica with both TPU hard and soft segments.26 This is due to ODTMA promoting the hydrophobic interactions between the nanofiller and the PDMS/PHMO soft segments, while the choline chloride will enhance the hydrogen bonding between the nanofiller and TPU hard segments.26 In addition, we believe that high temperature covalent reactions come into play during melt compounding. Commonly, processing at high temperatures causes urethane disassociation and recombination reactions which are known as “trans-urethanization”.33 Our hypothesis is that these “trans-urethanization” reactions also led to some small degree of covalent bonding between CC–OH groups and free –N![[double bond, length as m-dash]](https://www.rsc.org/images/entities/char_e001.gif) C
C![[double bond, length as m-dash]](https://www.rsc.org/images/entities/char_e001.gif) O– from the hard segments during high temperature compounding in the extruder. The urethane-CC TPU end groups thus formed would be positively-charged and somewhat “labile”, thus directing the aggregation of the larger tactoid ensembles (as seen in the TEM images) via the formation of “moveable molecular bridges” between platelets. In the following discussion we show how this unusual resulting morphology gives the best overall improvements in mechanical performance for the intended biomaterials application.
O– from the hard segments during high temperature compounding in the extruder. The urethane-CC TPU end groups thus formed would be positively-charged and somewhat “labile”, thus directing the aggregation of the larger tactoid ensembles (as seen in the TEM images) via the formation of “moveable molecular bridges” between platelets. In the following discussion we show how this unusual resulting morphology gives the best overall improvements in mechanical performance for the intended biomaterials application.
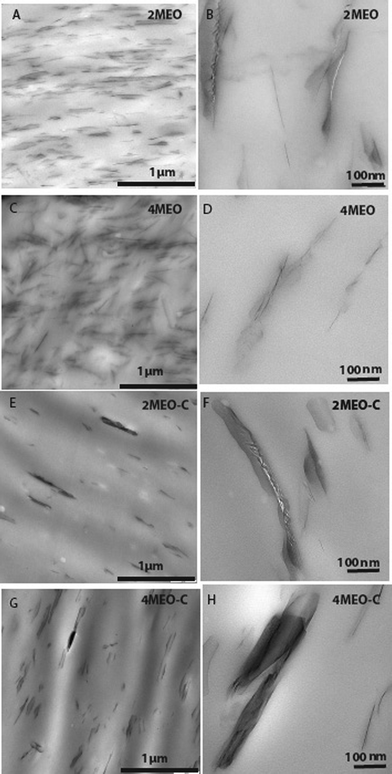 | ||
| Fig. 1 TEM micrographs of (A&B) 2MEO, (C&D) 4MEO, (E–G) 2MEO–C and (G-H) 4MEO–C. | ||
The XRD signature of any polymer-silicate nanocomposite may be influenced by the average platelet size, degree of nanosilicate inter-platelet registration, orientation and increase in basal spacing of the nanosilicate due to intercalation by the host polymer. The increase in basal spacing depends on the amount of TPU intercalated in the galleries of the silicates,34–37 and, of course, is a function of nanosilicate loading, nanosilicate-TPU interactions and also nanocomposite processing history. XRD patterns of the ME (unmodified, O and O–C modified) are shown in Fig. 2a, and XRD patterns for their respective nanocomposites are shown in Fig. 2b. The modification of ME with both O and O–C substantially increases the basal spacing (d001) from 1.3 nm to 4.9 nm. The MEO and MEO–C organosilicates exhibited several well-defined diffraction peaks as compared to the pristine ME, which correspond to basal spacings of approximately 4.9 nm, 2.3 nm and 1.6 nm. The observed peaks are caused by the interstratified superstructure of the fluoromica, which originates from the charge heterogeneity.15,38 This charge heterogeneity may allow different amounts of surfactant chains to intercalate the fluoromica layers, and hence different surfactant arrangements are possible.15 The high aspect ratio fluoromica gives rise to long-range order in the resulting organosilicate tactoids (with respect to synthetic hectorites or natural montmorillonite nanosilicates, for example), as well as strong diffraction peaks. The XRD profile of the neat host TPU shows no significant peak, which is expected, as both soft and hard domains present within a PDMS-based TPU do not show any diffraction peaks between 2θ = 0.5° to 10°39,40 and this TPU segmental microphase periodicity is expected to be observed at larger spacings.24 Both MEO and MEO–C nanocomposites, regardless of the organosilicate wt% loading, exhibited a series of (00l) reflections with basal spacings of approximately 4.0 nm, 2.0 nm and 1.4 nm.
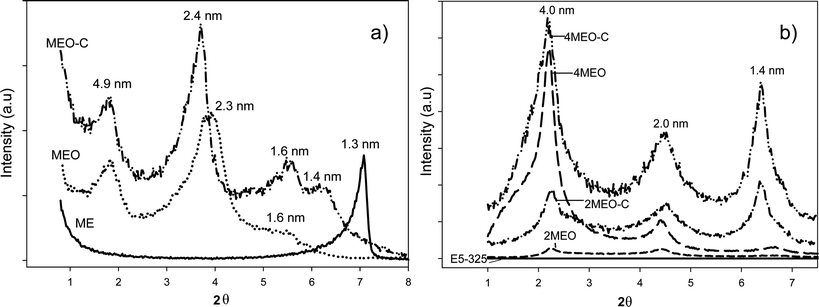 | ||
| Fig. 2 XRD pattern of the a) pristine ME and after ODTMA (O) and ODTMA/CC (O–C) modification and b) the E5-325 TPU containing 2 and 4 wt% MEO and MEO–C. | ||
Mechanical properties
The mechanical properties of melt processed E5-325 (neat host TPU and nanocomposites) and Nusil MED 4860 are summarized in Table 1. Representative stress–strain curves are shown in Fig. 3.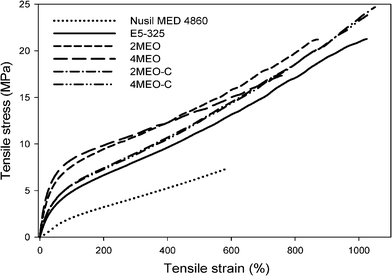 | ||
| Fig. 3 Effect of nanofiller types and loadings on the stress–strain curve of E5-325 TPU. | ||
| Material | Tensile strength/MPa | Young's modulus/MPa | Elongation at break (%) | Toughness/MPa | Tear strength/MPa | Tensile creep modulus (Et)/MPa |
|---|---|---|---|---|---|---|
| Nusil MED 4860 | 7.5 ± 0.1 | 2.7 ± 0.2 | 595 ± 39 | 35 ± 4 | 41 ± 14 | 1.51 ± 0.04 |
| E5-325 | 20 ± 2 | 9.7 ± 0.7 | 941 ± 89 | 108 ± 17 | 60 ± 8 | 2.4 ± 0.1 |
| 2MEO | 20 ± 2 | 19.9 ± 0.7 | 847 ± 39 | 106 ± 10 | 65 ± 2 | 12.1 ± 0.1 |
| 4MEO | 17 ± 2 | 23.7 ± 3.9 | 704 ± 114 | 83 ± 16 | 71 ± 4 | 8.02 ± 0.02 |
| 2MEO–C | 23 ± 1 | 11.3 ± 0.5 | 998 ± 51 | 129 ± 13 | 68 ± 4 | 7.9 ± 2 |
| 4MEO–C | 23 ± 2 | 11.9 ± 0.6 | 1003 ± 61 | 129 ± 12 | 75 ± 7 | 6.8 ± 0.5 |
The stress–strain curve of the neat E5-325 is similar to that of other TPUs.11,37,41 It can be manifested as the evolution of the phase-separated soft and hard TPU segments during the deformation process. At low strains (0–50%), the linear region is due to the stretching of the elastic soft segments, in which the hard segments respond to this soft segment alignment. At high strains, the non-linear viscoelastic region is due to the more subtle TPU microstructural changes such as the partial extent of soft segment chains, and the hard domains orientation, rotation, deformation and fragmentation.24,42 This behaviour can be influenced by the nanofiller addition, depending on the degree of TPU-nanofiller interactions.24,28 In agreement, our results show that the incorporation of nanofillers with different functionality greatly influences the stress–strain behaviour of the E5-325 TPU. These morphological changes observed during the deformation process will be further described in the in situ strained SAXS section.
The following comparisons were made based on the data that shows a statistically significant difference. E5-325 TPU displays greater tensile properties when compared with Nusil MED4860, showing gains of 167% in tensile strength, 63% in elongation at break, 220% in toughness and 56% in tear strength. Adding dual modified ME (MEO–C) further increases the mechanical properties of this PDMS-based TPU. The best mechanical properties were achieved when 4 wt% MEO–C was added, giving rise to an increase of 15% in tensile strength, 19% in toughness and 25% in tear strength. Significantly, the use of dual surfactants resulted in enhancements in strength and toughness without the substantive accompanying increases in elastic modulus or stress at 100% strain observed when a single surfactant was employed. This suggests that the utilization of dual surfactants enables preferential interactions with both soft and hard segments.26 Furthermore, the aforementioned high temperature trans-urethanisation reactions and subtle molecular reorganization at the TPU-nanofiller interface lead to the formation of more lengthy aggregated arrays (Fig. 1E–H). This morphology and enhanced hard segment interaction is shown later in this communication to generate more efficient platelet orientation when subjected to tensile deformation (Fig. 12). There is also the possibility that the new population of choline-derived positive TPU end groups discussed previously provide labile, but mobile interactions with the nanofiller, which can be broken and re-formed, thereby retaining toughness without stiffening.
In contrast, the addition of MEO resulted in a drastic increase in Young's modulus, accompanied by a reduction in tensile strength and elongation at break. With the addition of 4 wt% MEO, the Young's modulus was substantially increased by ∼144%. In the absence of the additional CC surfactant, the hydrophobic MEO, when added at 2 and 4 wt%, dispersed and delaminated well in the TPU matrix (Fig. 3b), but tended to interact preferentially with the soft segments, causing a reduction in soft segment mobility, and a substantial increase in Young's modulus. As a result of this exfoliated morphology and better dispersed MEO, this nanocomposite system appeared to promote more “particle–particle” interactions during elastomer deformation rather than “particle-TPU interactions”, which can hinder both the TPU chain and nanofiller mobility.
Tensile creep and stress relaxation testing of selected samples was performed in order to measure their time-dependent dimensional stability under tensile deformation. The tensile-creep modulus (Et) was used to evaluate the creep resistance of the TPU and the single and dual modified nanocomposites. Et is the ratio of the applied stress to tensile-creep strain reached at total creep. Et values for Nusil MED 4860, E5-325 TPU, 4MEO and 4MEO–C measured at a stress of 2 MPa are shown in Table 1, while their representative tensile creep curves are displayed in Fig. 4. The tensile creep modulus of the E5-325 TPU is 59% greater than Nusil MED 4860. Adding 2 and 4 wt% MEO and MEO–C profoundly improves the creep resistance of this PDMS-based TPU. The highest Et was achieved by 2MEO with an increase in creep resistance of 404%, while 2MEO–C resulted in an increase of 229%. It appears that, at this relatively low constant tensile load of 2 MPa, the stiffer MEO system, with its greater affinity towards the PDMS soft segments and higher degree of nanofiller particle–particle interactions, has most successfully restrained the soft segment mobility and hence reduced the TPU extension under these conditions.
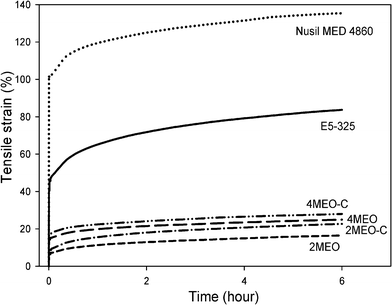 | ||
| Fig. 4 Tensile-creep curves of Nusil MED 4860, E5-325, 4MEO and 4MEO–C at an applied stress of 2 MPa over a test period of 6 h. | ||
Stress relaxation data obtained at 50% strain is presented in Fig. 5. The data was normalized against the stress, σ(t′), at t = 5 s, and demonstrated a power-law dependence (σ(t)/σ(t′) = At−b as displayed in Fig. 5b. The fitting constants, A and b, from the power law analysis are provided in the inserted table in Fig. 5. Although in the initial stages the stiffer MEO system retains a higher stress, the fitted slopes of the curves reveal that the stress relaxation rate is reduced with the addition of MEO–C nanofiller, while the rate actually increased with the MEO inclusion. This clearly shows that the dual modified organosilicate (MEO–C) most successfully retarded the stress relaxation of the TPU. According to Sternstein and Zhu,43 at low strain, the stress relaxation rate in the nanocomposites is considered to be the result of strain-induced disentanglements and slippage of chain segments at the filler surface. Therefore, it can be inferred that the dual modified ME with a more preferential interaction with both TPU soft and hard segments is most effectively contributing to reduced strain induced molecular or segmental slippage, and hence a lower stress relaxation rate. The positive end groups and proposed “molecular bridging” that formed in the MEO–C nanocomposites might also serve to inhibit the molecular or segmental slippage during this relaxation under constant small strain. Conversely, poor organosilicate–hard segment interactions in the MEO nanocomposite resulted in greater segmental chain slippage at the interface. In addition, the enhanced particle–particle interactions in the MEO system placed polymer chains at the nanofiller-TPU interphase under increasing stress, inducing an increased rate of stress relaxation by promoting strain induced slippage.43,44
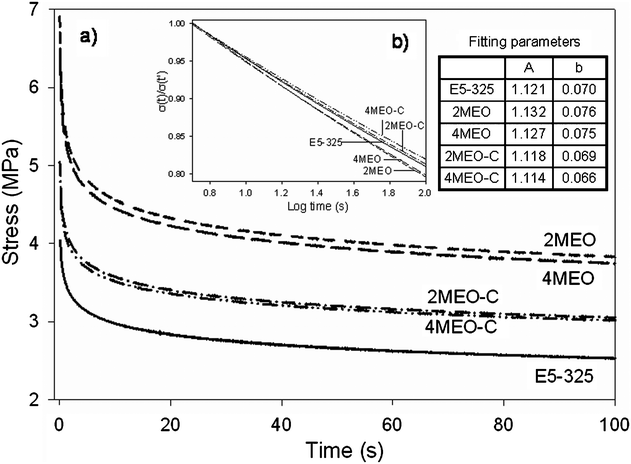 | ||
| Fig. 5 Stress relaxation data obtained at 50% strain. | ||
To examine the possible reasons for these changes in TPU mechanical behavior with the organosilicate addition, we performed the DMTA, DSC and strained synchrotron SAXS analysis to provide information on the possible morphological changes and specific TPU-nanofiller molecular interactions.
Dynamic thermal mechanical analysis (DMTA)
DMTA analysis was carried out to monitor the temperature dependence of the storage modulus (E′) and damping capacity (tanδ) of the neat host TPU and nanocomposites. Tanδ and E′ curves determined by DMTA are presented in Fig. 6. Tan δ plots in Fig. 6a revealed two main peaks for the neat host E5-325, similar to that previously reported.24 The first peak corresponds to a low temperature process (Tα1), which relates to segmental motion in the PDMS phase.24,40 The second peak appears at a higher temperature (Tα2) and this is assigned to the α,ω-PDMS end-group (soft microphase) segmental motion.39,40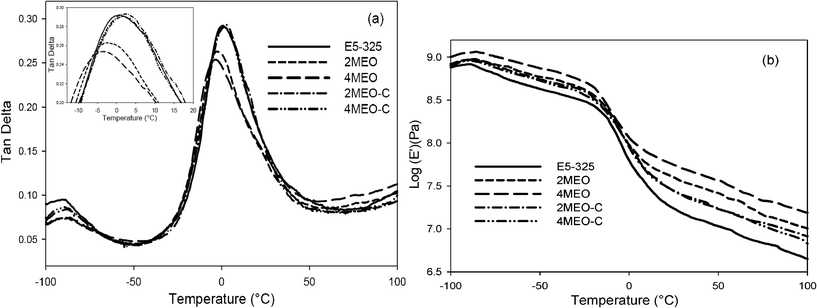 | ||
| Fig. 6 DMTA data as a function of temperature: a) damping factor (tanδ); b) storage modulus (E′) for E5-325 (neat host TPU and nanocomposites). | ||
We observe Tα1 in the −86 to −91 °C range, whereas Tα2 is observed in the −3 to 2 °C range. The Tα2 of the TPU increased slightly with the addition of the MEO–C and was associated with maintenance of the damping peak height, while Tα2 decreased with the addition of MEO, and peak height was reduced.
The storage modulus was observed to increase modestly with the addition of both 2 wt% and 4 wt% MEO–C. This is consistent with the tensile and creep results discussed previously. However, an even higher storage modulus was observable in the E5-325 with MEO. In agreement with our tensile test results, 2 and 4 wt% MEO more efficiently increased the modulus of E5-325 at room temperature with respect to the MEO–C counterparts. Interestingly, this largest increase in both Young's and storage moduli was achieved in conjunction with a reduction in soft microphase Tg, a phenomenon not observed with the MEO–C nanocomposites. This furthermore supports the notion of more specific soft segment interactions in the MEO system, including perhaps some plasticization of the PDMS-rich microphase with ODTMA alkyl tails.
Differential scanning calorimetry (DSC)
Fig. 7a and 7b present the heating and cooling thermograms of the E5-325 (neat host TPU and nanocomposites), respectively. From the heating scan, we observed two endotherms in the DSC thermograms and they have been labeled T1 and T2. This weak T1 endotherm appeared in the 53 to 58 °C range and we propose that this signature is associated with the disordering of clusters of single (‘lone’) MDI residues.24,45,46 A T2 endotherm was observable in the 99 to 106 °C range and is related to the Tg of the hard domains (TgH).24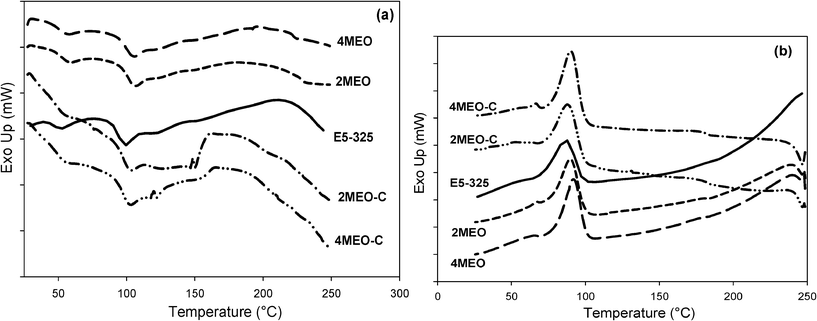 | ||
| Fig. 7 Typical DSC a) heating curves and b) cooling curves for the neat host E5-325 TPU and E5-325 TPU containing MEO and MEO–C. | ||
The MEO nanocomposites exhibit a slightly higher T1 temperature as compared to the neat TPU and MEO–C nanocomposites. Due to the very hydrophobic inter-gallery space in this system, which stretches over a much larger length scale than the typical TPU domain texture, one can imagine soft segments, single MDI residues and shorter hard segments being preferentially intercalated. This intercalated shorter hard segment population may be contributing to the increase in T1. A bimodal T2 endotherm in E5-325 with MEO–C can be attributed to the disruption of various degrees of short-range hard segment order, due to distribution in hard segment lengths and morphologies. A broad exotherm is observable immediately after the T2 endotherms in the TPU containing MEO–C, and this is probably related to conformational changes taking place in the hard phase. This new signature observed in both 2MEO–C and 4MEO–C systems supports our hypothesis that there is a potential covalent re-coupling of the single MDI and perhaps shorter hard segments (via trans-urethanisation) with –OH groups on CC, introducing labile positive end groups and subtle morphological changes.
Based on the cooling scan, crystallization exotherm peaks at 87 to 88 °C were observable for the E5-325 containing 2MEO–C and 4MEO–C respectively, meanwhile, for 2MEO and 4MEO, the crystallization exotherms occured at higher temperatures (90 and 92 °C, respectively). One possible reason for this is that because longer hard segments are effectively excluded from intercalating the MEO galleries, they are encouraged to nucleate sooner than in the MEO–C system where hard segment-nanofiller interactions and reactions are promoted.
In situ strained small angle X-Ray scattering (SAXS)
In situ SAXS under tensile deformation was performed in an effort to better elucidate the mechanisms responsible for the mechanical responses observed. Analysis at different q regions was done in order to differentiate between TPU morphology and contributions from the nanofillers, as q is inversely proportional to the length scales of both components. The SAXS data obtained at the short sample-to-detector distance (q range of 0.015 to 0.50 Å) was used to study changes in TPU microphase morphology, while the data collected at the long sample-to-detector distance (q range of 0.002 to 0.06 Å) was used to follow the evolution of nanofiller morphology during uniaxial loading.TPU microphase morphology during deformation
2D SAXS images at selected strains for neat host TPU and nanocomposites collected at the short sample-to-detector distance during deformation are shown in Fig. 8, together with the images acquired after relaxing the stretched films for 10 min. Their respective 1D SAXS profiles are shown in Fig. 9.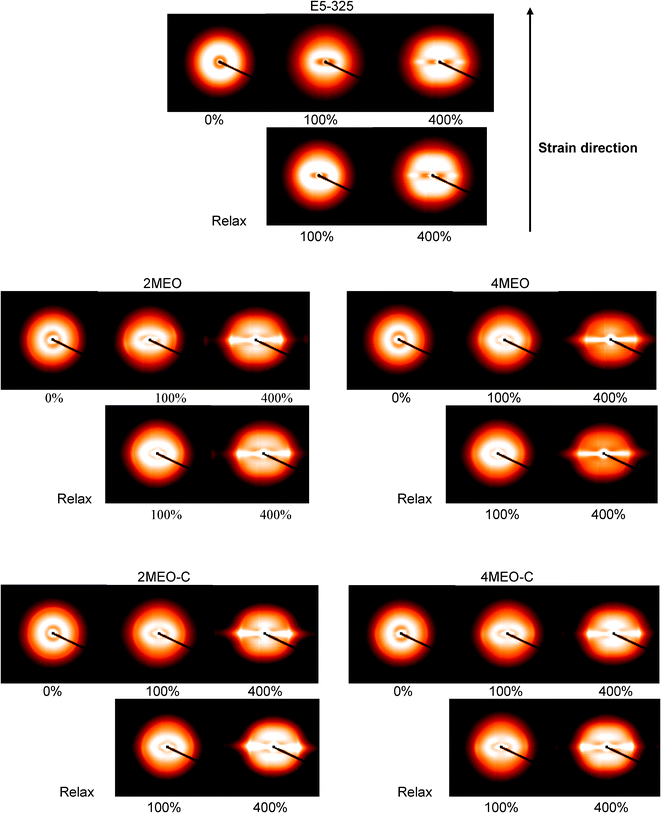 | ||
| Fig. 8 2D SAXS patterns at selected strains for E5-325 (neat host TPU and nanocomposites) obtained from the short sample-to-detector distance. The relaxed state refers to images taken 10 min after strain measurements were taken. | ||
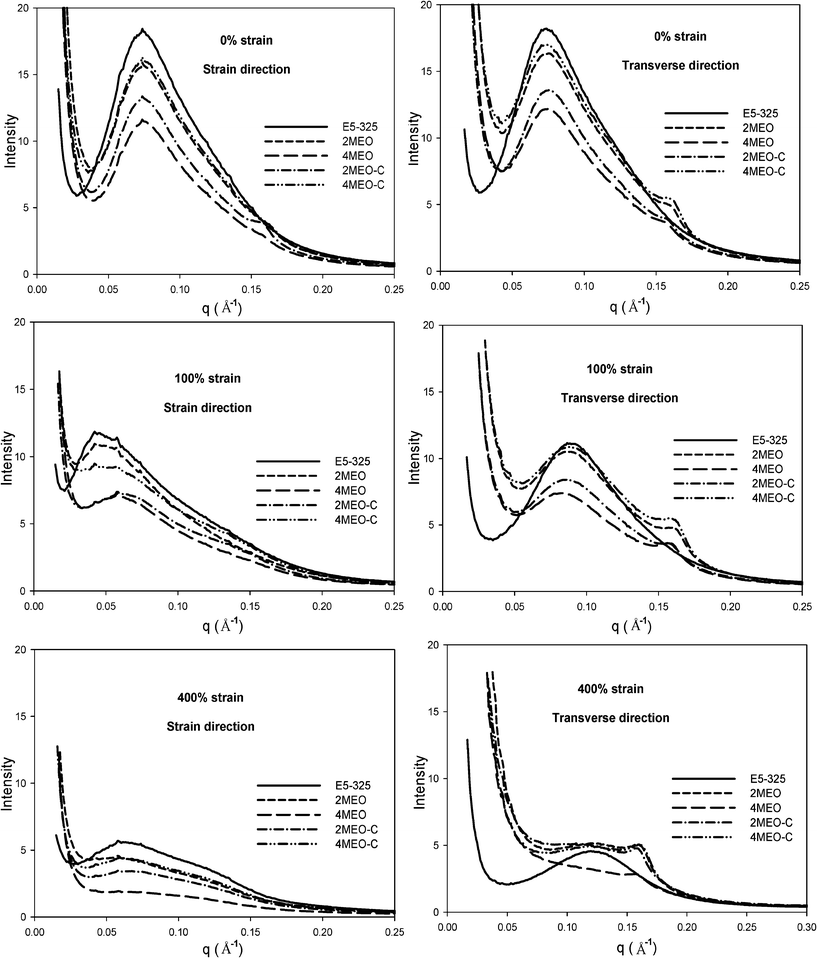 | ||
| Fig. 9 1D profiles of E5-325, 2MEO, 4MEO, 2MEO–C and 4MEO–C at 0%, 100% and 400% strain in the strain and transverse directions, obtained from the short sample-to-detector distance. | ||
In the initial unstrained state, all samples show isotropic SAXS patterns, indicating that the hard segment domains are randomly oriented, which then transforms to increasingly anisotropic patterns upon stretching. This TPU SAXS pattern is similar to that discussed previously.24 At 100% strain, the ring deforms to an ellipsoid with the long axis along the equator, attributed to an affine deformation of the two phase structures of TPU.24 The soft segments are mainly involved in the deformation of this material during the first 100% strain and TPU hard segments respond to the alignment of the soft segment chains.24,28 The SAXS pattern reveals scattering lobes on the meridian and a streak in the equatorial direction when the strain reaches 400%. As discussed previously,24 the equatorial streak appears as a result of reduced electron density contrast between the hard segment nanofibrils and the aligned soft segment chains and/or the decrease in coherent scattering due to the small size of the broken down hard domains. Conversely, the SAXS patterns for MEO and MEO–C nanocomposites demonstrate an isotropic outer ring prior to straining, which then progressively transforms into two arcs in the equator upon straining. This outer ring, is located in the high q region, and relates to the diffraction from registered high aspect ratio fluoromica tactoids, and is understandably more intense in MEO–C nanocomposites. In agreement with the TEM images, MEO–C nanocomposites exhibit larger, thicker elongated tactoids as compared to MEO nanocomposites. At 400% strain, the two arcs observed in the region of q = 0.160 to 0.165 Å−1 represent the oriented nanoparticles, and the respective scattering peak at q = 0.16 Å−1 can be observed in the SAXS profile (Fig. 9). Fig. 8 and 9 demonstrate the lower scattering intensity of 4MEO than that of the 4MEO–C nanocomposite in the q region between 0.02 and 0.15 Å−1. This lower scattering intensity, which is most notably seen at 400% strain, might be due to higher fractions of broken down hard segment lamellae in the 4MEO system. This greater fragmentation of hard segments in the 4MEO upon deformation could be the result of weaker hard segments interactions with the hydrophobic MEO nanofiller, particularly at the higher 4 wt% loading. In addition, the interparticle locking resulting from the superior MEO exfoliation also might induce frustrated platelet alignment, thus introducing more interphase void formation as illustrated in Fig. 12c and d. (We observed more substantial strained specimen whitening in the MEO nanocomposite system.)
For all strained samples, slightly intensified scattering was observable from SAXS patterns during the relaxation process, indicating a slight recovery of phase separation and hard segment ordering. The nanocomposite samples show a lesser degree of recovery due to reduced TPU microphase mobility, as a result of organosilicate inclusion.
Prior to straining, the 1D SAXS profiles presented in Fig. 9 for the neat host TPU and nanocomposites reveal prominent peaks at ∼q = 0.07 Å−1 corresponding to the segmental microphase periodicity in the materials. Further stretching results in the decrease in the scattering intensity, both in strain and transverse directions, which is due to a disruption of the hard segment domain fraction. Another reflection at ∼q = 0.16 Å−1, corresponding to diffraction from the fluoromica tactoids with basal spacings of 4.0 nm was observable in the undeformed MEO and MEO–C nanocomposite samples. The scattering peaks appear stronger and shift slightly towards higher q in the transverse direction as the strain increases from 0% to 400%, suggesting greater organosilicate alignment and reduced spacing between the individual platelets. The XRD analysis of the unstrained 2MEO and 4MEO, as shown in Fig. 2b, also confirms the presence of a similar organosilicate basal spacing. The change in hard domain spacing with deformation for E5-325 TPU and nanocomposites was also studied from the SAXS patterns. SAXS data averaged over 10° segments in the strain and transverse directions was analyzed using the ZP model, which was previously used to successfully fit SAXS data from E5-325 TPUs subjected to uniaxial deformation.24 The morphological data obtained from the fitting, combined with the direct visualization of the 1D scattering profiles is tabulated in Table 2 and presented graphically in Fig. 10.
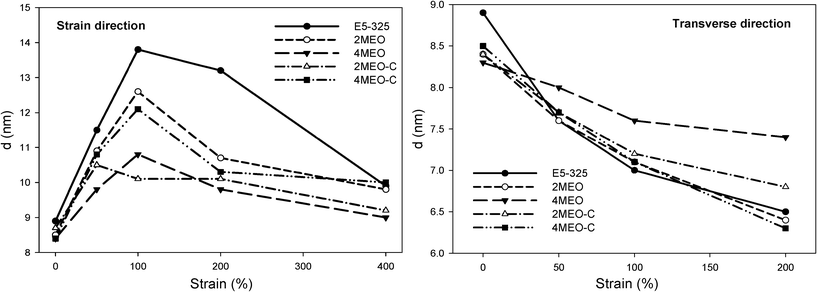 | ||
| Fig. 10 Estimated average hard domain spacing (d) of neat host TPU and nanocomposites determined from the ZP model in the strain and transverse direction. | ||
| Strain (%) | Material | Strain Direction | Transverse Direction | ||||
|---|---|---|---|---|---|---|---|
| d/nm | R/nm | σ/d | d/nm | R/nm | σ/d | ||
| a Expected uncertainty due to sample variations and curve fitting. | |||||||
| Uncertaintya | ±0.5 | ±0.5 | ±0.05 | ±0.5 | ±0.5 | ±0.05 | |
| 0 | E5-325 | 8.9 | 2.8 | 0.44 | 8.9 | 2.7 | 0.44 |
| 2MEO | 8.5 | 2.8 | 0.47 | 8.4 | 2.8 | 0.54 | |
| 4MEO | 8.4 | 2.9 | 0.64 | 8.3 | 2.9 | 0.50 | |
| 2MEO–C | 8.7 | 2.8 | 0.45 | 8.4 | 2.8 | 0.47 | |
| 4MEO–C | 8.4 | 2.8 | 0.46 | 8.5 | 2.8 | 0.54 | |
| 50 | E5-325 | 11.5 | 2.9 | 0.53 | 7.6 | 2.7 | 0.42 |
| 2MEO | 10.9 | 2.9 | 0.63 | 7.6 | 2.8 | 0.53 | |
| 4MEO | 9.8 | 2.9 | 0.64 | 8.0 | 2.9 | 0.53 | |
| 2MEO–C | 10.5 | 2.9 | 0.68 | 7.7 | 2.8 | 0.49 | |
| 4MEO–C | 10.8 | 2.9 | 0.65 | 7.7 | 2.7 | 0.52 | |
| 100 | E5-325 | 13.8 | 3.0 | 0.64 | 7.0 | 2.7 | 0.43 |
| 2MEO | 12.6 | 2.9 | 0.90 | 7.1 | 2.8 | 0.56 | |
| 4MEO | 10.8 | 2.9 | 0.80 | 7.6 | 2.8 | 0.58 | |
| 2MEO–C | 10.1 | 2.9 | 0.78 | 7.2 | 2.7 | 0.54 | |
| 4MEO–C | 12.1 | 2.8 | 0.99 | 7.1 | 2.7 | 0.55 | |
| 200 | E5-325 | 13.2 | 2.6 | 0.94 | 6.5 | 2.6 | 0.43 |
| 2MEO | 10.7 | 2.7 | 0.89 | 6.4 | 2.6 | 0.62 | |
| 4MEO | 9.8 | 2.7 | 0.84 | 7.4 | 2.5 | 0.90 | |
| 2MEO–C | 10.1 | 2.7 | 0.84 | 6.8 | 2.5 | 0.67 | |
| 4MEO–C | 10.3 | 2.7 | 0.83 | 6.3 | 2.5 | 0.61 | |
| 400 | E5-325 | 9.9 | 2.5 | 0.73 | 5.2 | 2.5 | 0.42 |
| 2MEO | 9.8 | 2.4 | 0.94 | — | — | — | |
| 4MEO | 9.0 | 2.5 | 0.95 | — | — | — | |
| 2MEO–C | 9.2 | 2.5 | 0.83 | — | — | — | |
| 4MEO–C | 10.0 | 2.5 | 0.82 | — | — | — | |
For the neat TPU, the average hard domain spacing (d) is observed to increase sharply in the strain direction at the initial stages of deformation. The randomly oriented hard domains subjected to tensile deformation, exhibited an increase of d-spacing from 8.9 nm to 13.8 nm upon 100% strain as the TPU hard blocks respond to the alignment of the soft segment chains.24 Subsequent deformation up to 400% strain resulted in a decrease in the hard domain spacing to 9.9 nm, as the hard segment aggregates were disrupted, broken down to smaller widths, and partially aligned in the direction of stretch. Further stretching resulted in no further change to the d spacing of the neat host TPU. Conversely, straining all of the TPU nanocomposites up to 200% is associated with smaller shifts of d in the strain direction, most notably seen in the stiffest 4MEO system. On the basis of TEM analysis, MEO demonstrated the best nanofiller dispersion and exfoliation. At higher loading of 4 wt% MEO, the “interparticle locking” resulting from the MEO exfoliation restricted the soft segment alignment under straining, as well as the hard segment mobility, and increased the modulus of the TPU. This led to a better retention of hard domain spacing upon deformation. It is also interesting to note that 2MEO–C system demonstrated an overall better retention of hard domain spacing than the 2MEO system, and it displayed the smallest d at 100% strain. This is particularly impressive given the overall property profile of this material. This is due to the positive end groups introducing a ‘grip-slip-grip’ interaction between the TPU segmental chain and the nanofiller, preventing the hard domains spacing further apart.
For all samples, a decrease in d is observed in the transverse direction with increasing strain. As expected, 4MEO, which is the stiffest material and involves the highest degree of interparticle interactions, showed the most substantial retention of d in the transverse direction. The ZP model was unable to fit the scattering data of high strained MEO nanocomposites in the transverse direction because the scattering peak had diminished. In all cases, the hard segment radius of gyration (R) did not change significantly over the entire strain range.
Nanofiller orientation during tensile deformation
The orientation of the nanofiller during uniaxial deformation plays an important role in the toughness enhancement of the TPU.24,28,47 The scattering profiles obtained from the deformation process provide very useful insights into morphological changes in the nanostructure during strain. Fig. 11 displays the selected 2D SAXS patterns of the neat host TPU and nanocomposites, obtained from the long sample-to-detector distance. Note that due to the limitation of experiment beamtime, only nanocomposites containing 4 wt% MEO and MEO–C were studied.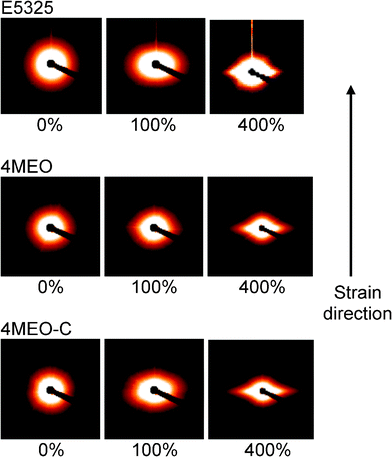 | ||
| Fig. 11 Selected 2D SAXS patterns at various strains for E5-325, 4MEO and 4MEO–C, obtained from the long sample-to-detector distance. | ||
In the initial unstrained state, all samples show isotropic SAXS patterns. For the neat TPU, the absence of nanofiller led to slightly anisotropic SAXS patterns upon straining up to 400%. In comparison, both MEO and MEO–C nanocomposites demonstrate different scattering geometry upon straining. A diamond-shaped pattern suggests that there was alignment of fluoromica tactoids in both the strain and transverse direction, presumably due to delamination of matrix and nanofiller in some instances, and effective load transfer and tactoid orientation in others.24,28 However, MEO–C nanocomposites exhibit a slightly sharper silicate scattering along the equatorial axis, indicating greater platelet alignment in the strain direction. TEM images displayed in Fig. 12 were taken after a few days of unloading from 400% strain. It is believed that tactoids in 4MEO–C act as well-bonded and moveable “concertina-like” ensembles, which are aligned in the direction of the strain during straining. However, after unloading, these tactoids undergo a reduction in alignment in the strain direction and rotated in ∼45° from the strain direction, due to the TPU relaxation (Fig. 12a&b). Meanwhile, the single modified fluoromica system, which is associated with a more exfoliated and interlocked nanofiller dispersion, certainly shows concrete evidence of more frustrated platelet orientation. Tensile stresses built at the interface of poorly aligned tactoids are believed to contribute to void formation (Fig. 12c) that was also evidenced via stress whitening (figure not shown). This nanocomposite morphology during loading and unloading was previously described by Finnigan et al. in the TPU-organofluoromica system.44
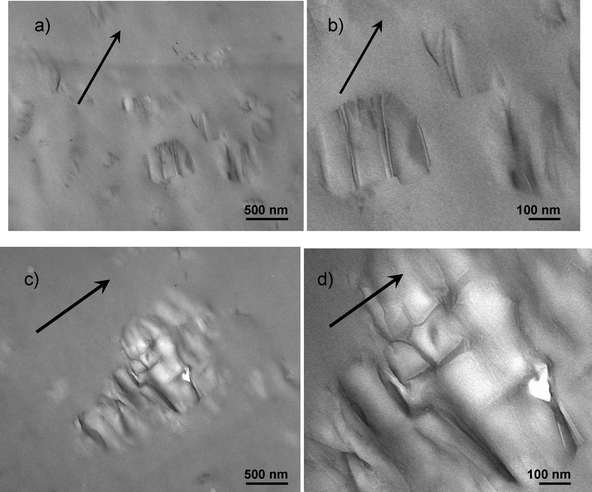 | ||
| Fig. 12 TEM micrographs of 4MEO–C (a & b) and 4MEO (c & d), which were taken after the TPU was relaxed after stretching to 400% strain. The arrows indicate the pre-strain direction. The dual modified tactoids in 4MEO–C are seen to ensemble in a “concertina-like” arrangement. 4MEO shows void formation due to interparticle locking and interphase failure. | ||
The Herman orientation function (f) was calculated at q = 0.0031, where the scattering is dominated by the organosilicates. These values were illustrated in Fig. 13. The degree of platelets alignment, especially at high strains (>50%) was significantly greater for 4MEO–C than for 4MEO nanocomposites. This suggests that the dual modified fluoromica aligns more preferentially in the strain direction than the single modified counterpart at a similar concentration during uniaxial tension of TPU, and consequently provides greater improvement in toughness. This was also supported by the TEM analysis displayed in Fig. 12. This further elucidates why the presence of MEO in the TPU led to a more pronounced stiffening effect and a reduction in tensile strength and elongation at break.
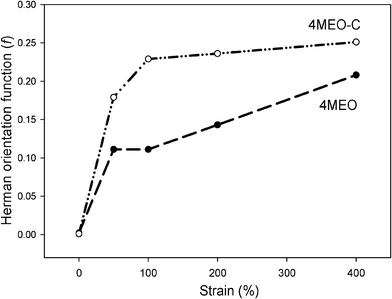 | ||
| Fig. 13 Herman orientation functions versus strains for 4MEO and 4MEO–C nanocomposites. | ||
Summary
E5-325 TPU displayed greater mechanical properties when compared with Nusil MED4860. These properties were further enhanced with the addition of dual modified MEO–C. At the same nanofiller concentration, MEO–C nanocomposites exhibited greater tensile and tear properties compared to MEO nanocomposites due to the presence of ODTMA/CC dual surfactants, allowing molecular interactions between the organofluoromica with both TPU hard and soft segments. In addition, the positive end groups formed as a result of trans-urethanization reactions during high temperature compounding in the extruder led to the “slip-grip-slip” interactions, enabling a reduced level of stiffening effect and at the same time enhancing the toughening mechanism. Such molecular interactions also successfully enhanced the dimensional stability of the TPU by increasing the creep resistance and retarding the stress relaxation of the TPU. Conversely, in the absence of CC surfactant, MEO nanoparticles exfoliated well in the TPU, inducing interparticle locking, and tended to interact preferentially with the soft segments. Such interactions caused a reduction in soft segment mobility, thus resulting in a substantial increase in tensile creep and storage modulus. Poor MEO-hard segments bonding led to reduced tensile strength and enhanced stress relaxation rate. These imbalanced interactions between MEO nanofiller with both soft and hard segments induced frustrated platelet orientation upon tensile deformation, thus retarding the toughening mechanism.Acknowledgements
The authors thank Aortech Biomaterials Pty Ltd and Cochlear Ltd for research materials and financial support. This work was carried out in part on the SAXS/WAXS beamline at the Australian Synchrotron, Victoria, Australia. We also appreciate the facilities and the scientific and technical assistance of the Australian Microscopy & Microanalysis Research Facility at the Centre for Microscopy and Microanalysis, The University of Queensland. Azlin F. Osman expresses her appreciation to the Ministry of Higher Education Malaysia and Universiti Malaysia Perlis for financial support. Finally, we also thank Mr Nunna Pardhasaradhi for technical help during the extrusion process.References
- J. Anderson, A. Hiltner, M. Wiggins, M. Schubert, T. Collier, W. Kao and A. Mathur, Polym. Int., 1999, 46, 163–171 CrossRef.
- P. Gunatillake, D. Martin, G. Meijs, S. McCarthy and R. Adhikari, Aust. J. Chem., 2003, 56, 545–558 CrossRef CAS.
- M. Lelah, S. Cooper, Polyurethanes in Medicines, CRC Press, Inc.; Boca Raton, FL, 1986, 225 Search PubMed.
- A. Simmons, A. Padsalgikar, L. Ferris and L. Poole-Warren, Biomaterials, 2008, 29, 2987–2995 CrossRef CAS.
- M. Szycher, J. Biomater. Appl., 1988, 3, 297 CrossRef CAS.
- R. Ward, J. Anderson, R. McVenes and K. Stokes, J. Biomed. Mater. Res., Part A, 2006, 77, 580–589 CrossRef.
- N. Lamba, K. Woodhouse, S. Cooper, M. Lelah, Polyurethanes in biomedical applications, CRC Press; Boca Raton, FL, 1998, 7 Search PubMed.
- K. E. Styan, D. J. Martin, A. Simmons and L. A. Poole-Warren, Acta Biomater., 2012, 8, 2243–2253 CrossRef CAS.
- R. Xu, E. Manias, A. J. Snyder and J. Runt, J. Biomed. Mater. Res., 2003, 64, 114–119 CrossRef.
- R. Xu, E. Manias, A. Snyder and J. Runt, Macromolecules, 2001, 34, 337–339 CrossRef CAS.
- S. Liff, N. Kumar and G. McKinley, Nat. Mater., 2007, 6, 76 CrossRef CAS.
- P. Gunatillake, G. Meijs, S. Mccarthy and R. Adhikari, J. Appl. Polym. Sci., 2000, 76, 2026–2040 CrossRef CAS.
- http://www.aortech.com/technology/elast-eon .
- E. Giannelis, Appl. Organomet. Chem., 1998, 12, 675–680 CrossRef CAS.
- J. Yang, Y. Han, J. Choy and H. Tateyama, J. Mater. Chem., 2001, 11, 1305–1312 RSC.
- G. Lagaly, Solid State Ionics, 1986, 22, 43–51 CrossRef CAS.
- T. Pinnavaia, Science, 1983, 220, 365 CAS.
- B. K. G. Theng, The chemistry of clay-organic reactions, Adam Hilger Ltd.; London: 1974 Search PubMed.
- A. Mishra, G. Nando and S. Chattopadhyay, J. Polym. Sci., Part B: Polym. Phys., 2008, 46, 2341–2354 CrossRef CAS.
- A. Mishra, S. Chattopadhyay and G. Nando, J. Appl. Polym. Sci., 2010, 115, 558–569 CrossRef CAS.
- L. S. T. J. Korley, S. M. Liff, N. Kumar, G. H. McKinley and P. T. Hammond, Macromolecules, 2006, 39, 7030–7036 CrossRef CAS.
- W. Kim, D. Chung and J. Kim, J. Appl. Polym. Sci., 2008, 110, 3209–3216 CrossRef CAS.
- A. K.Barick and D. K.Tripathy, J. Appl. Polym. Sci., 2010, 117, 639–654 CrossRef.
- A. F.Osman, G. A. Edwards, T. L. Schiller, Y. Andriani, K. S. Jack, I. C. Morrow, P. J. Halley and D. J. Martin, Macromolecules, 2012, 45, 198–210 CrossRef.
- K. T. Campbell, The structure of segmented polyurethane nanocomposites, PhD thesis, University of Queensland, 2005 Search PubMed.
- D. Martin and G. Edwards, Granted International Patent Application AU 2005279677 Polymer composites having particles with mixed organic modifications, 2011 Search PubMed.
- P. R. Laity, J. E. Taylor, S. S. Wong, P. Khunkamchoo, K. Norris, M. Cable, G. T. Andrews, A. F. Johnson and R. E. Cameron, Polymer, 2004, 45, 7273–7291 CrossRef CAS.
- B. Finnigan, K. Jack, K. Campbell, P. Halley, R. Truss, P. Casey, D. Cookson, S. King and D. Martin, Macromolecules, 2005, 38, 7386–7396 CrossRef CAS.
- F. Zernike and A. Prins, J. Zeitschrift für Physik A Hadrons and Nuclei, 1927, 41, 184–194 Search PubMed.
- R. A. Pethrick, J. Dawkins, Modern Techniques for Polymer Characterisation, J. Wiley; New York, 1999 Search PubMed.
- R. J. RoeIn Methods of X-ray and neutron scattering in polymer science, Oxford University Press; New York, 2000, 123 Search PubMed.
- M. M.Malwitz, S. Lin Gibson, E. K. Hobbie, P. D Butler and G. Schmidt, J. Polym. Sci., Part B: Polym. Phys., 2003, 41, 3237–3248 CrossRef.
- D. J. Martin, G. F. Meijs, P. A Gunatillake, S. J. McCarthy and G. M. Renwick, J. Appl. Polym. Sci., 1997, 64, 803–817 CrossRef CAS.
- T. Pinnavaia, T. Lan, Z. Wang, H. Shi and P. Kaviratna, Clay-reinforced epoxy nanocomposites: synthesis, properties, and mechanism of formation; ACS Publications; Washington DC, 1996, 250-261 Search PubMed.
- M. Alexandre and P. Dubois, Mater. Sci. Eng., R, 2000, 28, 1–63 CrossRef.
- C. Chen, C. Mao, M. Tsai, F. Yen, J. Lin, T. C. seng and H. Chen, J. Appl. Polym. Sci., 2008, 110, 237–243 CrossRef CAS.
- B. Finnigan, D. Martin, P. Halley, R. Truss and K. J Campbell, J. Appl. Polym. Sci., 2005, 97, 300–309 CrossRef CAS.
- J. Breu, W. Seidl, A. Stoll, K. Lange and T. Probst, Chem. Mater., 2001, 13, 4213–4220 CrossRef CAS.
- T. Choi, J. Weksler, A. Padsalgikar and J. Runt, Polymer, 2009, 50, 2320–2327 CrossRef CAS.
- R. Hernandez, J. Weksler, A. Padsalgikar and J. Runt, Macromolecules, 2007, 40, 5441–5449 CrossRef CAS.
- F. Yeh, B. Hsiao, B. Sauer, S. Michel and H. Siesler, Macromolecules, 2003, 36, 1940–1954 CrossRef CAS.
- C. Prisacariu, Polyurethane Elastomers: From Morphology to Mechanical Aspects, Springer Verlag; New York, 2011; 204 Search PubMed.
- S. Sternstein and A. J. Zhu, Macromolecules, 2002, 35, 7262–7273 CrossRef CAS.
- B. Finnigan, P. Casey, D. Cookson, P. Halley, K. Jack, R. Truss and D. Martin, Int. J. Nanotechnol., 2007, 4, 496–515 CrossRef CAS.
- R. Hernandez, J. Weksler, A. Padsalgikar, T. Choi, E. Angelo, J. Lin, L. Xu, C. Siedlecki and J. Runt, Macromolecules, 2008, 41, 9767–9776 CrossRef CAS.
- D. Martin, G. Meijs, G. Renwick, S. Mccarthy and P. Gunatillake, J. Appl. Polym. Sci., 1996, 62, 1377–1386 CrossRef CAS.
- D. Shah, P. Maiti, D.D. Jiang, C. A. Batt and E. P. Giannelis, Adv. Mater., 2005, 17, 525–528 CrossRef CAS.
| This journal is © The Royal Society of Chemistry 2012 |
