Optimization of immobilization parameters of Thermoanaerobacterium thermosaccharolyticum W16 on a new carrier for enhanced hydrogen production†
Lei
Zhao
a,
Guang-Li
Cao
ab,
Jing
Yao
a,
Hong-Yu
Ren
a,
Fang
Ma
a,
Nan-Qi
Ren
a and
Ai-Jie
Wang
*a
aState Key Laboratory of Urban Water Resource and Environment, School of Municipal and Environmental Engineering, Harbin Institute of Technology, P.O. Box 2614, 202 Haihe Road, Harbin, 150090, China. E-mail: hitsrb@163.com; Fax: +86 451 86282195; Tel: +86 451 86282195
bSchool of Life Science and Engineering, Harbin Institute of Technology, Harbin, 150090, China
First published on 25th July 2012
Abstract
A new biological carrier mycelia pellet was adopted for enhanced hydrogen production by Thermoanaerobacterium thermosaccharolyticum W16. Immobilization parameters were optimized by response surface methodology for achieving maximum hydrogen yield. To our best knowledge, this is the first report detailing the interaction of immobilization parameters of this bacterium on a mycelia pellet.
In recent years, dark fermentative hydrogen production has increasingly been advocated as a process which not only is environmentally benign and energy-saving, but also could yield hydrogen at a high rate with a concomitant reduction in environmental organic pollutants.1,2 This process has received extensive attention in the field of hydrogen production.3–5 Most researchers have devoted their efforts on the isolation of efficient pure anaerobic bacteria as hydrogen producers.6,7 At present, the utilization of thermophilic bacteria to produce hydrogen is more favorable, since high hydrogen efficiencies can be achieved and a wide range of substrates can be utilized during the fermentation process. Furthermore, from the perspectives of thermodynamics and kinetics, high temperatures are more conducive to the formation of hydrogen and the secretion of related enzymes. Besides, high temperatures could keep the hydrogen production environment from pollution by harmful bacteria, which would dramatically reduce the production environment control cost. In conclusion, thermophilic bacteria can produce hydrogen cleanly and efficiently, and the relatively easily implemented reaction conditions make the industrialization of fermentative hydrogen production more realizable. Although the yields of hydrogen under thermophilic conditions are high, they are still not high enough for commercial exploitation. One of the effective strategies to solve this problem is the improvement of cell density through whole cell immobilization.8,9
Hydrogen production with whole bacteria immobilization technology has become a hot point of research and displays well applied prospects. Keskin et al.10 found that when using pumice stone and a ceramic ring as the bacteria carrier, up to 4 mol and 5 mol hydrogen yields per mole of sucrose used were achieved, respectively. With Thermotoga neapolitana cells immobilized on a stable cationic hydrogel bearing amine groups, an average hydrogen production rate and yield of 50.6 mL L−1 h−1 and 3.3 mol H2/mol glucose were obtained.11 Despite the high hydrogen yield obtained, however, the carrier cost is still too high to further development. Taking all factors into account, it is necessary to select a carrier that has high thermal stability, mechanical properties, an immobilization effect, and at the same time owns the advantage of low-cost, to obtain a higher cell density and biological activity in the immobilization process.
In our previous work, traditional carriers, such as polyacrylamide gel, agar gel, and sodium alginate, were used to immobilize thermophilic bacteria T. thermosaccharolyticum W16, however, the carriers would melt over 12 h due to their weak heat resistant properties. In this research, the environmentally friendly biological carrier mycelia pellet was chosen as an immobilization matrix. Mycelia pellet is a kind of bio-granule formed spontaneously in the process of Aspergillus niger Y3 fermentation.12 It has some exceptional performance except for that mentioned above, for example, better biological activity, a shorter generation and propagating time, and unique physical properties (filamentous, porous and with a large surface area resulting in higher mass transfer properties and of benefit to the adhesion of the bacteria).13 The feasibility of using mycelia pellet as a solid support matrix for immobilization of mesophilic bacteria Clostridium sp. T2 has been reported previously; a high hydrogen performance was attained.13 In this research, the ability of mycelia pellets to immobilize T. thermosaccharolyticum W16 at 60 °C was assessed, and response surface methodology was used to analyze and optimize the immobilization parameters for enhanced hydrogen production for the first time.
Response surface methodology (RSM) of central composite design (CCD)14 was applied to optimize the variables of mycelia pellet dosage, mycelia pellet size, and culturing time with the purpose of obtaining the highest hydrogen yield during the immobilization fermentation process. The range and levels of the variables are shown in Table 1. Based on the CCD analysis, the experimental design and results are displayed in Table 2. The final model was obtained by multiple regression analysis of the experimental data and expressed by the following second-order polynomial equation:
| Y = 1780.44774 + 89.80291X1 + 84.95783X2 + 6.48409X3 + 23.25X1X2 − 0.15799X1X3 − 0.53906X2X3 − 30.7591X21 − 77.98848X22 − 0.033261X23 | (1) |
| Independent variables | Code | Range and levels | ||||
|---|---|---|---|---|---|---|
| −α | −1 | 0 | 1 | α | ||
| Mycelia pellet dosage | X 1 | 0.02 | 1 | 2.5 | 4 | 5.02 |
| Mycelia pellet size/mm | X 2 | 0.82 | 1.5 | 1.5 | 3.5 | 4.18 |
| Culturing time/h | X 3 | 15.3 | 48 | 96 | 144 | 176.7 |
| No | Variable levels | Y/ml L−1 | ||
|---|---|---|---|---|
| X 1 | X 2 | X 3 | ||
| 1 | 2.50 | 2.50 | 96.00 | 2333.33 ± 133.6 |
| 2 | 4.00 | 3.50 | 48.00 | 2154.67 ± 513.2 |
| 3 | 2.50 | 2.50 | 176.73 | 1946.67 ± 331.2 |
| 4 | 4.00 | 1.50 | 144.00 | 2096.67 ± 151.2 |
| 5 | 2.50 | 4.18 | 96.00 | 1904.00 ± 286.7 |
| 6 | 2.50 | 2.50 | 96.00 | 2333.33 ± 441.9 |
| 7 | 2.50 | 0.82 | 96.00 | 2259.00 ± 732.3 |
| 8 | 4.00 | 3.50 | 144.00 | 1942.67 ± 187.8 |
| 9 | 5.02 | 2.50 | 96.00 | 2028.67 ± 213.4 |
| 10 | 2.50 | 2.50 | 96.00 | 2333.33 ± 198.0 |
| 11 | 2.50 | 2.50 | 96.00 | 2333.33 ± 239.7 |
| 12 | 0.02 | 2.50 | 96.00 | 2184.00 ± 333.9 |
| 13 | 2.50 | 2.50 | 15.27 | 2224.00 ± 412.8 |
| 14 | 1.00 | 3.50 | 48.00 | 2120.00 ± 129.8 |
| 15 | 1.00 | 1.50 | 144.00 | 2247.00 ± 553.7 |
| 16 | 4.00 | 1.50 | 48.00 | 2236.00 ± 297.9 |
| 17 | 1.00 | 1.50 | 48.00 | 2310.00 ± 167.9 |
| 18 | 2.50 | 2.50 | 96.00 | 2333.33 ± 672.3 |
| 19 | 2.50 | 2.50 | 96.00 | 2333.33 ± 418.9 |
| 20 | 1.00 | 3.50 | 144.00 | 1922.67 ± 387.6 |
To validate the statistical results and the model equation, an analysis of variance (ANOVA) was conducted and the results are shown in Table 3. The F-value of 42.02 and p-value of less than 0.0001 implied significant model fit. The correlation coefficient (R2) of 0.9742 indicated that only 2.58% of the total variation could not be explained by the empirical model. Furthermore, “adequate precision” measures the signal to noise ratio. A ratio greater than 4 is desirable; a ratio of 17.863 indicated adequate signal, which meant the model could be used to navigate the design space.15 These findings indicated that the model equation obtained was statistical for predicting the effects of mycelia pellet dosage, mycelia pellet size, and culture time on cumulative H2 volume.
It can also be seen from Table 3 that the linear and quadratic effects of mycelia pellet dosage, mycelia pellet size and culture time, as well as the interactive effect between mycelia pellets and mycelia pellet size were highly significant (p < 0.05), while the interactive effects between mycelia pellet size and culture time, mycelia dosage and culture time were not so significant. These results further indicated that these terms had great impact on experimental results.
From eqn (1), the optimal values of mycelia pellet dosage, mycelia pellet size, and culture time were found to be 2 dosage 150 ml−1 medium (one dosage contains mycelia pellets of dry weight 0.175 g), 1.85 mm, and 78 h, respectively. As a result, the predicted maximum cumulative H2 volume was 2528.3 ml L−1, the corresponding H2 yield was 2.5 molH2/mol glucose.
The two-dimensional response surface plots and three-dimensional curves of the corresponding response surfaces on cumulative H2 volume over independent variables are shown in Fig. 1–3. Each response surface exhibited the interaction between variables, with one variable being kept constant and the other two variables varying within the experimental range.16
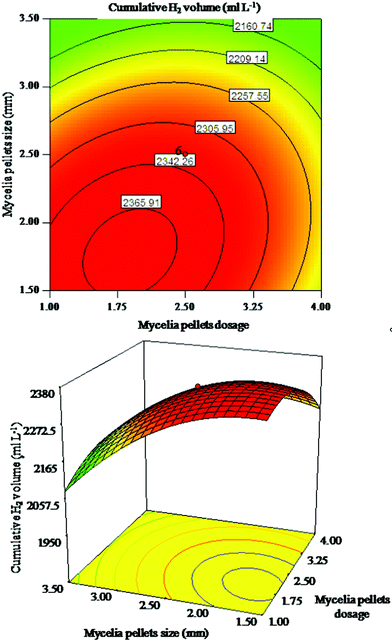 | ||
| Fig. 1 Response surface plot and corresponding contour plot for interaction of mycelia pellet size and mycelia pellet dosage on cumulative H2 volume. | ||
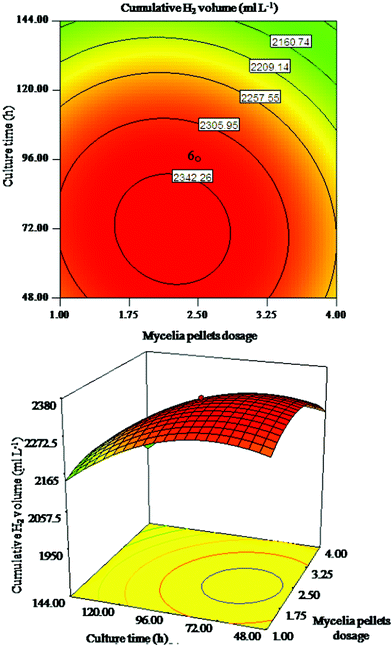 | ||
| Fig. 2 Response surface plot and corresponding contour plot for interaction of mycelia pellet dosage and culture time on cumulative H2 volume. | ||
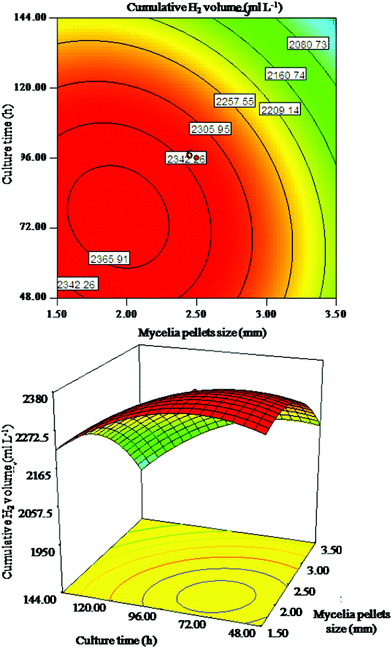 | ||
| Fig. 3 Response surface plot and corresponding contour plot for interaction of mycelia pellet size and culture time on cumulative H2 volume. | ||
In Fig. 1, the cumulative H2 volume increased with the increasing mycelia pellet dosage and mycelia pellet size to its optimum range, but decreased with a further increase. The alteration of mycelia pellet size seemed more important than that of mycelia pellet dosage on cumulative H2 volume. Fig. 2 indicates that the alteration of culture time is relatively more important than mycelia pellet dosage on cumulative H2 volume. As shown in Fig. 3 the alteration of mycelia pellet size had a significant effect on cumulative H2 volume, whereas the effect of culture time was less. What is more, the two-dimensional response surface plots in Fig. 2 and Fig. 3 showed a symmetrical mound shape with the maximum response occurring within the central contour,17 which indicated that the interaction of mycelia pellet dosage and culture time, mycelia pellet size and culture time on cumulative H2 volume was slight. In conclusion, the arrangement of the importance of the three variables on cumulative H2 volume is: mycelia pellet size > culture time > mycelia pellet dosage. This may be due to the fact that the smaller pellets have a more compact surface structure as well as more open periphery regions and a higher pellet concentration,18 which allows the bacteria to gain access to more and more substrates resulting in higher gas production. Culture time of the mycelia pellets is also one of the important controlling factors in immobilized hydrogen production, because at the appropriate cultivation time, the stability and mechanical properties of the mycelia pellets could reach their highest, and the greater biomass would be retained in the culture, leading to higher hydrogen yield.
Experiments were carried out in triplicate to confirm the predicted results as shown in Fig. 4. It was found that under the optimal conditions, the H2 yield reached a maximum of 2.45 mol H2/mol glucose after 36 h fermentation, which agreed very closely with the predicted value, 20.1% higher than optimized before.
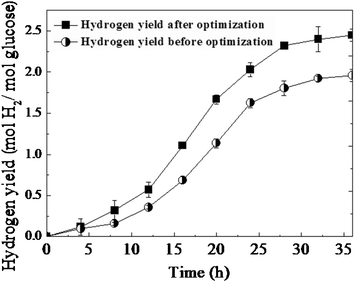 | ||
| Fig. 4 Time course of hydrogen yield from mycelia pellet immobilized T. thermosaccharolyticum W16. | ||
To further confirm the effectiveness of mycelia pellet immobilization, mycelia pellets before and after immobilization were investigated by means of scanning electron microscopy. Obviously, mycelia pellets showed a smooth surface and compacted structure before the immobilization of T. thermosaccharolyticum W16 (Fig. 5a). While, after immobilization, the surfaces of the mycelia pellets became rough and their diameter bigger due to the adsorption effect and the gas produced by T. thermosaccharolyticum W16 during immobilization potentially entering the mycelia pellets (Fig. 5b). For a deep insight into the mycelia pellets, as shown in Fig. 5c and Fig. 5d, the surface of mycelia was covered by bacteria compared to that without immobilization, which revealed a large quantity of bacteria was absorbed on mycelia. These results demonstrated that the application of the immobilized method for highly efficient dark fermentative hydrogen production by a biological carrier was appropriate.
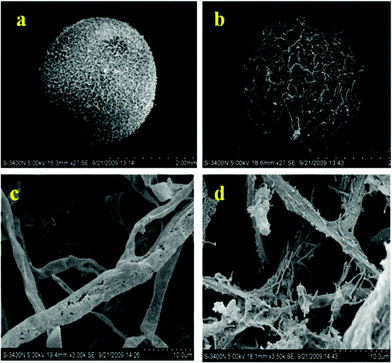 | ||
| Fig. 5 Morphological observations on the structures of mycelia pellets (a: raw mycelia pellet; b: mycelia pellet after immobilization; c: raw mycelia; d: mycelia after immobilization). | ||
Table 4 compares the H2 yields using different immobilization carriers. It can be inferred that the performance of the hydrogen producing strain immobilized on the mycelia pellets of this work is comparable or even better than using other carriers such as synthetic polymers or inorganic materials reported in the relevant studies. Mycelia pellets have good mechanical strength and high thermal stability during the fermentation process, the surface structure is compact and no loosening or shedding of mycelium has been found, which would retain the biomass at the maximum degree, as a result allowing efficient and stable hydrogen production. These results indicate that mycelia pellet is the optimum carrier for enhanced hydrogen production either in mesophilic or thermophilic conditions.
| Microorganism | Substrate | Carrier | H2 yield (mol H2/mol substrate) | Reference |
|---|---|---|---|---|
| C. tyrobutyricum JM1 | Glucose | Polyurethane foam | 1.79 | 19 |
| C. butyricum TISTR 1032 | Sucrose | Sugarcane bagasse | 1.34 | 20 |
| Anaerobic sludge | Sucrose | Silicone gel | 3.79 | 21 |
| Anaerobic sludge | Sucrose | Ethylene-vinyl acetate | 1.74 | 22 |
| Mixed culture | Sucrose | Ceramic ball | 3.03 | 10 |
| Mixed culture | Glucose | Plastic carriers | 2.21 | 23 |
| Thermotoga neapolitana | Glucose | Cationic hydrogel bearing amine groups | 3.3 | 11 |
| T. thermosaccharolyticum W16 | Glucose | Mycelia pellets | 2.45 | This study |
This work studied the hydrogen production by immobilized T. thermosaccharolyticum W16 on mycelia pellets under thermophilic conditions. The conditions of different variables, mycelia pellet dosage, mycelia pellet size, and culturing time for achieving maximum hydrogen yield were optimized by response surface methodology. Tthe hydrogen yield of 2.45 molH2/mol glucose was attained when mycelia pellet dosage, mycelia pellet size and culturing time were 2 dosage 150 ml medium−1, 1.85 mm, and 78 h, respectively. Scanning electron microscopy images further indicated T. thermosaccharolyticum W16 immobilized on the biological carrier well. To achieve hydrogen production by immobilized T. thermosaccharolyticum W16 on mycelia pellets for use in a commercial scale process, continued hydrogen production should be carried out in the future.
Acknowledgements
This research was supported by the National High-tech R&D Program of China (863 Program, Grant No.2009AA064702 and No. 2009AA062906), by the National Natural Science Foundation of China (Grant No. 51111140388, No. 51178140, No. 30870037, and No. 31100095), by the National Creative Research Groups Project (Grant No.51121062), and by the National Key Technology Research and Development Program of the Ministry of Science and Technology of China (2010BAC67B02), by the State Key Laboratory of Urban Water Resource and Environment, HIT (Grant No. HCK201019), the Fundamental Research Funds for the Central Universities (No. HIT. NSRIF. 2011019), China Postdoctoral Science Foundation (20110491053), Open Project of State Key Laboratory of Urban Water Resource and Environment, Harbin Institute of Technology (No. HC201114), the Fundamental Research Funds for the Central Universities (No. HIT. NSRIF. 2011019), and the Heilongjiang Province Postdoctoral Science Foundation (LBH-Z11133).References
- S. V. Mohan, Y. V. Bhaskar and P. N. Sarma, Water Res., 2007, 41, 2652–2664 CrossRef CAS.
- G. Wang, H. Wang, W. Li and J. Bai, RSC Adv., 2011, 1, 1585–1592 RSC.
- Y. Akutsu, Y. Y. Li, H. Harada and H. Q. Yu, Int. J. Hydrogen Energy, 2009, 34, 2558–2566 CrossRef CAS.
- G. Davila-Vazquez, C. B. Cota-Navarro, L. M. Rosales-Colunga, A. Leon-Rodriguez and E. Razo-Flores, Int. J. Hydrogen Energy, 2009, 34, 4296–4304 CrossRef CAS.
- Z. L. Yuan, H. J. Yang, X. H. Zhi and J. Q. Shen, Int. J. Hydrogen Energy, 2009, 35, 2622–2626 CrossRef.
- N. Q. Ren, D. Y. Wang, C. P. Yang, L. Wang, J. L. Xu and Y. F. Li, Int. J. Hydrogen Energy, 2010, 35, 2877–2882 CrossRef CAS.
- P. Noparat, P. Prasertsan and S. O-Thong, Int. J. Hydrogen Energy, 2011, 36, 14086–14092 CrossRef CAS.
- S. O-Thong, P. Prasertsanc, D. Karakasheva and I. Angelidakia, Int. J. Hydrogen Energy, 2008, 33, 6498–6508 CrossRef CAS.
- J. H. Jo, D. S. Lee, D. Park and J. M. Park, Bioresour. Technol., 2008, 99, 6666–6672 CrossRef CAS.
- T. Keskin, E. Aksöyek and N. Azbar, Int. J. Hydrogen Energy, 2011, 36, 15160–15167 CrossRef CAS.
- M. A. Basile, C. Carfagna, P. Cerruti, G. Gomez d'Ayala, A. Fontana, A. Gambacorta, M. Malinconico and L. Dipasquale, RSC Adv., 2012, 2, 3611–3614 RSC.
- G. Bayramoglu, I. Gursel and Y. Tunali, Bioresour. Technol., 2009, 100, 2685–2691 CrossRef CAS.
- L. Zhao, G. L. Cao, A. J. Wang, W. Q. Guo, B. F. Liu, H. Y. Ren, N. Q. Ren and F. Ma, Int. J. Hydrogen Energy, 2012, 37, 162–166 CrossRef CAS.
- Z. M. Zheng, Q. L. Hu, J. F. Xu, N. N. Guo, Y. Sun and D. H. Liu, Bioresour. Technol., 2008, 99, 1052–1056 CrossRef CAS.
- J. L. Wang and W. Wan, Int. J. Hydrogen Energy, 2008, 33, 6976–6984 CrossRef CAS.
- G. L. Cao, N. Q. Ren, A. J. Wang, W. Q. Guo, J. Yao, Y. J. Feng and Q. L. Zhao, Bioresour. Technol., 2010, 101, 2053–12058 CrossRef CAS.
- Y. Mu, X. J. Zheng and H. Q. Yu, Int. J. Hydrogen Energy, 2009, 34, 7959–7963 CrossRef CAS.
- H. El-Enshasy, J. Kleine and U. Rinas, Process Biochem., 2006, 41, 2103–2112 CrossRef CAS.
- H. Zheng, R. J. Zeng and I. Angelidaki, Biotechnol. Bioeng., 2008, 100, 1034–1038 CrossRef CAS.
- C. N. Lina, S. Y. Wu and J. S. Chang, Int. J. Hydrogen Energy, 2006, 31, 2200–2210 CrossRef.
- S. Y. Wu, C. N. Lin, J. S. Chang and J. S. Chang, Int. J. Hydrogen Energy, 2005, 30, 1375–1381 CrossRef CAS.
- H. J. Jo, D. S. Lee and J. M. Park, Bioresour. Technol., 2008, 99, 8485–8491 CrossRef.
- P. Plangklang, A. Reungsang and S. Pattra, Int. J. Hydrogen Energy, 2012 DOI:10.1016/j.ijhydene.2012.02.186.
Footnote |
| † Electronic supplementary information (ESI) available: Experimental section. See DOI: 10.1039/c2ra20870a |
| This journal is © The Royal Society of Chemistry 2012 |