Microstructural and thermal investigations of HfO2 nanoparticles
Girija S.
Chaubey
a,
Yuan
Yao
a,
Julien P. A.
Makongo
a,
Pranati
Sahoo
a,
Dinesh
Misra
a,
Pierre F. P.
Poudeu
ab and
John B.
Wiley
*a
aAdvanced Materials Research Institute and Department of Chemistry, University of New Orleans, New Orleans, LA 70148, USA
bLaboratory for Emerging Energy and Electronic Materials, Department of Materials Science and Engineering, University of Michigan, Ann Arbor, 48109, USA. E-mail: jwiley@uno.edu; Fax: +1 504-280-6860; Tel: +1 504-280-6849
First published on 28th August 2012
Abstract
Monodispersed HfO2 nanoparticles can be readily prepared at room temperature by the ammonia catalyzed hydrolysis and condensation of hafnium(IV) tert-butoxide in the presence of a surfactant. The nanoparticles are faceted with an average diameter of about 4 nm. The as-synthesized amorphous nanoparticles crystallize upon post-synthesis heat treatment. The crystallization temperature of the nanoparticles can be controlled by adjusting the annealing atmosphere. The HfO2 nanoparticles have a narrow size distribution, large specific surface area and the thermal conductivity of pressed pellets is drastically reduced compared to the bulk counterpart. The specific surface area was about 239 m2 g−1 on as-prepared samples while those annealed at 500 °C have a surface area of 221 m2 g−1 showing that the heat treatment produced no significant increase in particle size. Transmission electron microscopy (TEM) further confirmed that the nanoparticles annealed at different temperatures while X-ray diffraction studies of the crystallized nanoparticles revealed that HfO2 nanoparticles were monoclinic in structure. High density pellets of the as-synthesized HfO2 nanoparticles were obtained, using both spark plasma sintering and uniaxial hot pressing, and their thermal conductivity was measured in the temperature range from 300 to 775 K. A large reduction of the thermal conductivity was observed for HfO2 nanoparticles as compared to that of bulk HfO2. The decrease in thermal conductivity is discussed in terms of the microstructure of the compacted samples. The synthetic procedure used in this work can be readily modified for large scale production of monodispersed HfO2 nanoparticles.
Introduction
Nanomaterials exhibit size-dependent magnetic, electronic, optical, thermal, chemical and mechanical properties that can be altogether different than their bulk counterparts.1 Rigorous research efforts have been made on the synthesis of well-defined uniform nanocrystals to determine their size-dependent properties.2 Despite their many technological applications, relatively little research have been conducted on the synthesis of ceramic nanocrystals.Hafnium oxide (HfO2) is a significant ceramic material due to its large dielectric constant (ε ∼ 30), large band gap (>5 eV), high melting point (∼2758 °C) and chemical inertness. Hafnia-based oxides are emerging as a leading material to replace silica as the gate insulator in field effect transistors3 and in carbon tube-based non-volatile RAM.4 They are also widely applied in optical coatings,5 catalysis6 and sensors.7 HfO2 nanoparticles may also be used as the filler in proton conducting membranes for proton-exchange membrane fuel cells and can be adopted for the development of core/shell nanoparticles with ZrO2.8 It is expected that the use of HfO2 particles in the nanosize-regime with specific crystal morphologies may further enhance performance and allow for a fine-tuning of properties in the various applications. If, for example, surface areas are increased due to nanosized particles, this should greatly enhance catalytic activity or sensor properties relative to their bulk counterparts. In addition, owing to high chemical and thermal stability, HfO2 nanostructure has great potential to be used in energy conversion applications.9
The structure of bulk HfO2 varies with temperature.10 From room temperature to 1700 °C, HfO2 exists in a monoclinic structure; above this temperature, a tetragonal structure exists until 2600 °C and beyond that, HfO2 becomes cubic. The two high-temperature phases are unstable in the bulk form at ambient temperature. However, by controlling the particle size below 30 nm, high temperature tetragonal and cubic phases can be stabilized at room temperature.11 This is due to the fact that these high temperature phases have lower free surface energy as compared to the low temperature monoclinic phase.
One potential application of such ceramic materials involves the homogeneous dispersion of nanoparticles into bulk thermoelectric matrices. The embedded nanoparticles could act as additional phonon scattering centres with the mean-free-path considerably reduced, which in turn, results in a significant reduction of lattice thermal conductivity. This strategy has been shown to reduce thermal conductivity of materials and improve their thermoelectric performance.9 For applications in high temperature thermoelectrics, where nanoparticles are introduced to reduce thermal conductivity, it is desirable that the particles exhibit high thermal and chemical stability.9 It is also important that the embedded nanoparticles have low thermal conductivity.
While the thermal conductivity of thin film and bulk HfO2 has been reported,12 little attention has been given to the study of the thermal conductivity of HfO2 in the nanoscale. Several methods have been developed to synthesize pure and doped hafnia nanoparticles, including solvothermal,13,14 hydrothermal,15,16 microwave hydrothermal,17 and nonhydrolytic sol–gel synthesis.18,19 Most of these methods require high temperature, high pressure, or environmental unfriendly capping ligands that may not be suitable for large scale production.
Here we report a facile room-temperature synthesis of hafnia nanoparticles by controlled hydrolysis and condensation of metal alkoxide precursors in the presence of a surfactant. A systematic study of different reaction parameters including precursor concentration and aging time on the size of nanoparticles was carried out. We have also studied the effects of post-synthesis heat treatment parameters, such as the annealing time, temperature, and atmosphere on the crystallization of the nanoparticles, their thermal stability and on the removal of surface stabilizing agents. Further, the thermal conductivity of pressed pellets of HfO2 nanoparticles compacted by uniaxial hot press (HP) and spark plasma sintering (SPS) was investigated and their behaviours are correlated to grain growth and surfactant removal during high temperature compaction. Preliminary results on the synthesis and stability of HfO2 nanoparticles were reported elsewhere.20
Experimental
All the reagents in this study are commercially available. Hafnium(IV) tert-butoxide liquid (99.99%) and Igepal CO-520 (polyoxyethylene (5) nonylphenylether, ((C2H4O)n·C15H24O, n ∼ 5)) were obtained from Sigma Aldrich, cyclohexane (ACS, +99%) from Alfa Aesar and ammonium hydroxide (28–30% w/w) from J. T. Baker Chemical. All the reactions were carried out under nitrogen inert atmosphere.Synthesis of HfO2 nanoparticles
A 125 ml flask with a magnetic stir bar was filled with 80 ml of cyclohexane. 0.5 ml Igepal CO-520 was then injected into the flask and the mixture was then stirred for 30 min under inert atmosphere. 0.2 ml of the NH4OH solution was added and the mixture was stirred for another 5 min or until the reaction mixture become transparent. 0.4 ml of hafnium(IV) tert-butoxide was injected drop-wise with vigorous stirring under a continuous flow of nitrogen. The colour change from transparent to milky white was consistent with nanoparticle formation. The white product was precipitated on ethanol addition and then the sample was centrifuged to separate the solid. The product was first air dried and then placed in an oven at 70 °C for one day. The synthesis yielded about 0.25 g for every 0.4 ml of hafnium(IV) tert-butoxide used. Several reaction parameters such as the amount of surfactant, and reaction time were varied to determine their impact on the size and morphology of the nanoparticles.Characterization
Transmission electron microscopy (TEM) was carried out on the nanoparticles using a JEOL 2010. Nanoparticle samples were prepared by drying a hexane dispersion on amorphous carbon coated copper grids. X-ray diffraction (XRD) patterns were collected on a Philips X'pert. The diffractometer was equipped with Cu-Kα radiation (λ = 1.5406 Å) and a curved graphite monochromator. BET surface area measurements were done on Micromeritics ASAP 2020.Specimens for thermal conductivity measurements were fabricated by spark plasma sintering (SPS) or hot pressing fine powders of the synthesized HfO2 nanoparticles under a dynamic vacuum of ∼10−4 Torr. Pellets obtained from spark plasma sintering were prepared by cold pressing the HfO2 nano-powder under a uniaxial pressure of 50 MPa in a graphite die, followed by heating at a rate of 100 °C min−1 from 25 °C to 700 °C. Once this temperature was reached the ramp was cut back to 50 °C min−1 up to the final temperature of 1000 °C. The total heating time was 13 min including the heating ramp. After consolidation was completed, as indicated by no net displacement of the pressing piston, the sample was allowed to cool to room temperature simultaneously with a pressure release. The pellet density was determined from the specimen dimensions and weight.
Pellets obtained by uniaxial hot press (Thermal Technology LLC, Model HP20) were achieved by applying simultaneously a maximum pressure of 100 MPa and a maximum temperature of 850 °C. The samples were placed into a graphite die with an inner diameter of 10 mm and then sintered in a vacuum. The final working set point of pressure (100 MPa) was first reached with a ramp of 2 MPa min−1, followed by a hold of 6 h while the temperature was still rising at a heating rate of 5 °C min−1 to 850 °C; a dwell time of 2 h was observed for higher strengthening and good compaction. After the sintering and pressing times were finished, the sample was cooled to room temperature at a cooling rate of 5 °C min−1 simultaneously with a pressure release (2 MPa min−1). HfO2 pellets were examined using transmission electron microscopy (TEM) to probe grain growth during pressing.
Thermal diffusivity data were measured using a Netzsch LFA 457 laser flash system. A Pyroceram reference material was measured alongside each sample. Measurements were made under flowing N2 gas (>30 ml min−1) from 300 K to 775 K at increments of 25 K. Cp values for thermal conductivity calculations were extracted from the laser flash data.
Results
To evaluate the size, shape and crystallinity, the samples were examined by TEM. Fig. 1 shows images of as-synthesized HfO2 nanoparticles and nanoparticles annealed at 600 °C. As-synthesized nanoparticles were amorphous in nature (Fig. 1A) as indicated by the poorly defined nanocrystal boundaries. In order to develop crystallinity and determine the structure, nanoparticles were annealed at increasing temperatures for different time intervals under various atmospheres. Fig. 1B shows a TEM image of the HfO2 nanoparticles annealed at 600 °C under oxygen for 4 h. Nanoparticles appear agglomerated due to the decomposition of the surfactant during annealing. Inset shows the high resolution TEM (HRTEM) image of a single crystal HfO2 nanoparticles annealed at 600 °C under oxygen atmosphere. The interfringe spacing of 0.31 nm corresponds to the (−111) plane of HfO2 (d = 0.315 nm).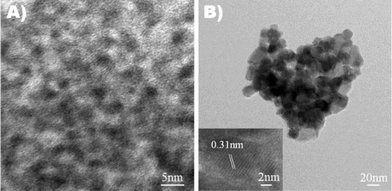 | ||
| Fig. 1 TEM images of (A) as-synthesized HfO2 nanoparticles and (B) HfO2 nanoparticles annealed at 600 °C in oxygen atmosphere for 4 h. Inset: HRTEM image of oxygen annealed HfO2 nanoparticles. | ||
Fig. 2 shows XRD patterns of the as-synthesized nanoparticles and those annealed at different temperatures for 1 h under argon. As-synthesized nanoparticles were amorphous in nature as indicated by the appearance of broad XRD peak (Fig. 2A) at around 2θ = 33°. It is also clear from the figure that annealing the sample up to 400 °C (Fig. 2C) for 1 h under argon did not result in improved nanoparticle crystallinity. However, upon increasing the annealing temperature to 500 °C, the nanoparticles became crystalline as shown by the emergence of all major peaks of the monoclinic HfO2 phase (Fig. 2D). All diffraction peaks were indexed in the monoclinic structure of HfO2 and no secondary peaks were observed, consistent with the high sample purity. The broadness of the peaks indicates that the nanoparticles are very small and did not grow in size during heat treatments, even up to 700 °C (Fig. 2E and 2F).
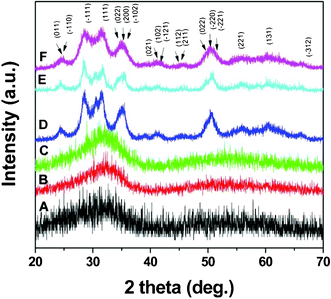 | ||
| Fig. 2 XRD pattern of the (A) as-synthesized HfO2 nanoparticles annealed at (B) 300 °C (C) 400 °C (D) 500 °C (E) 600 °C and (F) 700 °C for 1 h under argon atmosphere (only major peaks are indexed). | ||
Nanoparticles with lower crystallization temperatures are desired for many technological applications. This prevents nanoparticles from unwanted growth and sintering during high temperature annealing. Annealing time and atmosphere affects the crystallization temperature of the nanoparticles. To explore possible routes to decrease the crystallization temperature, the annealing time was increased from 1 h to 4 h, keeping the same argon atmosphere. Fig. 3 shows XRD patterns of HfO2 nanoparticles annealed at 300 °C and 400 °C for 4 h. The presence of the broad peak indicates that increased annealing time does not have any noticeable effect on the crystallization of the HfO2 nanoparticles.
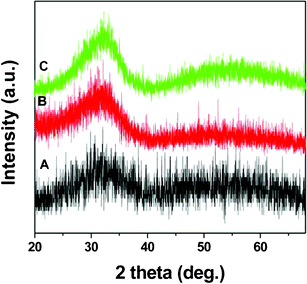 | ||
| Fig. 3 XRD pattern of the (A) as-synthesized HfO2 nanoparticles and annealed at (B) 300 °C (C) 400 °C for 4 h under argon atmosphere. | ||
Additional studies were carried out to gauge the impact of atmosphere on the annealing process. Fig. 4 shows XRD patterns of HfO2 nanoparticles annealed at different temperatures under oxygen atmosphere for 4 h. It was interesting to find that HfO2 nanoparticles can be well crystallized at as low as 300 °C when annealed under an oxygen atmosphere. Further, the HfO2 nanoparticles were separately annealed under reductive (10% H2 in N2) atmosphere for 4 h. Fig. 5 shows the XRD pattern of HfO2 nanoparticles annealed at 500 °C for 4 h. It is clear from Fig. 5 that even 500 °C temperature was not enough to crystallize the HfO2 nanoparticles annealed for 4 h under reductive atmosphere. This suggests that the oxygen plays a key role in lowering the crystallization temperature.
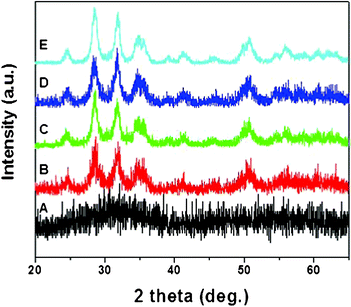 | ||
| Fig. 4 XRD patterns of (A) as-synthesized HfO2 nanoparticles and annealed at (B) 300 °C, (C) 400 °C, (D) 500 °C, and (E) 600 °C under oxygen atmosphere for 4 h. | ||
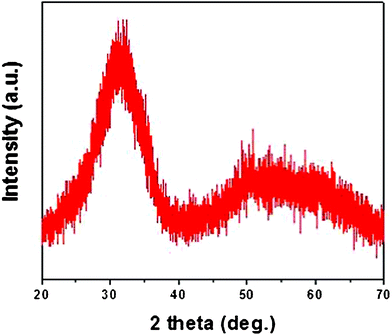 | ||
| Fig. 5 XRD of HfO2 nanoparticles annealed at 500 °C for 4 h under reductive atmosphere (10% H2 in N2). | ||
Fig. 6 shows an HRTEM image of the HfO2 nanoparticles annealed at 300 °C for 4 h under oxygen atmosphere. The average particle size was determined to be around 10 nm. The size extracted from TEM is in good agreement with the values derived from XRD measurements, suggesting that nanoparticles are single crystalline in nature. The interfringe spacing of 0.31 nm can again be assigned to the (−111) plane of the HfO2.
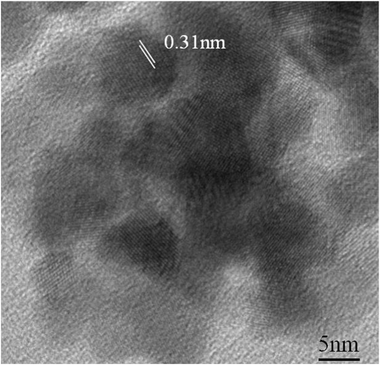 | ||
| Fig. 6 HRTEM image of the HfO2 nanoparticles annealed at 300 °C for 4 h under oxygen atmosphere. An interfringe spacing of 0.31 nm is observed. | ||
During synthesis, different reaction parameters were varied to observe the change in morphology and size of the nanoparticles. No major change in nanoparticle size or shape was seen on increasing the amount of surfactant from 0.5 ml to 1.5 ml and, similarly, there was no substantial change in nanoparticle size observed when reactions were carried out for 4, 8, 12 and 18 h. This is likely due to a rapid rate of hydrolysis.
Table 1 shows the variation in BET surface area of HfO2 nanoparticles upon annealing under argon for 1 h. It can be seen that there is no significant change in surface area on treatment, indicating the high thermal stability of the HfO2 nanoparticles. This result was further confirmed by measuring nanoparticle sizes from TEM images.
| HfO2 nanoparticle (annealing T/°C) | Annealing time in argon atmosphere (h) | Particles size from TEM (nm) | BET surface area (m2 g−1) |
|---|---|---|---|
| RT | — | 3–4 | 239 |
| 300 | 1 | 3–4.5 | 232 |
| 400 | 1 | 4–5 | 228 |
| 500 | 1 | 5–6 | 218 |
The performance of thermoelectric materials can often be improved by the uniform dispersion of nanoparticles in the thermoelectric host matrix.9 Nanoparticles act as additional phonon scattering centres, reducing considerably the phonon mean-free-path and consequently, decreasing the lattice thermal conductivity of the host matrix. It is important that the embedded nanoparticles have low thermal conductivity. Also, they should not grow significantly in size, but should show good chemical stability during high temperature compaction. Due to their high thermal stability and inertness, HfO2 nanoparticles are viable candidates for incorporation into thermoelectric matrices. To investigate their suitability for such applications, HfO2 nanoparticles were compacted using SPS and uniaxial hot pressing techniques and their resulting properties investigated.
Fig. 7 shows XRD patterns of HfO2 samples compacted at 1000 °C by SPS and 850 °C by uniaxial hot pressing. It is clear from the figure that the SPS compacted sample shows sharp and narrow peaks indicating significant grain growth during compaction. In comparison, XRD peaks for the hot pressed sample are broader, indicating marginal grain growth.
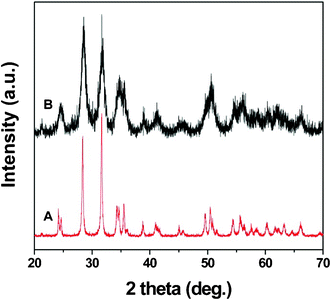 | ||
| Fig. 7 X-ray diffraction patterns of HfO2 samples compacted at (A) 1000 °C by Spark Plasma Sintering and (B) 850 °C by uniaxial hot pressing. | ||
Fig. 8 presents TEM images of the SPS and hot pressed samples. The grain size for the hot pressed sample was found to be in the range of 10–12 nm, which is in close agreement with the size measured from XRD. In comparison, TEM shows grain sizes in range of 60–70 nm for SPS consolidated sample. The observed large grains growing during the SPS procedure can be attributed to the high temperature (1000 °C) used, but also to the decomposition of the organic surfactants by the electrical discharges generated between grains. In the hot pressing procedure, the organic surfactants are trapped between grains in the pellets preventing significant grain growth. The grains in both the samples are randomly oriented (Fig. 8).
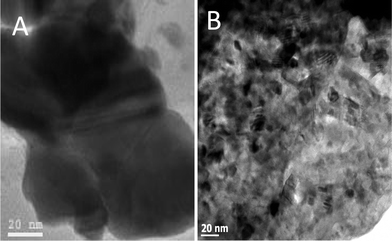 | ||
| Fig. 8 TEM images of the HfO2 nanoparticles compacted by (A) SPS at 1000 °C and (B) hot pressed at 850 °C. | ||
Fig. 9 shows the temperature dependent thermal conductivity of the HfO2 nanoparticles after SPS and uniaxial hot pressing. The thermal conductivity of both SPS and hot pressed samples were corrected for porosity contribution. It is known that porosity can reduce the thermal conductivity of the specimen,21 therefore, reduction of thermal conductivity due to porosity should be corrected to estimate values for a fully dense specimen. This can be calculated from observed thermal conductivity by using equation λporous/λdense = 1 − 3φ/2, where φ is the relative porosity in porous specimens.21 Our calculations show that the SPS and hot pressed samples have 19.5% and 14% porosity, respectively. (The thermal conductivity λ was calculated from the thermal diffusivity D, heat capacity Cp, and density ρ by using following equation: λ = DCpρ.) Higher porosity in the SPS sample could be due to (1) the rapid and short period of compaction and/or (2) the decomposition of surfactants from the surface of HfO2 grains during compaction. The thermal conductivity of HfO2 for both samples decreases with increasing temperature, which indicates that phonon conduction is predominant.22 It is interesting to observe that these values are significantly lower than those of the bulk (11.43 W m−1 K−1)12c and that there is around a 50% reduction in thermal conductivity at room temperature for the uniaxial hot pressed sample in comparison to the bulk thin film of HfO2.12b,c Furthermore, the thermal conductivity of the hot pressed sample is much lower compared to SPS sample. This could be related to the smaller grain size of the hot pressed sample, but also to the presence of thermal insulating surfactants between grains, which provide additional phonon dispersion.
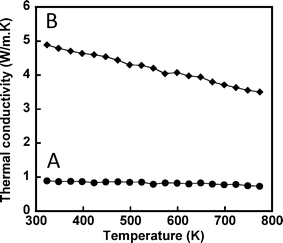 | ||
| Fig. 9 Temperature dependence of the thermal conductivity of HfO2 nanoparticles pellets obtained by (A) uniaxial hot pressing and (B) spark plasma sintering. | ||
Discussion
A fine white powder of HfO2 nanoparticles was obtained from base-catalyzed hydrolysis and condensation of hafnium(IV) tert-butoxide in the presence of a surfactant at room temperature. The outline of the reaction route leading to the formation of hafnia nanoparticles is presented in Scheme 1. The synthetic technique reported here is relatively simple, inexpensive and potentially useful for large-scale production of nanoparticles.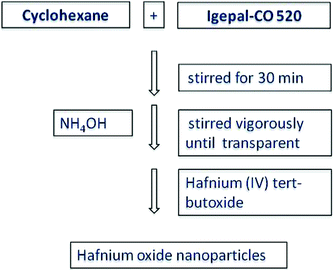 | ||
| Scheme 1 Schematic showing synthesis route for HfO2 nanoparticles. | ||
Although it is difficult to identify grain boundaries due to the amorphous nature of the nanoparticles, the particle size is estimated to be around 4 nm. Analysis of the TEM images showed that the as-synthesized nanoparticles are monodispersed with a narrow size distribution (Fig. 1A). The shape of the nanoparticles was not entirely spherical but somewhat faceted. For high temperature applications of nanoparticles, it is desirable that nanoparticles should retain their shape and not grow in size during heat treatment. TEM analysis of annealed samples showed that the HfO2 nanoparticles retained their shape and there is no significant increase in particle size. However, nanoparticles did tend to aggregate due to decomposition of surfactant from the surface of the nanoparticles (Fig. 1B). It was found that XRD peaks were very broad even after high temperature annealing, further suggesting that the size of nanoparticles indeed did not grow significantly during heat treatment. In fact, on annealing at 700 °C nanoparticle size increased to 9 nm (Fig. 2F). This shows that HfO2 nanoparticles have high thermal stability, an important characteristic for high temperature applications. We also observed that HfO2 nanoparticles cannot crystallize under argon below 500 °C even after annealing for longer time. It is interesting that HfO2 nanoparticles can be well crystallized at as low as 300 °C when annealed in oxygen atmosphere for 4 h. In comparison, HfO2 nanoparticles annealed at 500 °C under a reductive atmosphere did not crystallize. This suggests that oxygen and oxygen defects likely play a key role in decreasing the crystallization temperature of the HfO2 nanoparticles.
Neither molar ratios of surfactant to Hf-precursor nor reaction times have any major influence on nanoparticle sizes. This could be due to the competition between nucleation and growth processes in nanoparticle formation. Since hydrolysis is a fast process, nucleation dominates over the growth and prevents particles from growing bigger. As-synthesized nanoparticles have a large BET surface area of 239 m2 g−1 indicating very small nanoparticles. Upon annealing at increasing temperatures there was only a minor decrease in BET surface area suggesting no considerable increase in nanoparticle size. This result is consistent with both TEM and XRD.
The thermal conductivity of the SPS sample is higher in comparison to the hot pressed sample. This is likely due to the fact that the SPS sample was compacted at a higher temperature such that grains grew to 50–60 nm; in contrast, the hot pressed sample had smaller grain growth to 10–12 nm. Due to smaller grain size, the hot pressed sample has a higher density of grain boundaries. It is known23 that the mean free path of the phonons may be reduced due to 1) scattering at grain boundaries, 2) phonon–phonon scattering, and 3) lattice imperfections arising from nanoparticles formation processes. While lattice imperfections in smaller particles may have some influence on thermal conductivity, it is expected that phonon scattering at grain boundaries may be more dominant in reducing thermal conductivities. This implies that the grain size in the specimen plays a key role for effective phonon scattering. It can also be seen that the thermal conductivities of both samples decrease as the temperature increases. This further shows that the phonon mean free path is significantly decreased with increasing annealing temperature.
Conclusions
Hydrolysis and condensation of hafnium(IV) tert-butoxide in the presence of surfactants at room temperature has resulted in the formation of HfO2 nanoparticles. The amorphous nanoparticles can be crystallized upon moderate heat treatment. The crystallization temperature of the nanoparticles can be controlled by controlling the annealing atmosphere. Further, the nanoparticles possess high surface area and high thermal stability, though they did not grow significantly in size during heat treatment. The thermal conductivity of HfO2 pellets having smaller grains is lower than that of samples with larger grains, indicating significant phonon scattering at grain boundaries. Further, the thermal conductivity of HfO2 nanoparticles with grain size 10–12 nm is lower than bulk thin film by approximately 50%. This is thought to be the result from the decrease in mean free path of phonons due to the high density of grain boundaries. These thermally stable, low thermal conductive HfO2 nanoparticles should be effective in both low and high temperature technological applications as well as for building blocks in nanodevices. More specifically, owing to its high thermal and chemical stability, and low thermal conductivity, such HfO2 nanoparticles are well suited to be used as nanoinclusions in high temperature thermoelectric materials.Acknowledgements
This work was supported by DARPA through Thermoelectrics program Grant No. HR0011-08-1-0084. The authors thank Dr James Salvador from General Motors R&D Center for assistance in sample consolidation using spark plasma sintering.References
- (a) S. A. Majetich and Y. Jin, Science, 1999, 284, 470–473 CrossRef CAS; (b) G. S. Chaubey, C. Barcena, N. Poudyal, C. Rong, J. Gao, S. Sun and J. P. Liu, J. Am. Chem. Soc., 2007, 129, 7214–7215 CrossRef CAS; (c) A. P. Alivisatos, Science, 1996, 271, 933–937 CAS; (d) P. Warrier and A. Teja, Nanoscale Res. Lett., 2011, 6, 247–252 CrossRef.
- (a) T. Hyeon, Chem. Commun., 2003, 927–934 RSC; (b) V. Nandwana, K. E. Elkins, N. Poudyal, G. S. Chaubey, K. Yano and J. P. Liu, J. Phys. Chem. C, 2007, 111, 4185–4189 CrossRef CAS; (c) C.-C. Chen, A. B. Herhold, C. S. Johnson and A. P. Alivisatos, Science, 1997, 276, 398–401 CrossRef CAS.
- G. D. Wilk, R. M. Wallace and J. M. Anthony, J. Appl. Phys., 2001, 89, 5243–5275 CrossRef CAS.
- M. Rinkio, A. Johansson, G. S. Paraoanu and P. Torma, Nano Lett., 2009, 9, 643–647 CrossRef CAS.
- (a) R. Chow, S. Falabella, G. E. Loomis, F. Rainer, C. J. Stolz and M. R. Kozlowski, Appl. Opt., 1993, 32, 5567–5574 CrossRef CAS; (b) A. J. Waldorf, J. A. Dobrowolski, B. T. Sullivan and L. M. Plante, Appl. Opt., 1993, 32, 5583–5593 CrossRef CAS.
- (a) X. Yang, F. C. Jentoft, R. E. Jentoft, F. Girgsdies and T. Ressler, Catal. Lett., 2002, 81, 25–31 CrossRef CAS; (b) S. De. Rossi, G. Ferraris, M. Valigi and D. Gazzoli, Appl. Catal., A, 2002, 231, 173–184 CrossRef CAS.
- (a) M. F. Al-Kuhaili, S. M. A. Durrani and E. E. Khawaja, J. Phys. D: Appl. Phys., 2004, 37, 1254–1261 CrossRef CAS; (b) H. Grüger, C. Kunath, E. Kurth, S. Sorge and W. Pufe, Mater. Res. Soc. Symp. Proc., 2005, 869, D2.1.1 Search PubMed.
- (a) V. D. Noto, R. Gliubizzi, E. Negro, M. Vittadello and G. Pace, Electrochim. Acta, 2007, 53, 1618–1627 CrossRef; (b) M. Vittadello, E. Negro, S. Lavina, G. Pace, A. Safari and V. D. Noto, J. Phys. Chem. B, 2008, 112, 16590–16600 CrossRef CAS; (c) V. D. Noto, S. Lavina, E. Negro, M. Vittadello, F. Conti, M. Piga and G. Pace, J. Power Sources, 2009, 187, 57–66 CrossRef; (d) V. D. Noto, N. Boaretto, E. Negro, G. A. Giffin, S. Lavina and S. Polozzi, Int. J. Hydrogen Energy, 2012, 37, 6199–6214 CrossRef.
- (a) X. Y. Huang, Z. Xu and L. D. Chen, Solid State Commun., 2004, 130, 181–185 CrossRef CAS; (b) X. Y. Huang, Z. Xua and L. D. Chen, Key Eng. Mater., 2003, 249, 79–82 CrossRef CAS.
- (a) C. Wang, M. Zinkevichw and F. Aldinger, J. Am. Ceram. Soc., 2006, 89, 3751–3758 CrossRef CAS; (b) J. Wang, H. P. Li and R. Stevens, J. Mater. Sci., 1992, 27, 5397–5430 CAS; (c) C. H. Lu, J. M. Raitano, S. Khalid, L. Zhang and S. W. Chan, J. Appl. Phys., 2008, 103, 124303–7 CrossRef; (d) F. Cardarelli, Materials Handbook: A Concise Desktop Reference, 2nd edn (Springer-Verlag, New York, 2008) Search PubMed.
- (a) R. C. Garvie, J. Phys. Chem., 1965, 69, 1238–1243 CrossRef CAS; (b) R. C. Garvie, J. Phys. Chem., 1978, 82, 218–223 CrossRef CAS.
- (a) M. A. Panzer, M. Shandalov, J. A. Rowlette, Y. Oshima, Y. W. Chen, P. C. McIntyre and K. E. Goodson, IEEE Electron Device Lett., 2009, 30, 1269–1271 CrossRef CAS; (b) S. M. Lee, D. G. Cahill and T. H. Allen, Phys. Rev. B: Condens. Matter, 1995, 52, 253–257 CrossRef CAS; (c) CRC Materials Science and Engineering Handbook, Thermal Properties of Materials, 3rd edn, J. F. Shackelford and W. Alexander ed., CRC Press: Boca Raton, 2001 Search PubMed.
- N. Pinna, G. Garnweitner, M. Antonietti and M. Niederberger, Adv. Mater., 2004, 16, 2196–2200 CrossRef CAS.
- A. Pucci, G. Clavel, M-G. Willinger, D. Zitoun and N. Pinna, J. Phys. Chem. C, 2009, 113, 12048–12058 CAS.
- G. Stefanic, S. Music and K. Molcanov, J. Alloys Compd., 2005, 387, 300–307 CrossRef CAS.
- P. E. Meskin, F. Y. Sharikov, V. K. Ivanov, B. R. Churagulov and Y. D. Tretyakov, Mater. Chem. Phys., 2007, 104, 439–443 CrossRef CAS.
- S. A. Elizia Rio, A. L. S. Cavalcante, A. J. C. Sczancoski, A. P. S. Pizani, A. J. A. Varela, A. J. W. M. Espinosa and A. E. Longo, Nanoscale Res. Lett., 2009, 4, 1371–1379 CrossRef CAS.
- J. Tang, J. Fabbri, R. D. Robinson, Y. Zhu, I. P. Herman, M. L. Steigerwald and L. E. Brus, Chem. Mater., 2004, 16, 1336–1342 CrossRef CAS.
- E. Tirosh and G. Markovich, Adv. Mater., 2007, 19, 2608–2612 CrossRef CAS.
- G. S. Chaubey, Y. Yao, J. Makongo, P. Sahoo, P. F. Poudeu and J. B. Wiley, MRS Online Proc. Libr., 2010, 1256, 1256-N16–35 Search PubMed.
- M. Beekman, S. Stefanoski, W. Wong-Ng, J. A. Kaduk, Q. Huang, C. Reeg, C. R. Bowers and G. S. Nolas, J. Solid State Chem., 2010, 183, 1272–1277 CrossRef CAS and references therein.
- S. Yamanaka, T. Maekawa, H. Muta, T. Matsuda, S.-I. Kobayashi and K. Kurosaki, J. Alloys Compd., 2004, 381, 295–300 CrossRef CAS.
- S. G. Volz and G. Chen, Appl. Phys. Lett., 1999, 75, 2056–2058 CrossRef CAS.
| This journal is © The Royal Society of Chemistry 2012 |
