Selective sensing and efficient separation of Hg2+ from aqueous medium with a pyrene based amphiphilic ligand†
Chirantan
Kar
a,
Manab
Deb Adhikari
b,
Aiyagari
Ramesh
*b and
Gopal
Das
*a
aDepartment of Chemistry, Indian Institute of Technology, Guwahati, Assam, 781 039, India. E-mail: gdas@iitg.ernet.in; Fax: +91-361-258-2349; Tel: +91-361-258-2313
bDepartment of Biotechnology, Indian Institute of Technology, Guwahati, Assam, 781 039, India. E-mail: aramesh@iitg.ernet.in; Fax: +91-361-258-2249; Tel: +91-361-258-2205
First published on 6th August 2012
Abstract
We have synthesized a new fluorogenic compound L, which can selectively bind and sense Hg2+ in aqueous medium over a broad pH range. It exhibits excellent selectivity for Hg2+ over a large number of competitive cations (Fe3+, Fe2+, Co2+, Ni2+, Cu2+, Zn2+, Ag+, Cd2+, Pb2+, Ca2+, Mg2+, Na+, K+). The sensing ability of the ligand is studied by fluorescence and UV-vis spectroscopy. Hg2+ present even in a nanomolar range can be detected. The effectiveness of L for detecting Hg2+ inside live human cancer cells (HeLa) is also examined. The hydrophobic part of L is efficiently employed for the quantitative extraction of Hg2+ from an aqueous medium into the organic layer. The extraction ability of L is also estimated by NMR, fluorescence and atomic absorption spectroscopy showing that approximately 99% of the Hg2+ ions are extracted. These results imply that the compound has potential application for sensing and removal of Hg2+ ions from waste water in a large cross-section of mercury threatened zones around the world.
1. Introduction
Mercury is one of the most hazardous and ubiquitous pollutants and its contamination is widespread and arises from a variety of natural and anthropogenic sources.1,2 Once mercury is introduced into the food chains, the environmental cycle causes serious threat to human health and ecology.3–5 Low levels of mercury can be concentrated to dangerous levels through the natural process of bioaccumulation. Various techniques are currently being used to remove ppm levels of mercury from the environment. They include bioremediation, activated carbon adsorption, ion exchange resins, chemical precipitating agents, polymeric chelating fibers, and the use of crown thioethers.6 In view of that, development of new synthetic ligands for analytical detecting and removal of Hg2+ is highly desirable.7–12 Among the various techniques that allow detection of Hg2+ ions, particularly in low concentrations, optical methods such as those based on fluorescence are becoming increasingly popular.13–26 In this regard Pyrene based fluorescence receptors are getting much more attention.27–31 The fluorescence turning ON/OFF is based on specific mechanisms of interaction between the ligand and metal ions. For this purpose, the ligand design is of paramount importance. Since, not only the ligand should have well-defined coordinating units that allow interaction with metal ions, but it should also be endowed with specific groups, whose optical properties can be triggered by such an interaction.32–34 Our aim is to apply the principle of metal coordination induce switching of ligand conformation followed by spectral changes. In view of the environmental impact of Hg(II),35–37 we focused our interest to design a ligand which could be applied for detecting and extracting this metal ion from aqueous solution.Knowing the complexity towards designing such molecules, we have designed and synthesized an N-bridged ligand L (Scheme 1) keeping the following in mind: (1) It possess a suitable metal coordination site; (2) it has sufficient conformational flexibility which would allow feasible intermolecular interactions among the ligand units, if favorable prior to metal coordination; (3) metal coordination should in principle rigidify the ligand framework to an extent that, it could disrupt the previously existing intermolecular interactions; (4) it contains a strong fluorophore for sensitive optical detection and (5) the hydrophobic part of the ligand allows efficient extraction of metal into the non-polar phase from an aqueous medium. In our continuous effort to design sensors for various analytes,38–42 here, we discuss the design and synthesis of the ligand L and its mercury sensing and separation studies from aqueous medium. We have also reported its cellular uptake studies. As an optical probe, we have chosen the pyrene fluorophore due to its many advantageous features as fluorescent sensors including strong fluorescence as well as its distinct monomer and excimer emissions.43–45 To further introduce L as an efficient extractor of Hg2+ from aqueous medium we have incorporated a long hydrophobic chain which enables effective removal of Hg2+ ions from aqueous medium to non-aqueous medium. The ligand is superior to other available mercury sensors due to its additional capability in effective removal of Hg2+ ions from water.
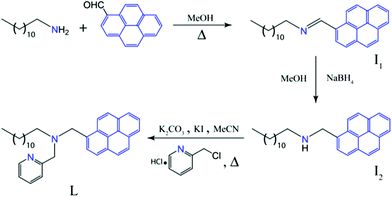 | ||
| Scheme 1 Synthetic scheme of the ligand L. | ||
2. Experimental
2.1. Material and methods
1-Pyrenealdehyde, 1-chloromethyl (pyridine hydrochloride) and dodecylamine were obtained from Sigma-Aldrich USA. Other chemicals were of reagent grade and used without further purification. The absorption spectra were recorded on a Perkin-Elmer Lamda-35 UV-visible spectrophotometer using 10 mm path length quartz cuvettes in the range of 200–400 nm wavelengths, while the fluorescence measurements were carried out on a Horiba Fluoromax-4 spectrofluorimeter using 10 mm path length quartz cuvettes with a slit width of 2 nm at 298 K by exciting at 340 nm wavelength. NMR spectra were recorded on a Varian FT-400 MHz instrument.2.2. Synthesis of ligand L
Synthetic pathway of fluorogenic molecule L is summarized in Scheme 1. 100 mg of 1-pyrenealdehyde is refluxed with 88 mg (1.1 eqv.) of dodecylamine in methanol to afford the desired Schiff base N-((pyren-6-yl)methylene dodecan-1-amine in 70% yield. The Schiff base is reduced by gradual addition of NaBH4 in its methanolic solution to obtain N-((pyren-6-yl)methyl) dodecan-1-amine. The ligand L is directly synthesized from N-((pyren-6-yl)methyl) dodecan-1-amine by refluxing it with 1-chloromethyl (pyridine hydrochloride) in the presence of K2CO3 in CH3CN for 48 h. Crude product was purified by column chromatography with 55% yield. 1H NMR (CDCl3, 400 MHz) δ (ppm) 0.874 (t, 3H, J = 0.017); 1.299 (m, 18H); 1.621 (q, 2H, J = 0.017); 2.584 (t, 2H, J = 0.017); 3.750 (s, 2H); 4.200 (s, 2H); 7.046 (t, 1H, J = 0.014); 7.422 (t, 1H, J = 0.02); 7.517 (t, 1H, J = 0.02); 7.942–8.169 (m, 7H); 8.452 (t, 1H, J = 0.027); 8.508 (d, 1H, J = 0.012). 13C NMR (CDCl3, 100 MHz) δ (ppm) 148.72, 136.49, 139.51, 131.08, 130.89, 130.03, 128.46, 127.64, 127.23, 126.01, 125.14, 124.64, 124.33, 123.39, 121.98, 96.01, 60.59, 57.68, 54.94, 32.11, 29.82, 29.61, 27.57, 27.06, 22.88, 14.32. m/z calcd. for [L + H]+ is 491.3300 found 491.3300 (mass spectrum obtained in positive mode).2.3. Measurement of extraction efficiency of L by fluorescence experiment
A known concentration of Hg(NO3)2 dissolved in MeOH was treated with a CHCl3 (15 mL) solution of L to record the electronic spectra, then an identical concentration of the aqueous solution of Hg(NO3)2 was extracted (three times) with the CHCl3 solution of L. All non-aqueous layers were collected together, final volume was adjusted to 15 mL and after that the emission spectra of the non-aqueous layer was recorded. Emission at 377 nm was compared with the previous one to get the extraction efficiency, which was found to be above 99% in all the five different concentration of Hg2+ tried.2.4. Finding the detection limit of L
The detection limit was calculated based on the fluorescence titration. The fluorescence emission spectrum of L was measured ten times and the standard deviation of blank measurement was achieved. To gain the slope, the ratio of the fluorescence intensity at 516 nm was plotted as a concentration of Hg2+.So the detection limit was calculated with the following equation:
Detection limit = 3σ/k; where σ is the standard deviation of blank measurement, k is the slope between the fluorescence intensity versus [Hg2+].
2.5. Comparative study with Na2S
The initial and residual metal ion concentrations after extraction were measured by AA240 atomic absorption spectrometer (Varian Inc.) in each case.Separate 0.5 M aqueous solutions of Na2S were prepared and diluted to the necessary amount. The diluted solution was applied to the separate triplicate stock Hg solutions (prepared with Hg(NO3)2) for the reagent tested. At time intervals of 1, 3 and 6 h, 10 mL samples were collected, filtered with 0.2 mm Nalgene syringe filters, and analyzed using AAS.
2.6. Biological studies
HeLa cells were procured from the National Center for Cell Sciences (NCCS), Pune, India. The cells were propagated in Dulbecco's Modified Eagle Medium (DMEM) supplemented with 10% (v/v) fetal bovine serum, penicillin (100 μg mL−1), and streptomycin (100 μg mL−1). Cells were maintained under a humidified atmosphere of 5% CO2 and at 37 °C in an incubator. For cell imaging studies, cells were seeded into a 6 well plate and incubated at 37 °C in a CO2 incubator for 3 days. After 3 days cells were washed three times with phosphate buffered saline (pH 7.4) and incubated with 5 μM L in DMEM at 37 °C for 1 h in a CO2 incubator and observed under epifluorescence microscopy (Nikon eclipse Ti). The cells were again washed thrice with PBS (pH 7.4) to remove the free L, and then incubated in phosphate buffered saline with 20 μM HgCl2 for 1 h and again images were taken using an epifluorescence microscope.3. Results and discussion
3.1. Fluorescence studies
Upon excitation at 340 nm, L shows two closely spaced emission bands at around 376 and 394 nm along with a broad structureless band at 516 nm. While the former is due to a monomer emission, the latter can be assigned to an excimer emission, resulting presumably from an intermolecular π–π interaction between the pyrene arms of two ligand molecules. Intra- and intermolecular excimer formation as a result of π–π interactions in pyrene-based compounds are well documented.46,47In the present example, the excimer emission is due to intermolecular π–π interaction of the pyrene units of L. Interaction of L with various metal ions (Fe3+, Fe2+, Co2+, Ni2+, Cu2+, Zn2+, Ag+, Cd2+, Pb2+, Ca2+, Mg2+, Na+, K+ and Hg2+ taken as their corresponding nitrate salt) revealed that only Hg2+ induces significant change in fluorescence with a sharp decrease of the excimer emission at 516 nm along with a related enhancement of the monomer emission bands (Fig. 1). The change in excimer intensity is consistent even if Hg2+ is added to the aqueous solution of L in the presence of other tested metal ions (Fig. 2). Although the metal dependent experiments are performed in the presence of nitrate salts of the corresponding metal ions, the interference study including other anions was also performed and it is observed that the sensitivity of L is not affected by intrusion of anions which are usually present in natural or waste water samples (see ESI†). The pH-controlled emission measurements revealed that L could respond to Hg2+ in the pH range from 4.0 to 11.0 with identical fluorescent intensity changes. This result suggested that no buffer solutions were required for the detection of Hg2+, which is convenient for practical application (see ESI†).
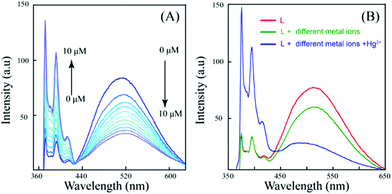 | ||
Fig. 1 (A) Emission spectra of L in water/DMSO (9.5![[thin space (1/6-em)]](https://www.rsc.org/images/entities/char_2009.gif) : :![[thin space (1/6-em)]](https://www.rsc.org/images/entities/char_2009.gif) 0.5, v/v) (10 μM) on gradual addition of Hg2+ (0 to 10 μM as nitrate salt). (B) Emission spectra of L in water/DMSO (9.5 0.5, v/v) (10 μM) on gradual addition of Hg2+ (0 to 10 μM as nitrate salt). (B) Emission spectra of L in water/DMSO (9.5![[thin space (1/6-em)]](https://www.rsc.org/images/entities/char_2009.gif) : :![[thin space (1/6-em)]](https://www.rsc.org/images/entities/char_2009.gif) 0.5, v/v) (10 μM) in the presence of the Hg2+ ions and miscellaneous cations (25 μM each) including Fe3+, Fe2+, Co2+, Ni2+, Cu2+, Zn2+, Ag+, Cd2+, Pb2+, Ca2+, Mg2+, Na+, K+ and Hg2+ respectively. 0.5, v/v) (10 μM) in the presence of the Hg2+ ions and miscellaneous cations (25 μM each) including Fe3+, Fe2+, Co2+, Ni2+, Cu2+, Zn2+, Ag+, Cd2+, Pb2+, Ca2+, Mg2+, Na+, K+ and Hg2+ respectively. | ||
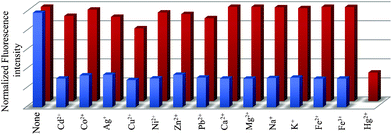 | ||
| Fig. 2 Normalized fluorescence responses of L (25 μM) to various cations in water. The red bars represent the emission intensities of L in the presence of cations of interest (25 μM). The blue bars represent the change of the emission that occurs upon the subsequent addition of (25 μM) of Hg2+ to the above solution. The intensities were recorded at 516 nm, excitation at 340 nm. | ||
Depending upon the origin of the pyrene dimer, there are two kinds of excimers: a dynamic excimer and a static excimer. The former results from a pyrene dimer formed in the excited state, whereas the latter arises from a pyrene dimer in the ground state. Formation of a dynamic or static excimer depends on the distance between the two pyrene units.48,49 A useful method to differentiate a dynamic excimer from a static one is the excitation spectrum.47 The excitation spectra of L monitored at 516 nm are red-shifted (Δλ ≈ 10 nm) in comparison to that recorded at 376 nm. This suggests that the chemical species corresponding to the emissions observed at 376 and 516 nm emissions are different, which in turn indicates that L shows the presence of a static excimer in solution. For better understanding of the change in fluorescence intensity and the complexation ratio we have further titrated L with increasing amount of Hg2+. Based on this data we determined the Stern–Volmer constant (KSV) of this quenching process to be 6.86 × 10⁴ (l mol−1) and the 1![[thin space (1/6-em)]](https://www.rsc.org/images/entities/char_2009.gif) :
:![[thin space (1/6-em)]](https://www.rsc.org/images/entities/char_2009.gif) 1 complexation is confirmed by Job's plot for Hg2+ (see ESI†). The presence of a 1
1 complexation is confirmed by Job's plot for Hg2+ (see ESI†). The presence of a 1![[thin space (1/6-em)]](https://www.rsc.org/images/entities/char_2009.gif) :
:![[thin space (1/6-em)]](https://www.rsc.org/images/entities/char_2009.gif) 1 complex is also supported by the mass spectral analysis which gives a peak at 728.33 corresponding to the total mass of one Hg atom linked to one L molecule and two water molecules (see ESI†). The detection limit of L for Hg2+ is found to be 8 × 10⁻⁹ M and the binding constant measured from fluorescence titration is found to be 1.12 × 10⁵ M−1 (see ESI†).
1 complex is also supported by the mass spectral analysis which gives a peak at 728.33 corresponding to the total mass of one Hg atom linked to one L molecule and two water molecules (see ESI†). The detection limit of L for Hg2+ is found to be 8 × 10⁻⁹ M and the binding constant measured from fluorescence titration is found to be 1.12 × 10⁵ M−1 (see ESI†).
3.2. UV/Vis absorption studies
Absorption spectrum of the compound (10−5 M) is recorded in water/DMSO (9.5![[thin space (1/6-em)]](https://www.rsc.org/images/entities/char_2009.gif) :
:![[thin space (1/6-em)]](https://www.rsc.org/images/entities/char_2009.gif) 0.5, v/v); this spectrum (see ESI†) is typical of a polyaromatic compound, the absorptions arise mainly due to π–π* transitions of the signaling subunit.48,49 Complexation of L with Hg2+ leads to a slight red-shift of the bands. This is may be due to the change in the orientation of the polyaromatic fluorophoric unit. The change in the absorption spectra is unique for Hg2+ ions and is negligible in presence of other metal ions.
0.5, v/v); this spectrum (see ESI†) is typical of a polyaromatic compound, the absorptions arise mainly due to π–π* transitions of the signaling subunit.48,49 Complexation of L with Hg2+ leads to a slight red-shift of the bands. This is may be due to the change in the orientation of the polyaromatic fluorophoric unit. The change in the absorption spectra is unique for Hg2+ ions and is negligible in presence of other metal ions.
From the above discussions it can be concluded that in the aqueous solution the pyrene moiety of two different molecules interact with one another to form the excimer band whereas binding with Hg2+ disrupts the previously present intermolecular interaction to form a more rigid structure and consequently the excimer peak diminishes (Scheme 2).
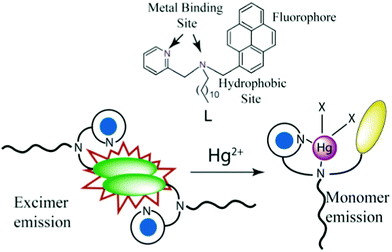 | ||
| Scheme 2 Probable mechanism of Hg2+ sensing by L: Intermolecular interactions between the pyrene moieties of L get disrupted due to the formation of a conformationally rigid mercury bind structure. | ||
3.3. Cell imaging
Heavy metal ion induced quenching and their bioimaging is scarcely reported in the literature50,51 because they often act as a quencher via energy- or electron-transfer processes, which limits their application in bioimaging.52 In our present work the quenching of the excimer peak with simultaneous increase of the monomeric peak of pyrene is not due to the heavy ion effect caused by the presence of Hg2+ rather it is due to the breakage of the existing intermolecular aggregates of ligand L upon complexation with Hg2+. Due to its favorable binding properties with mercury and its intense emission in the visible region, compound L is very much suitable for fluorescence imaging of living cells. We assessed the effectiveness of L as a probe of Hg2+ by fluorescence microscopy on HeLa cells treated with 5 μM L solution for 1 h at 37 °C, and then with 20 μM Hg(NO3)2 solution for 1 h at 37 °C. As shown in Fig. 3, a perceptible fluorescence emission (under blue light) is observed in the inner cellular region of the HeLa cells in presence of L, suggesting a distribution of the compound in the cytoplasm. But, when the cells were treated with 20 μM Hg(NO3)2, only a very negligible amount of intracellular fluorescence was detected (Fig. 3C). We have also examined the monomer emission inside the cells and found an excellent switch ON behavior in presence of Hg2+ ions when excited under UV light. From the above results it is confirmed that L is permeable in cells and the striking switch OFF/switch ON of the inner cellular fluorescence confirmed the binding of L with Hg2+ within HeLa cells.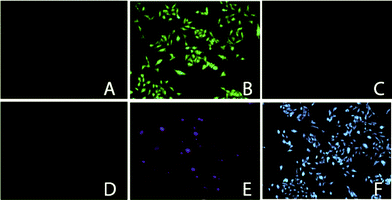 | ||
| Fig. 3 Fluorescence microscopy images of HeLa cells: (A) before treating with L, (under blue light), (B) 5 μM of L, (under blue light), (C) 20 μM Hg2+ and 5 μM L, (under blue light), (D) before treating with L, (under UV light), (E) 5 μM of L, (under UV light), (F) 20 μM Hg2+ and 5 μM L, (under UV light). | ||
3.4. Extraction of Hg2+ from aqueous medium
It is now widely recognized that chronic exposure to all forms of mercury can harm the central nervous system and the renal system.53,54 This has led to regulatory actions to reduce the exposure of humans to mercury on many fronts. According to the Agency for Toxic Substances and Disease Registry (ATSDR), it is necessary to alleviate this metal from aquatic systems.55 Thus, we explored the possibility of using L as a reagent for real-time quantitative extraction and detection of Hg2+ from an aqueous solution of Hg(NO3)2. We measured the extraction efficiency of L using 1H NMR, fluorescence emission spectroscopy and atomic absorption spectroscopy.3.4.1. Study of extraction efficiency by 1H NMR spectroscopy
As L has selectivity for Hg2+ ions, we studied the extraction behavior of this ligand by 1H NMR spectroscopy. A solution containing Hg(NO3)2 in D2O (0.5 mL) was layered onto a solution of L in CDCl3 (0.5 mL) in an NMR tube. The two layers were thoroughly mixed for 1 min and allowed to settle for 10 s, then the two layers are separated and the organic phase was immediately analyzed, the process is repeated for different concentration of Hg(NO3)2 (from 0 to 1 equivalent) (Fig. 4). The resulting aqueous layer is checked by UV/vis spectroscopy to contain only a trace of L. A comparison experiment (in organic solution only) is also conducted by directly adding 1 eqv. of Hg2+ ions (as a CD3OD solution of Hg(NO3)2 salts) to the CDCl3 solution of L. In both the experiments significant shifts of the methylene protons near the probable mercury binding sites is observed. The methylene proton signal at 4.198 ppm moved to 4.519 ppm when the extraction is done in the presence of 1 equivalent of Hg2+. No further change is observed with the addition of more Hg2+ ions, which is consistent with a 1![[thin space (1/6-em)]](https://www.rsc.org/images/entities/char_2009.gif) :
:![[thin space (1/6-em)]](https://www.rsc.org/images/entities/char_2009.gif) 1 binding mode. The final spectra of the extraction experiment obtained after extraction of one equivalent of Hg2+ agreed well with that induced by the same amount of Hg2+ ions in the comparison experiment, thus indicating that nearly all the Hg2+ ions (one equivalent) in the aqueous layer were extracted into the CDCl3 phase (see ESI†). The composition of the extracted chloroform layer was checked by mass spectroscopy, a peak at 732.35 (L-Hg-2D2O) justifies the extraction of the ligand bonded metal complex to the non-polar phase (see ESI†).
1 binding mode. The final spectra of the extraction experiment obtained after extraction of one equivalent of Hg2+ agreed well with that induced by the same amount of Hg2+ ions in the comparison experiment, thus indicating that nearly all the Hg2+ ions (one equivalent) in the aqueous layer were extracted into the CDCl3 phase (see ESI†). The composition of the extracted chloroform layer was checked by mass spectroscopy, a peak at 732.35 (L-Hg-2D2O) justifies the extraction of the ligand bonded metal complex to the non-polar phase (see ESI†).
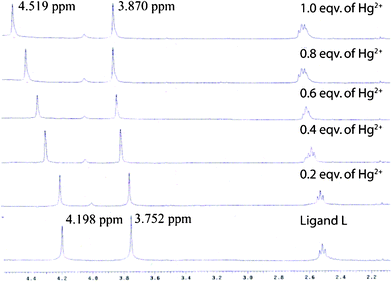 | ||
| Fig. 4 1H NMR spectra (in CDCl3, 20 mM) of L after extraction of various amounts of Hg2+ ions from D2O solution. The two marked peaks correspond to the two methylene groups near the aromatic systems. | ||
3.4.2. Study of extraction efficiency by fluorescence spectroscopy
When the emission of L is studied in a CHCl3 solution, we followed the change in intensity of the more predominant monomeric peak. It is worth mentioning that the monomeric peak too seems to fade away with increasing concentration of Hg2+ ions (in CHCl3). So we used the emission intensity of the monomeric peak in CHCl3 as a tool to study the Hg2+ extraction ability of L by fluorescence spectroscopy. Similar to the 1H NMR experiment we layered the aqueous solutions (with varying concentration from 0 to 1 equivalents) of Hg(NO3)2 over the ligand solution (24 μM) in chloroform. The two layers are thoroughly mixed for 1 min and allowed to settle for 10 s then the two layers are separated and the fluorescence emission of the organic phase is immediately measured. A parallel experiment also performed by directly adding aliquots of Hg2+ ions (as CH3OH solution of Hg(NO3)2 salts) to the CHCl3 solution of L. The emission intensity of the monomer peak of L near 377 nm seems to decrease with the increase in Hg2+ concentrations.By comparing the fluorescence spectra of the extraction experiment with thaose comparison experiments, we can conclude that Hg2+, as low as 6.0 μM could be extracted into the organic layer (CHCl3) from a neutral aqueous solution of Hg(NO3)2 with over 99.0% extraction efficiency (Fig. 5). The extraction procedure can also be monitored by the naked eye using a handheld UV lamp (365 nm) (Fig. 6).
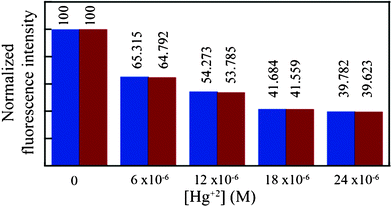 | ||
| Fig. 5 Comparison of the fluorescence emission intensity of L (at 377 nm) in the CHCl3 layer after extraction (red) and after direct addition (blue) of a methanolic solution of Hg(NO3)2 onto a separate solution of L in CHCl3. | ||
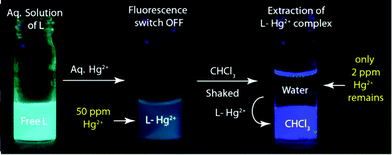 | ||
| Fig. 6 Schematic illustration showing the extraction of Hg2+ under UV lamp. An aqueous solution containing 50 ppm of Hg2+ in presence of L was layered with CHCl3 and shaken for 6 h. The resulting aqueous part contains only 2 ppm of Hg2+. | ||
3.4.3. Comparison of extraction efficiency with Na2S by AAS
To further understand the efficiency of the ligand as an Hg2+ remover, we studied it in a more quantitative manner by using atomic absorption spectroscopy. In this case we made two sets of aqueous Hg2+ solutions, Set-I and Set-II maintaining the concentration of mercury ions at 50 mg L−1 and 100 mg L−1 respectively. To make the situation more realistic we have added definite amount (5 mg L−1 and 10 mg L−1 respectively) of competitive ions (Fe+3, Cd+2, Zn+2 and Pb+2) to the sample sets. We added 20 equivalents of L to each of the sets and layered them with CHCl3. The resulting mixture was thoroughly mixed and aliquots of the aqueous phase were collected at different times (until a steady state is reached) to analyze the amount of Hg2+ in it. The result obtained by using L is compared with the commercially available mercury remover sodium sulphide nonahydrate. The results obtained from the above mentioned experiment is described in Fig. 7. The results show that Na2S removes fairly high levels of Hg in all samples, but at a much slower rate of reduction than L. From AAS data we have calculated the detectable extraction limit of Hg2+ and it is found to be 4 ppm.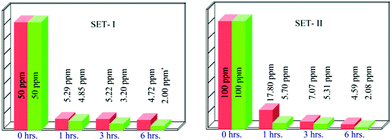 | ||
| Fig. 7 Extraction of Hg2+ by L and Na2S. Green bar indicates extraction using L and the red bar indicates extraction using Na2S (* marks represents the instrumental detection limits). | ||
4. Conclusion
In conclusion, we have demonstrated a new flourogenic ligand which can be used for selective sensing and quantitative extraction of Hg2+ from water. The ligand is superior to other available mercury removers due to its advance in visual detection of Hg2+ ions. To date, there is no such mercury remover available in the literature which can simultaneously sense mercury with a visual change of fluorescence emission and can extract it even if ultra-trace amounts are present. The effectiveness of L as a fluorescence probe inside HeLa cells provides an additional advantage for detection of hazardous metals in live cells. The formation of a moderately strong 1![[thin space (1/6-em)]](https://www.rsc.org/images/entities/char_2009.gif) :
:![[thin space (1/6-em)]](https://www.rsc.org/images/entities/char_2009.gif) 1 L–Hg complex is proved by fluorescence, NMR and mass spectroscopy. Due to the presence of the emission maxima of L in the visible region the extraction of mercury can be visually inspected. This is particularly advantageous as the ligand L is completely free from interference of the other cations and can be used in a wide pH range. The ligand is superior to other available mercury sensors due to its capability in effective removal of Hg2+ ions from water. We believe that the compound L can play a pivotal role in the development of a new generation of toxic metal ions absorbents and toxicides. Thus, this reagent has implications towards a large cross-section of mercury threatened industrial zones around the world.
1 L–Hg complex is proved by fluorescence, NMR and mass spectroscopy. Due to the presence of the emission maxima of L in the visible region the extraction of mercury can be visually inspected. This is particularly advantageous as the ligand L is completely free from interference of the other cations and can be used in a wide pH range. The ligand is superior to other available mercury sensors due to its capability in effective removal of Hg2+ ions from water. We believe that the compound L can play a pivotal role in the development of a new generation of toxic metal ions absorbents and toxicides. Thus, this reagent has implications towards a large cross-section of mercury threatened industrial zones around the world.
Acknowledgements
GD gratefully acknowledges the Department of Science and Technology (DST), New Delhi, India, for financial support. CK and MDA acknowledge IIT Guwahati for fellowship.References
- D. W. Boening, Chemosphere, 2000, 40, 1335–1340 CrossRef CAS.
- H. H. Harris, I. Pickering and G. N. George, Science, 2003, 301, 1203 CrossRef CAS.
- T. W. Clarkson, L. Magos and G. J. N. Myers, N. Engl. J. Med., 2003, 349, 1731–1737 CrossRef CAS.
- C. M. L. Carvalho, E.-H. Chew, S. I. Hashemy and J. Lu, J. Biol. Chem., 2008, 283, 11913–11923 CrossRef CAS.
- G. Guzzi and C. A. M. La Porta, Toxicology, 2008, 244, 1–12 CrossRef CAS.
- D. A. Atwood and M. K. Zaman, Struct. Bonding, 2005, 120, 163–182 CrossRef.
- X. Chen, S. W. Nam, M. J. Jou, Y. Kim, S. J. Kim, S. Park and J. Yoon, Org. Lett., 2008, 10, 5235–5238 CrossRef CAS.
- J. Huang, Y. Xu and X. Qian, J. Org. Chem., 2009, 74, 2167–2170 CrossRef CAS.
- G. J. He, Y. G. Zhao, C. He, Y. Liu and C. Y. Duan, Inorg. Chem., 2008, 47, 5169–5176 CrossRef CAS.
- X. L. Zhang, Y. Xiao and X. H. Qian, Angew. Chem., Int. Ed., 2008, 47, 8025–8029 CrossRef CAS.
- F. Song, S. Watanabe, P. E. Floreancig and K. Koide, J. Am. Chem. Soc., 2008, 130, 16460–16461 CrossRef CAS.
- X. He, Y. Wang and K. Ling, Talanta, 2007, 72, 747–754 CrossRef CAS.
- G. J. He, D. Guo, C. He, X. L. Zhang, X. W. Zhao and C. Y. Duan, Angew. Chem., Int. Ed., 2009, 48, 6132–6135 CrossRef CAS.
- Y. G. Zhao, Z. H. Lin, C. He, H. M. Wu and C. Y. Duan, Inorg. Chem., 2006, 45, 10013–10015 CrossRef CAS.
- Z. Wang, D. Q. Zhang and D. B. Zhu, Anal. Chim. Acta, 2005, 549, 10–13 CrossRef CAS.
- X. Zhu, S. Fu, W. K. Wong, J. Guo and W. Y. Wong, Angew. Chem., Int. Ed., 2006, 45, 3150–3154 CrossRef CAS.
- C. Huang, Z. Yang, K. Lee and H. Chang, Angew. Chem., Int. Ed., 2007, 46, 6824–6828 CrossRef CAS.
- K. Feng, F. Hsu, K. Bota and X. R. Bu, Microchem. J., 2005, 81, 23–27 CrossRef CAS.
- S. Yoon, E. W. Miller, Q. He, P. H. Do and C. J. Chang, Angew. Chem., Int. Ed., 2007, 46, 6658–6661 CrossRef CAS.
- E. M. Nolan and S. J. Lippard, J. Am. Chem. Soc., 2007, 129, 5910–5918 CrossRef CAS.
- C. Diez-Gil, R. Martinez, I. Ratera, T. Hirsh, A. Espinosa, A. Tarraga, P. Molina, O. S. Wolfbeisd and J. Veciana, Chem. Commun., 2011, 47, 1842–1844 RSC.
- R. Koteeswari, P. Ashokkumar, E. J. Padma Malar, V. T. Ramakrishnan and P. Ramamurthy, Chem. Commun., 2011, 47, 7695–7697 RSC.
- M. E. Jun, B. Roy and K. H. Ahn, Chem. Commun., 2011, 47, 7583–7601 RSC.
- T. Cheng, T. Wang, W. Zhu, Y. Yang, B. Zeng, Y. Xu and X. Qian, Chem. Commun., 2011, 47, 3915–3917 RSC.
- J. Lee, M. S. Han and C. A. Mirkin, Angew. Chem., Int. Ed., 2007, 46, 4093–4096 CrossRef CAS.
- S. V. Wegner, A. Okesli, P. Chen and C. He, J. Am. Chem. Soc., 2007, 129, 3474–3475 CrossRef CAS.
- X. J. Xue, F. Wang and X. G. Liu, J. Am. Chem. Soc., 2008, 130, 3244–3245 CrossRef CAS.
- S. K. Kim and J. Yoon, Chem. Commun., 2002, 770–771 RSC.
- J. B. Wang, X. F. Qian and J. N. Cui, J. Org. Chem., 2006, 71, 4308–4311 CrossRef CAS.
- B. Schazmann, N. Alhashimy and D. Diamond, J. Am. Chem. Soc., 2006, 128, 8607–8614 CrossRef CAS.
- H. J. Kim, J. Hong, A. Hong, S. Ham, J. H. Lee and J. S. Kim, Org. Lett., 2008, 10, 1963–1966 CrossRef CAS.
- S. Kaur and S. Kumar, Chem. Commun., 2002, 2840–2841 RSC.
- Z. C. Wen, R. Yang, H. He and Y. B. Jiang, Chem. Commun., 2006, 106–108 RSC.
- N. K. Singhal, A. Mitra, G. Rajsekhar, M. M. Shaikh, S. Kumar, P. Guionneau and C. P. Rao, Dalton Trans., 2009, 8432–8442 RSC.
- L. Yang, R. McRae, M. M. Henary, R. Patel, B. Lai, S. Vogt, J. Christoph and J. C. Fahrni, Proc. Natl. Acad. Sci. U. S. A., 2005, 102, 11179–11184 CrossRef CAS.
- S. M. Park, M. H. Kim, J.-I. Choe, K. T. No and S. K. Chang, J. Org. Chem., 2007, 72, 3550–3553 CrossRef CAS.
- S. H. Jung, S. P. Kwon, W. J. Lee, S. C. Hong, W. J. Kim, S. Yan, Y. J. Lee, H. J. Lee, T. Joo and J. S. Kim, J. Am. Chem. Soc., 2009, 131, 2008–2012 CrossRef.
- S. K. Dey and G. Das, Dalton Trans., 2011, 40, 12048–12051 RSC.
- S. K. Dey and G. Das, Chem. Commun., 2011, 47, 4983–4985 RSC.
- A. Pramanik and G. Das, Tetrahedron, 2009, 65, 2196–2200 CrossRef CAS.
- C. Kar, A. Basu and G. Das, Tetrahedron Lett., 2012, 53, 4754–4757 CrossRef CAS.
- A. Basu and G. Das, Dalton Trans., 2011, 40, 2837–2843 RSC.
- T. Kato, T. Yasuda, Y. Kamikawa and M. Yoshio, Chem. Commun., 2009, 729–739 Search PubMed.
- Y. Zhou, C.-Y. Zhu, X.-S. Gao, X.-Y. You and C. Yao, Org. Lett., 2010, 12, 2566–2569 CrossRef CAS.
- R. Martinez, A. Espinosa, A. Tarraga and P. Molina, Org. Lett., 2005, 7, 5869–5872 CrossRef CAS.
- Y. Shiraishi, Y. Tokitoh and T. Hirai, Org. Lett., 2006, 8, 3841–3844 CrossRef CAS.
- Y. Shiraishi, K. Ishizumi, G. Nishimura and T. J. Hirai, J. Phys. Chem. B, 2007, 111, 8812–8822 CrossRef CAS.
- K. Behera, M. D. Pandey, M. Porel and S. Pandey, J. Chem. Phys., 2007, 127, 184501–184510 CrossRef.
- J. B. Birks, Photophysics of Aromatic Molecules, Wiley-Interscience, New York, NY, 1970 Search PubMed.
- C. Y. Li, X. B. Zhang, L. Qiao, Y. Zhao, C. M. He, S. Y. Huan, L. M. Lu, L. X. Jian, G. L. Shen and R. Q. Yu, Anal. Chem., 2009, 81, 9993–10001 CrossRef CAS.
- F. Hou, L. Huang, P. Xi, J. Cheng, X. Zhao, G. Xie, Y. Shi, F. Cheng, X. Yao, D. Bai and Z. Zeng, Inorg. Chem., 2012, 51, 2454–2460 CrossRef CAS.
- Y. Yang, Q. Zhao, W. Feng and F. Li, Chem. Rev. DOI:10.1021/cr2004103.
- F. Zahir, S. J. Rizwi, S. K. Haq and R. H. Khan, Environ. Toxicol. Pharmacol., 2005, 20, 351–360 CrossRef CAS.
- P. J. Cyr, R. P. S. Suri and E. D. Helmig, Water Res., 2002, 36, 4725–4734 CrossRef CAS.
- Agency for Toxic Substances and Disease Registry (ATSDR): U.S. Department of Health and Human Services, Public Health Service. “Toxicological profile for mercury”, Atlanta, GA, 1999.
Footnote |
| † Electronic Supplementary Information (ESI) available: Supplementary data associated with this article includes NMR spectra, mass spectra and other peripheral findings. See DOI: 10.1039/c2ra21064a/ |
| This journal is © The Royal Society of Chemistry 2012 |
