Adhesion and tribological properties of hydrophobin proteins in aqueous lubrication on stainless steel surfaces†
Timo J.
Hakala
*a,
Päivi
Laaksonen
ab,
Vesa
Saikko
c,
Tiina
Ahlroos
a,
Aino
Helle
a,
Riitta
Mahlberg
a,
Hendrik
Hähl
b,
Karin
Jacobs
b,
Petri
Kuosmanen
c,
Markus B.
Linder
a and
Kenneth
Holmberg
a
aVTT Technical Research Centre of Finland, P.O. Box 1000, FI-02044, VTT, Finland. Fax: +358 20 722 7069; Tel: +358 40 770 2369E-mail: timo.j.hakala@vtt.fi
bSaarland University, Experimental Physics, Campus E2 9, 66123 Saarbruecken, Germany
cAalto University School of Engineering, P.O. Box 4300, 00076, Aalto, Finland
First published on 7th September 2012
Abstract
Macroscale tribological properties of hydrophobin layers bound on stainless steel surfaces were investigated in an aqueous environment. Emphasis was on boundary lubrication because water easily fails in hydrodynamic lubrication due to its low viscosity. We studied the affinities of two different proteins, HFBI and FpHYD5, on stainless steel and their ability to bind water at the surface by combining quartz crystal microbalance (QCM-D) and ellipsometry. Both proteins contained an adhesive hydrophobic domain, but FpHYD5 also had a very strongly hydrating carbohydrate structure attached to it. The lubrication properties of the proteins were studied with two different methods, pin-on-disc (POD) (stainless steel vs. stainless steel) and circular translation pin-on-disc (CTPOD) (UHMWPE vs. stainless steel). It was observed that both hydrophobins could adhere to the stainless steel surface and form highly hydrated layers. Both proteins reduced friction and wear of the sliding contact between two stainless steel surfaces. With UHMWPE against stainless steel, the hydrophobins prevented the polyethylene transfer to the counterface. The lowest coefficient of friction (COF) 0.13 was observed when FpHYD5 hydrophobins were employed in pure water. On the other hand, the lowest wear was observed when FpHYD5 proteins were added in a 50 mM sodium acetate buffer. Increasing the water content and loosening the hydrophobin film structure on the stainless steel surface led to a reduction in friction and wear.
Introduction
Nature has developed effective means of water based lubrication—in synovial joints, for example—that have not been outperformed by synthetic approaches. As a lubricant, water is considered challenging due to its low viscosity. However, when compared to existing solutions that include the use of oil and additives, use of water as a lubricant in certain applications e.g. in the food industry is very attractive, while development of water-based lubrication systems is easily motivated by environmental and economic drivers. Proteins such as lubricin and mucin have been identified as important building blocks of the effective and complex lubrication system of cartilage, mucosa and other biological low friction surfaces.1 Use of adhesive proteins as lubricant additives has thus gained interest among tribologists.2The main principle in water lubrication with biomolecules is to create a water-containing layer between the surfaces.3 Certain biomolecules, such as adhesive proteins, are known to be able to adhere to different surfaces and to form layers that decrease friction and wear when compared to plain surfaces.1,4,5 When adsorbed to the surface, water molecules that hydrate proteins will be brought close to the target surface, thus enhancing formation of a stable and thin water film between the contacting surfaces.6 Adsorption of the proteins on the surface is essential, and is often driven by the surface energies.7 Typically, adsorption of proteins reduces surface energy, which in practice makes the surface more hydrophilic, meaning that water can easily form a lubricating film on the surface.
Since lubrication is a dynamic event, the dynamics and affinity of the adhesive molecules are very important. In order to prevent the direct contact of the surfaces and provide low friction and reduced wear, the molecules need to adhere strongly enough to the surface, and adsorb to the surface quickly to replace those that are sheared away during sliding contact.1 It has been observed that a polymer structure combining a surface-attaching moiety with a water-binding moiety improves surface wettability and lubrication.8 In general terms, adhesion of the biomolecules to surfaces is based on hydrophobic interactions, electrostatic interaction and van der Waals forces between molecules and the surface. Adsorption and adhesion properties are in addition related to the conformation of the protein that can be affected by thermal and mechanical processes during tribological contact, as well as to changes in pH, ionic strength and temperature of the environment.9–12 Furthermore, the environment may also affect the water content and swelling of the adsorbed layer and, thus, the lubrication.11,13
Fungal adhesion proteins, belonging to a class of proteins called hydrophobins, have strong interactions with certain surfaces, typically hydrophobic surfaces such as graphite and Si. Hydrophobins are small proteins (∼3 nm in height) that have a strongly cross-linked fold containing four disulfide bridges, making them very stable against conformational changes. The most striking feature of these proteins is a patch of hydrophobic residues on one of the faces, leading to a structure resembling a surfactant with a hydrophilic and a hydrophobic part. In solution, hydrophobic interactions between individual proteins drive the formation of supramolecular dimers or tetramers. In the vicinity of interfaces, however, assembly of the protein at the interface is strongly preferred and the proteins adsorb, forming a monolayer. Lateral interactions between the proteins lead to strongly coherent surface films. Since amphiphilic hydrophobin forms a monolayer whose sides have significantly differing surface energies, these monolayers strongly modify the wetting properties of the target surface.
Here, a wild-type hydrophobin HFBI and a glycosylated hydrophobin FpHYD5 were studied as lubricant additives in aqueous environment on stainless steel. We investigated the affinity of the proteins to stainless steel and the amount of bound water in different conditions. The same conditions were applied in the tribological tests, performed on macroscopic scale.
Results
Adsorption of proteins on stainless steel
Binding of both proteins, HFBI and FpHYD5 on stainless steel (SS2343/AISI316) was studied by QCM-D and ellipsometry. QCM-D measures the additional mass bound on the sensor surface, including the solvent layer that is bound to the adsorbing molecules, whereas ellipsometry can only detect the so-called dry mass. Thus the combination of these methods allowed measurement of the amount of water in the protein layer. The bound masses of both proteins on stainless steel are presented in Fig. 1 and 2. The bound masses were calculated from the frequency changes measured by QCM-D by the Sauerbrey equation:14 | (1) |
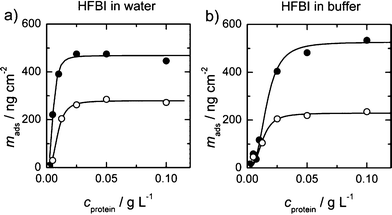 | ||
| Fig. 1 Binding curves of HFBI in water and in a 50 mM acetate buffer. The closed symbols are the adsorbed masses measured by QCM, whereas the open symbols represent ellipsometry data. A simple one binding site curve was fitted to all data. With QCM, a significantly higher mass was measured in both conditions. | ||
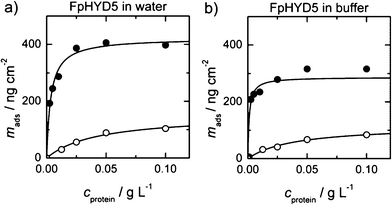 | ||
| Fig. 2 Binding curves of FpHYD5 in water and in a 50 mM acetate buffer. The closed symbols are the adsorbed masses measured by QCM, whereas the open symbols represent ellipsometry data. A simple one binding site curve was fitted to all data. With QCM, a significantly higher mass was measured in both conditions. | ||
For the evaluation of the data recorded by ellipsometry, an optical box model consisting of stainless steel (nss = 2.157, kss = 3.323), the protein film (nf = 1.460) and the water or buffer solution (ns = 1.3367) was applied. The absolute amount of adsorbed protein Γ was determined with de Feijter's formula:
 | (2) |
The refractive index of the protein was assumed to be a linear function of its concentration. The increment of the refractive index, due to concentration increase with dn/dc, was taken from literature and assumed constant 0.183 cm3g−1.15–17
Fig. 1 and 2 show the measured amounts of adsorbed proteins from water and acetate buffer as a function of protein concentration. Saturation of the adsorbed amount for HFBI and FpHYD5 was achieved near concentrations 0.25 g L−1 and 0.1 g L−1 correspondingly. In Fig. 1 the x-axes were cut for clarity to 0.125 g L−1. The data was modelled by a simple Langmuir adsorption isotherm, taking into account possible co-operativity of binding. The following equation was fitted to the measured adsorbed mass mads of the proteins.
 | (3) |
Here, Bmax denotes the maximum adsorbed amount of the protein, K is the equilibrium constant of adsorption, c the protein concentration and n′ the number of co-operative binding sites. The results from the fitting of this equation to all the measurements, including both QCM-D and ellipsometry, are presented in Table 1. The equilibrium constant is given as the affinity constant Kd, which is the equilibrium constant of desorption and is often used as the measure of binding affinity of biomolecules.
In the case of HFBI (see Fig. 1), the binding curves have slightly sigmoidal shapes, thus the number of co-operative binding sites n′ was greater than 1. The best fit to the data was obtained by assuming n′ = 3 for HFBI. For FpHYD5, assumption n′ = 1 fitted the data best and thus n was fixed as one.
The amount of proteins that bind on the stainless steel surface was obtained from the data measured by ellipsometry. The ionic strength of the protein solutions had only a minor effect on the protein coverage, showing slightly smaller amounts of bound protein from buffer. The most significant effect of buffer was obtained by QCM-D in the affinity of HFBI (Fig. 1), where the affinity increased significantly from 0.54 g L−1 to 1.61 g L−1 when adsorption occurred from buffer instead of water.
In every series of measurements, the amount of bound mass measured with QCM-D was significantly higher than the amount measured by ellipsometry. The difference between the corresponding two binding curves denotes the amount of water associated in the surface layer in each condition. The water content was reasonably high, as much as 64% of the total for FpHYD5 and between 40% and 56% for HFBI when comparing the Bmax values. When adsorbed from buffer, the HFBI layer could bind a larger amount of water than in lower ionic strength in water. For FpHYD5 the situation was the opposite, and the absolute amount of bound water was higher in pure water.
Pin-on-disc (POD) experiments
The ability of hydrophobins to act as lubricant additives in water was studied by evaluating the coefficient of friction (COF) and wear amount of a stainless steel sphere in sliding contact against a stainless steel disc. It was observed that friction and wear measured for acetate buffer was much lower compared to ion exchanged water (Fig. 3). When 1.0 g L−1 of hydrophobins HFBI or FpHYD5 were added, friction and wear were reduced, regardless of whether water or sodium acetate buffer was used. The lowest coefficients of friction were measured for FpHYD5 in water, and lowest wear for FpHYD5 in buffer. The initial coefficient of friction was 0.2 when lubricated with HFBI in water, but this began to increase after a certain amount of sliding.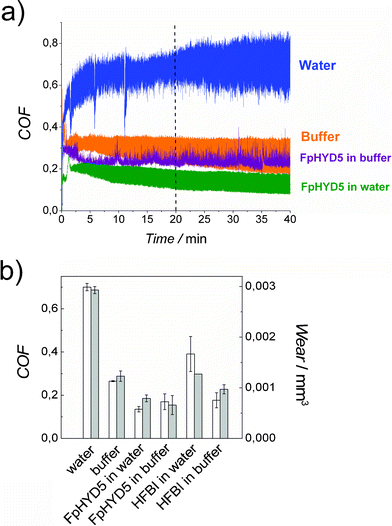 | ||
| Fig. 3 a) Coefficient of friction vs. time curves and b) average coefficients of friction (white bars) and wear volumes (grey bars) of different lubricants in pin-on-disc experiments. HFBI and FpHYD5 concentrations were 1.0 g L−1. The tests were carried with 2 N load, velocity 50 mm s−1, and sliding distance 120 m. The coefficient of friction was determined as an average from 20 to 40 min, and scatter was determined as variation between the average coefficients of friction. | ||
Dependence of the tribological properties of the hydrophobins concentration was studied by carrying out tests in a 50 mM acetate buffer solution with 2 N load and velocity of 50 mm s−1, using protein concentrations of 0.1 g L−1, 1.0 g L−1 and 5.0 g L−1. The lowest concentration of both proteins did not reduce friction compared to the buffer solution, and sometimes even a small increase in friction and wear was observed when a steady state of friction was achieved (Fig. 4). Friction measured with 1.0 and 5.0 g L−1 protein solutions was very similar, thus it appeared that increasing the protein concentration above 1.0 g L−1 did not further reduce friction.
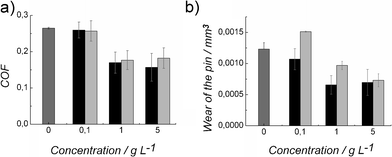 | ||
| Fig. 4 a) The effect of protein concentration on coefficient of friction (COF) and b) on the wear volume of the stainless steel sphere in pin-on-disc experiments. Proteins were in 50 mM sodium acetate buffer. Both FpHYD5 (black columns) and HFBI (grey columns) showed decrease in friction and wear as a function of the concentration. Concentration 0 refers to 50 mM sodium acetate buffer pH 5. All lubricants were tested with 2 N load, sliding velocity 50 mm s−1 and sliding distance 120 m. | ||
The wear volume of lubricated contacts was calculated by measuring the dimensions of the wear track of the stainless steel sphere after sliding on the stainless steel disc (see ESI, Fig. S1–S3†). The sliding distance of the sphere was 120 m. Surprisingly, an addition of a small amount of HFBI (0.1 g L−1) in the buffer solution increased the wear of the sphere. For HFBI, the wear of the sphere was generally higher than for FpHYD5, and there was stronger dependency on the concentration. an increase of FpHYD5 concentration from 1.0 to 5.0 g L−1 in the buffer solution no longer reduced wear. However, the wear of the sphere reduced almost linearly as a function of concentration when lubricated with HFBI in buffer.
Hydrophobins acted as boundary lubricants in CTPOD tests as they prevented polyethylene transfer to the stainless steel counterface. However, friction was not reduced compared to the acetate buffer or water (see ESI Fig. S7†).
Discussion
Adsorption of proteins on stainless steel surfaces
The adsorbed dry weight of both proteins on stainless steel was higher in water than in 50 mM buffer. In the case of HFBI, the amount of proteins bound from water corresponds to a rather densely packed monolayer of molecules, where each molecule occupies an area of ∼4.6 nm2, which is close to the dimensions of a single HFBI molecule. When proteins are packed this closely there is less water bound within the molecules in the layer, which is observed as lower mass in QCM-D measurement when compared to the measurement in buffer. In the case of FpHYD5, being roughly the same size as HFBI, the bound molar amount of protein was lower and corresponded to a much lower density where, on average, there is one molecule in a 14.7 nm2 area. Thus, FpHYD5 layers can contain a much larger fraction of water between the protein molecules. The water contents were especially large in the layer adsorbed from pure water, where the electrostatic interactions are more pronounced due to low ionic strength, and hydration of the proteins and glycans is stronger. Interestingly, the dissipation of all layers was very low; thus the water within the layers was tightly associated with the protein layers.The formation of tightly bound films of HFBI was also reflected by the number of co-operative sites (n = 3), which, theoretically indicates that the protein binds to the surface in small clusters containing approximately three proteins. Although this cannot be taken as an absolute structure of the protein film, the co-operative nature of the binding indicates that the proteins interact strongly with each other when adsorbing to the surface. Strong lateral interactions are typical for hydrophobin films and have been observed earlier at an air/water interface.18 No sign of co-operativity was observed for FpHYD5. A probable reason for this is the rather large carbohydrate structure (1.7 kDa) which may cause electrostatic repulsion and steric hindrance between the molecules, thus weakening the lateral interaction in the protein layer.
Besides the qualitative behaviour, there was a difference in the ability of the proteins to absorb water. The glycosylated FpHYD5 formed layers where most of the mass was water. We believe that this is due to the carbohydrate structures attached to the protein. Thus, a combination of an anchoring group (hydrophobin) and a water absorbing group (carbohydrate) enabled formation of reasonably thick layer of water on the surface. Hydration of proteins in aqueous solution is well known, but not always taken into account when analysing surface films of proteins. The significance of water that can be bound to an interface, such as stainless steel, can be of great importance when considering the behaviour of such interfaces.
Tribology
The results of friction measurements showed that friction and wear in water can be reduced when 50 mM sodium acetate is added. This may be due to the hydration lubrication by hydrated ions adsorbed on the stainless steel surface, or to change in environment (pH).6,19At concentrations as low as 0.1 g L−1, the proteins did not enhance lubrication compared to the buffer solution. However, a decrease in friction and wear was observed when the protein concentration was increased to 1.0 g L−1. Thus, even though a concentration of 0.1 g L−1 of FpHYD5 was enough to provide a saturation of proteins on the stainless steel surface in the binding studies, excess proteins were needed to gain a good lubrication in terms of both reduced friction and wear. This is most probably due to the dynamic situation during the tribological measurement, where the test surfaces were in constant motion and some of the protein sheared away. The adsorption rate of the proteins depended on their concentration (see ESI Fig. S8–S10†), which means that the recovery of the protein layer was faster with the higher concentrations. This could explain why the friction remained low with higher protein concentrations.
By combining the data from the adsorption measurements of Table 1 and the tribology measurements of Fig. 3b, an interesting dependency was observed: wear and friction decreased linearly as a function of the water contents of the protein layer. The data is presented in Fig. 5a, showing a clear decrease of wear and friction as the water percentage increased from 40% to nearly 65%. This shows that the water binding carbohydrate moiety improved the lubrication properties. It is known that many of the proteins essential in synovial lubrication are glycosylated by these kinds of carbohydrate moieties.1 Curiously, the correlation of wear and friction with the bound mass of the proteins was positive, meaning the denser the protein layer, the higher friction and wear it caused (Fig. 5b). This indicates that the obtained decrease in friction was indeed caused by the thin water layer and not by the protein molecules themselves.
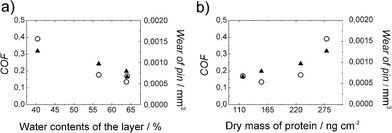 | ||
| Fig. 5 a) Coefficient of friction (COF) (○) and wear (▲) as a function of water contents of the protein layer. b) Coefficient of friction (○) and wear (▲) as a function of the dry mass of protein adsorbed on a stainless steel surface. The data is combined from adsorption and tribology measurements of 1.0 g L−1 HFBI and FpHYD5 in water and 50 mM buffer solutions. | ||
We have shown that both of the hydrophobins formed monolayers on the stainless steel surfaces. We found that the increase in water content on the layer attached to the surface reduces friction and wear. However, a higher amount of adsorbed proteins on the surface increases friction and wear. According to the results it can be assumed that the high amount of water associated with the protein layer and fast adhesion that guarantees rapid replacement of sheared molecules are beneficial for good lubrication.
Experimental
Production and purification of the proteins
HFBI and FpHYD5 were produced using recombinant strains of T. reesei and purified by a two-phase extraction and RP-HPLC as described previously.20,21 The molar masses of HFBI and glycosylated FpHYD5 are 7.54 kDa and 9.21 kDa respectively. The mass of the glycan structure in FpHYD5 is ∼1.7 kDa.Adsorption measurements by QCM-D
A quartz crystal microbalance with dissipation monitoring (QCM-D) was used for simultaneous measurement of frequency and dissipation (D4-QCM system, Biolin Scientific, Sweden) to follow the binding of proteins on stainless steel sensors (SS2343, Biolin Scientific Sweden). First the sensor chips were cleaned in a standard UV/ozone chamber for 10 min and exposed to hot H2O/NH3/H2O2 mixture (1![[thin space (1/6-em)]](https://www.rsc.org/images/entities/char_2009.gif) :
:![[thin space (1/6-em)]](https://www.rsc.org/images/entities/char_2009.gif) 1
1![[thin space (1/6-em)]](https://www.rsc.org/images/entities/char_2009.gif) :
:![[thin space (1/6-em)]](https://www.rsc.org/images/entities/char_2009.gif) 5) for 10 min, followed by rinsing with Milli-Q water. The protein adsorption measurements were carried out by injecting 1 ml of protein solutions, in either milliQ water (Millipore, US) or 50 mM sodium acetate (Sigma-Aldrich, US) using a flow of ∼ 0.1 mL min−1 to the chamber and following the frequency and dissipation responses.
5) for 10 min, followed by rinsing with Milli-Q water. The protein adsorption measurements were carried out by injecting 1 ml of protein solutions, in either milliQ water (Millipore, US) or 50 mM sodium acetate (Sigma-Aldrich, US) using a flow of ∼ 0.1 mL min−1 to the chamber and following the frequency and dissipation responses.
Adsorption measurements by ellipsometry
Ellipsometric measurements were carried out using a multi-wavelength ellipsometer (EP3, Nanofilm, Göttingen, Germany) operated at a single wavelength of 532 nm. The device was set up in a PCSA (polarizer-compensator-sample-analyzer) configuration with an angle of incidence of 65° to the surface normal. A stainless steel QCM-D sensor was placed in a home-made liquid cell that was filled with the corresponding liquid. After equilibration of the surface, the protein solution was injected into the cell by hand with a syringe. Before performing the experiments the sensor was cleaned in a similar manner to the QCM-D experiments. The ellipsometric angles Δ and Ψ were recorded continuously over time via the nulling ellipsometry principle in two zones.17Pin-on-disc experiments
The friction force was measured constantly in pin-on-disc experiments. The pin-on-disc device was designed and developed at VTT. The load used in the experiments was 2 N, sliding velocity 50 mm s−1 and sliding distance 120 m. Three parallel experiments (with HFBI in water two parallel experiments) were carried out.The test specimens were stainless steel discs (AISI 440B) with a diameter of 40 mm (Ra value 0.05 μm or better) and stainless steel spheres (AISI 420) with a diameter of 10 mm. The same disc was used in several tests, and before each test was cleaned by ultrasonic washing in petroleum ether and in ethanol, 5 min each. A new sphere was used in every test.
The lubricant amount in each test was 0.6 ml, added as droplets on to disc by pipette. The lubricant covered the entire area of the wear track. The coefficient of friction was measured as an average value from 20 to 40 min (from 60 to 120 m of sliding). Contact pressures at the end of the experiments were between 4 and 22 MPa depending on the amount of wear of the stainless steel sphere.
Circular translation pin-on-disc experiments
The CTPOD device has been described in detail elsewhere.22 Briefly, the pin translates along a circular track of 10 mm diameter relative to the disc. The sliding speed is constant, 31.4 mm s−1. Such low speed ensures that a boundary (or mixed) lubrication mechanism prevails. Because of the circular translation, the direction of sliding changes continually relative to the pin. Therefore, as there is no rotation, uniaxial grooving is avoided. The device is primarily designed for friction measurements with relatively high loads, up to 1 kN. The disc holder is supported by low-friction ball bearings. The rotation of the disc is prevented by a load cell and a lever arm. The frictional torque and coefficient of friction can be calculated from the load signal. In the present study, the pin was a flat-ended cylinder with a diameter of 9 mm and length of 12 mm. The pin was made from UHMWPE GUR 1050. The disc was made from austenitic stainless steel 316 (ASTM F 138), polished to a surface roughness Ra of 0.01 μm. Hardness of the disc is 200 HB. The contact was flat-on-flat and the nominal contact pressure 4.4 MPa. The test duration was 5 h with hydrophobins and 24 h with reference lubricants. The tests were run at room temperature. The reported COF value was the steady-state value at the end of the test. The specimens were surrounded by a chamber that contained the test lubricant of 3 to 5 ml volume. Due to the high wear resistance of UHMWPE, the test durations were not sufficient for meaningful gravimetric wear measurements. Optical microscopy was used to study the sliding surfaces with respect to possible damage, such as scratching or polyethylene transfer.FTIR analyses of the CTPOD specimens
In order to determine whether any polyethylene transfer was formed on the CTPOD discs during the test, the discs were rinsed after the test with 5 ml of distilled water (∼1 ml cm−2), air-dried overnight, and analyzed with FTIR (Fourier transform infrared spectroscopy). The FTIR analyses of the discs were carried out using the reflectance mode. As a reference sample a UHMWPE sheet was used and analysed with a diamond micro-ATR. The instrument employed for the analyses was a BioRad FTS 6000 FTIR spectrometer interfaced with a UMA 500 IR-microscope equipped with an MCT detector. All the spectra were collected at 4 cm−1 spectral resolution. The background spectra were collected from the respective clean substrates.Conclusions
It was shown that hydrophobin proteins adsorb and form a lubricating monolayer film on a stainless steel surface. The formation of the protein layer significantly reduced friction and wear of the stainless steel/stainless steel contact and reduced transfer of the polyethylene vs. stainless steel contact. Higher water content in the film and a lower amount of adsorbed proteins on the stainless steel surface decrease friction and wear on the studied steel qualities. The water content of the film was increased by attaching a carbohydrate moiety to a hydrophobin protein, and controlled by the conditions.Acknowledgements
We thank Riitta Suihkonen for purification of the proteins, and for funding: Tekes—the Finnish Funding Agency for Technology and Innovation (project New bioinspired and bio-based solutions for lubrication), Academy of Finland (project Biomimetic water lubrication), VTT Technical Research Centre of Finland and Aalto University School of Engineering. PL, HH and KJ acknowledge partial funding by the German Research Foundation via GRK 1276.References
- J. M. Coles, D. P. Chang and S. Zauscher, Curr. Opin. Colloid Interface Sci., 2010, 15, 406–416 CrossRef CAS.
- T. Ahlroos, T. J. Hakala, A. Helle, M. B. Linder, K. Holmberg, R. Mahlberg, P. Laaksonen and S. Varjus, Proc. Int. Mech. Eng. J, 2011, 225, 1013–1022 CrossRef CAS.
- M. P. Heuberger, M. R. Widmera, E. Zobeley, R. Glockshuber and N. D. Spencer, Biomaterials, 2005, 26, 1165–1173 CrossRef CAS.
- G. E. Yakubov, J. McColl, J. H. H. Bongaerts and J. J. Ramsden, Langmuir, 2009, 25, 2313–2321 CrossRef CAS.
- B. Zappone, M. Ruths, G. W. Greene, G. D. Jay and J. N. Israelachvili, Biophys. J., 2007, 92, 1693–1708 CrossRef CAS.
- U. Raviv and J. Klein, Science, 2002, 297, 1540–1543 CrossRef CAS.
- M. B. Linder, Curr. Opin. Colloid Interface Sci., 2009, 14, 356–363 CrossRef CAS.
- K. Chawla, S. Lee, B. P. Lee, J. L. Dalsin, P. B. Messersmith and N. D. Spencer, J. Biomed. Mater. Res., Part A, 2009, 90A, 742–749 CrossRef CAS.
- C.-B. Yang, H.-W. Fang, H.-L. Liu, C.-H. Chang, M.-C. Hsieh, W.-M. Lee and H.-T. Huang, Chem. Phys. Lett., 2006, 431, 380–384 CrossRef CAS.
- H.-W. Fang, M.-C. Hsieh, H.-T. Huang, C.-Y. Tsai and M.-H. Chang, Colloids Surf., B, 2009, 68, 171–177 CrossRef CAS.
- L. Macakova, G. E. Yakubov, M. A. Plunkett and J. R. Stokes, Tribol. Int., 2011, 44, 956–962 CrossRef CAS.
- S. Lee, M. Müller, K. Rezwan and N. D. Spencer, Langmuir, 2005, 21, 8344–8353 CrossRef CAS.
- R. Heeb, S. Lee, N. V. Venkataraman and N. D. Spencer, ACS Appl. Mater. Interfaces, 2009, 5, 1105–1112 Search PubMed.
- G. Sauerbrey, Z. Phys., 1959, 155, 206–222 CrossRef CAS.
- J. A. de Feijter, J. Benjamins and F. A. Veer, Biopolymers, 1978, 17, 1759 CrossRef CAS.
- V. Ball and J. J. Ramsden, Biopolymers, 1998, 46, 489 CrossRef CAS.
- H. G. Tompkins and E. A. Irene, ed., Handbook of Ellipsometry, Heidelberg, Springer, 2005 Search PubMed.
- G. R. Szilvay, A. Paananen, K. Laurikainen, E. Vuorimaa, H. Lemmetyinen, J. Peltonen and M. B. Linder, Biochemistry, 2007, 46, 2345–2354 CrossRef CAS.
- G. W. Stachowiak and A. W. Batchelor, Engineering Tribology, 3rd edition, Elsevier, Amsterdam, 2005 Search PubMed.
- M. B. Linder, M. Qiao, F. Laumen, K. Selber, T. Hyytiä, T. Nakari-Setälä and M. E. Penttilä, Biochemistry, 2004, 43, 11873–11882 CrossRef CAS.
- T. Sarlin, T. Kivioja, N. Kalkkinen, M. B. Linder and T. Nakari-Setälä, J. Basic Microbiol., 2011, 51, 1–11 CrossRef.
- V. Saikko, Proc. Inst. Mech. Eng., Part H, 2006, 220, 723–731 CrossRef CAS.
Footnote |
| † Electronic Supplementary Information (ESI) available: QCM, ellipsometry, FTIR and CTPOD data, as well as pictures of worn surfaces. See DOI: 10.1039/c2ra21018e |
| This journal is © The Royal Society of Chemistry 2012 |
