Synthesis of Cu2ZnxSnySe1+x+2y nanocrystals with wurtzite-derived structure†
Xianzhong
Lin
*,
Jaison
Kavalakkatt
,
Kai
Kornhuber
,
Daniel
Abou-Ras
,
Susan
Schorr
,
Martha Ch.
Lux-Steiner
and
Ahmed
Ennaoui
*
Helmholtz-Zentrum Berlin für Materialien und Energie GmbH, Hahn-Meitner-Platz 1, Berlin, 14109, Germany. Fax: + 49 30 806243199; Tel: + 49 30 8062 42579E-mail: lin.xianzhong@helmholtz-berlin.de; ennaoui@helmholtz-berlin.de
First published on 17th August 2012
Abstract
The most reported stable crystal structure of Cu2ZnSnS4 and Cu2ZnSnSe4 (CZTSe) is kesterite, which is derived from the ternary chalcopyrite structure. However, by controlling the reaction conditions, we found that the structure and composition of the CZTSe nanocrystals (NCs) can be tuned. This can be achieved by using a simple hot injection approach. The structural properties of the CZTSe NCs were characterized by powder X-ray diffraction (PXRD), Raman spectroscopy and transmission electron microscopy. The energy dispersive X-ray spectroscopy confirms the stoichiometry of CZTSe NCs. The optical band gap of the NCs is found to be around 1.38 eV, as estimated from UV-Vis absorption spectroscopy. PXRD studies show that the obtained CZTSe NCs occurring in three structurally different phases (tetragonal kesterite type, hexagonal wurtzite type and orthorhombic wurtz-stannite type) are converted to the kesterite structure by annealing at 540 °C for 30 min under an Se-vapour atmosphere.
Introduction
Copper-based ternary and quaternary semiconductors, such as CuInS2 (CIS), Cu(In,Ga)Se2 (CIGS), Cu2ZnSnS4 (CZTS) and Cu2ZnSnSe4 (CZTSe), are of great interest due to their potential application as light absorbing materials in thin film solar cells. Among them, CZTS and CZTSe have been considered as an alternative to CIGS as the absorber layers for low cost, high efficiency and sustainable solar cells owing to their intrinsic properties, such as abundance of constituents, direct band gap of 1.0–1.5 eV, and high optical absorption coefficient exceeding 104 cm−1 in the visible range.1–3 Solution thin film deposition techniques have been considered as one of the most promising routes to decrease the cost of the device fabrication due to the non-vacuum environment and low capital equipment costs.4–9 The hydrazine-based solution process of Cu2ZnSn(S,Se)4 (CZTSSe) thin film solar cells has achieved efficiencies as high as 10.1%,8 which is the best CZTS(Se)-based thin film solar cell so far, while the CZTS nanocrystal-based solution process yielded an efficiency of 7.2%.9 Both of these reports demonstrated CZTSSe as a promising absorber layer for high performance photovoltaic devices. Generally, there are two kinds of crystal structures, kesterite and stannite, for both CZTS and CZTSe, based on the literature reported, while kesterite is the ground-state structure according to the theoretical and experimental studies.10–12 Both of these two structures are zinc-blende derived structures. Interestingly, two corresponding wurtzite derived structures, wurtzkesterite and wurtzstannite, were reported theoretically by Chen et al.13 through a recent global search based on the valence octet rule. Similarly, the structural relation between kesterite and stannite, wurtzkesterite and wurtzstannite, is that they have a similar unit cell but differ in the occupation of Cu, Zn and Sn cations. Kesterite and stannite type CZTS(Se) nanocrystals (NCs), nanosheets and nanowires have been extensively reported.14–21 Moreover, several groups have recently reported the synthesis of metastable phases of CZTS and CZTSe such as wurtzite-type,22–24 orthorhombic wurtz-stannite25 CZTS NCs and wurtzite type CZTSe NCs.26 All these reports focus on the manipulation of the organic solvents to get a single phase of the metastable structure CZTS(Se) NCs. However, there are few reports about the influence of the metal salt precursors on the structure and composition of the CZTS(Se) NCs. Rath et al.27 reported that the chemical composition of CZTSe NCs strongly depends on the metal salt reactants used for the synthesis. Herein, we report a synthesis of CZTSe NCs by using oleylamine and oleic acid as the solvent and the capping agent. We found that the metal salt reactants have an influence on not only the chemical composition but also on the structure of the CZTSe NCs.Experimental
Materials
Copper(II) chloride dehydrate (99%), zinc chloride anhydrate (97%) and zinc acetate dihydrate (98%) were purchased from Alfa Aesar. Copper acetylacetonate (>99.99%), tin(II) chloride (>99.99%), diphenyl diselenide (98%), oleic acid (technical grade, 90%), oleylamine (technical grade, 70%), absolute ethanol, hexane and toluene were purchased from Aldrich. Sodium oleate (>97.0%) was from TCI Europe. All chemicals were used directly without any further purification.Preparation of copper–oleate and zinc–oleate precursors
The copper–oleate complex was synthesized by reaction of CuCl2·2H2O with sodium oleate.28 Specifically, 10 mmol CuCl2·2H2O and 20 mmol sodium oleate were dissolved in a solvent mixture composed of 10 ml ethanol, 15 ml distilled water and 35 ml hexane with continuous stirring. The obtained solution was heated to 70 °C and held at this temperature for 4 h. When the reaction was completed, the upper organic layer containing the copper–oleate complex was washed three times with 10 ml distilled water in a separating funnel. After washing, the hexane was evaporated off, resulting in a copper–oleate complex in a waxy solid form. Zinc–oleate was prepared by the same procedure.Synthesis of CZTSe NCs
Sample A: CZTSe NCs containing both wurtzite type and kesterite structure were synthesized using copper oleate, zinc oleate and tin chloride as the cation precursors. In a typical synthesis, 1 mmol copper oleate, 0.5 mmol zinc oleate, 1 mmol diphenyl diselenide and 25 mL oleylamine were added to a 100 mL three-necked flask in air, then the flask was removed to a glove box filled with nitrogen and heated to 120 °C with N2 bubbling and held at this temperature for 30 min. The mixture was then heated to 250 °C. In a separate two-necked flask, the mixture of 0.5 mmol SnCl2, 2 mL oleic acid and 5 mL oleylamine was heated to 120 °C with N2 bubbling in the glove box for 30 min, then allowed to cool to 70 °C. When the temperature of the former solution was raised to 250 °C, the mixture of SnCl2, oleic acid and oleylamine was injected. After injection, the temperature was raised to 230 °C and kept at this temperature for 60 min to allow the reaction to take place. After that, the reaction solution was cooled down to room temperature. The NCs were precipitated with excess ethanol and were centrifuged at 6000 rpm for 10 min. After centrifugation, the supernatant was discarded, and the NCs were redispersed in toluene. The precipitation and dispersion steps were repeated one more time to remove excess oleylamine and oleic acid. Finally the NCs were redispersed in 10 ml toluene for further characterization.Sample B: sample B was synthesized by changing the injection temperature and the reaction temperature to 230 and 250 °C, respectively, while maintaining the other conditions in the preparation of sample A.
Sample C was synthesized by replacing the copper oleate and zinc oleate with copper acetylacetonate and zinc acetate dihydrate, respectively, but keeping the other conditions unchanged in the preparation of sample B.
Characterization
Powder X-ray diffraction (PXRD) patterns were operated in the 2θ range from 10 to 90° on a Bruker D8-Advance X-ray diffractometer with Cu-Kα1 radiation (λ = 1.5406 Å) using a step size of 0.02° and step time of 0.3 s. The data were analysed by Rietveld refinement to determine the lattice parameters and weight fractions of the phases.29 Transmission electron microscopy (TEM) samples were prepared by dropping diluted NC solution onto carbon film coated gold grids, and a Philips CM12 transmission electron microscope was used to acquire TEM images of the NCs. For the Raman measurement a Ti:Sa-ring-laser was used for excitation of the sample. The wavelength of the laser is fully tenable from 690 nm to 1050 nm. To avoid laser heating, the beam power was kept below 3.5 mW. Raman spectra were recorded with a Horiba T64000 triple monochromator system in a backscattering configuration with a microscope and a motorized XY stage. The micro-Raman spectroscopy with a 100× objective was performed at room temperature for a wavelength of 747 nm. The optical properties of the as-prepared CZTSe NCs were characterized by UV-Vis absorption spectroscopy recorded on a Lambda 950 UV-Vis spectrometer.Results and discussion
Fig. 1 shows the PXRD patterns of CZTSe NCs prepared under different conditions. By visual inspection of the data it can be noticed that, in addition to the Bragg peaks arising from a kesterite type phase, other peaks occur, which may belong to secondary phases. Therefore, we simulated the diffraction pattern of wurtzite type CZTSe, assuming a random distribution of the cations on the Wyckhoff position 2b and of the wurtz-stannite type CZTSe, assuming copper on the 4b position and zinc and tin on two different 2a positions (see Tables S1 and S2, ESI,† for details), to compare them with the experimental results. The intensity ratio of the three Bragg peaks in the 2θ region 24°–30° indicates clearly the existence of a kesterite type phase and a wurtzite type phase. Special attention should be paid to the Bragg peaks in the regions 28.3° to 29.8° and 36.2° to 39.2° (see Fig. 2). The peak fits show clearly the existence of a third phase with a wurtz-stannite type structure. In order to determine the lattice parameters and the fractions of the different phases, a Rietveld analysis of the powder X-ray diffraction pattern was performed. In the refinement, three CZTSe phases were included, a kesterite type phase, a wurtzite type phase and a wurtz-stannite type phase. The Rietveld analysis shows that the wurtzite and wurtz-stannite type phases are Sn poor; moreover the wurtzite type phase obeys a strong preferred orientation in the [001] direction, which may be explained by the platelet-like crystals. The results of the Rietveld analysis are summarized in Table 1. Comparing the phase content in the samples, in sample A kesterite type CZTSe is the main phase, whereas in sample C wurtzite type CZTSe dominates. The PXRD results indicate that the structure of the NCs can be transformed from the kesterite type dominated structure to the wurtzite type dominated structure by controlling the reaction conditions. It should be noted that a third phase with a wurtz-stannite structure is always present as a secondary phase, but its fraction changes. Furthermore, the average crystal sizes of samples A, B and C are 20.0, 22.2 and 17.6 nm, respectively, as determined by the Scherrer equation using the 100 Bragg peak.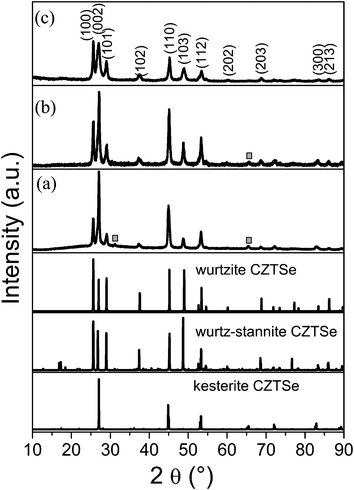 | ||
| Fig. 1 PXRD patterns of (a) sample A, (b) sample B and (c) sample C. For reference, the simulated diffraction patterns of the wurtzite type, wurtz-stannite type and kesterite type CZTSe are shown below. The simulated patterns were obtained by the powder cell software. | ||
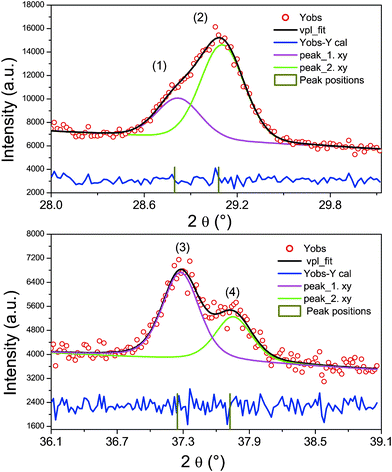 | ||
| Fig. 2 Peak fits of parts of the diffraction pattern (within 28.3°–29.8° and 36.2°–39.2°). The marked Bragg peaks correspond to: (1) 101 wurtzite and 211 wurtz-stannite; (2) 021 wurtz-stannite; (3) 102 wurtzite and 212 wurtz-stannite and (4) 022 wurtz-stannite. | ||
| Sample | Phase (structure type) | Lattice parameters | d 100 (Å) | Weight fraction |
|---|---|---|---|---|
| A | kesterite type | a = 5.696 (1) Å, c = 11.451 (2) Å | 59 (5)% | |
| wurtzite type | a = 4.017 (1) Å, c = 6.479 (1) Å | 3.479 | 7 (2)% | |
| wurtz-stannite type | a = 8.032 (2) Å, b = 6.938 (1) Å, c = 6.651(1) Å | 34 (3)% | ||
| B | kesterite type | a = 5.684 (1) Å, c = 11.408 (2) Å | 48 (4)% | |
| wurtzite type | a = 4.015 (1) Å, c = 6.632 (1) Å | 3.477 | 45 (4)% | |
| wurtz-stannite type | a = 8.001 (2) Å, b = 6.892 (1) Å, c = 6.678(1) Å | 7 (2)% | ||
| C | kesterite type | a = 5.680 (1) Å, c = 11.418 (2) Å | 26 (2)% | |
| wurtzite type | a = 4.004 (1) Å, c = 6.617 (1) Å | 3.467 | 71 (5)% | |
| wurtz-stannite type | a = 7.958 (2) Å, b = 7.413 (1) Å, c = 6.675(1) Å | 3 (1)% |
To study the morphology and further confirm the structure of the synthesized CZTSe NCs, TEM analysis on all three samples was carried out, as shown in Fig. 3. Fig. 3(a) shows a low magnification TEM image of polydispersed CZTSe NCs with a hexagonal shape. The size of the NCs varies from 15 nm to 80 nm. The high resolution TEM (HRTEM) image of a typical NC (Fig. 3(b)) shows the high crystallinity of the CZTSe NCs with continuous lattice fringes throughout the whole particle. The distance between the two lattice fringes was measured to be 0.347 nm, corresponding to the (100) lattice plane distance (d100) of wurtzite type CZTSe. Fig. 3(c) shows a low magnification image of sample B. Unlike sample A, the shape of CZTSe NCs of sample B is slightly irregular and the size distribution of the NCs is smaller in the range 10 nm to 45 nm. However, the measured d spacing value of 0.348 nm from the HRTEM image of a single NC (Fig. 3(d)) is in agreement with the (100) lattice plane distance (d100) of the wurtzite type CZTSe. Fig. 3(e) indicates that the CZTSe NCs of sample C are hexagonal in shape, which is similar to sample A. The HRTEM image (Fig. 3(f)) of a typical hexagonal CZTSe NC exhibits clear lattice fringes with the same measured d spacing distance as that of sample A, indicating a wurtzite type structure.
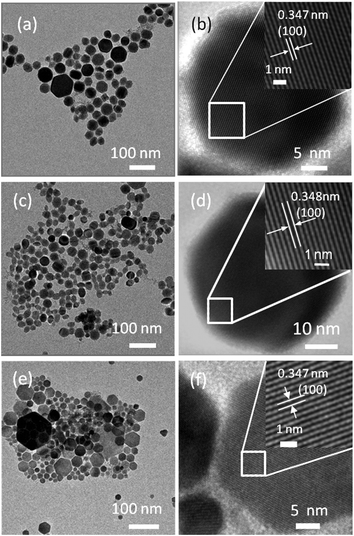 | ||
| Fig. 3 (a) TEM image and (b) HRTEM of sample A; (c) TEM image and (d) HRTEM of sample B; (e) TEM image and (f) HRTEM of sample C. | ||
The chemical compositions of the as-synthesized CZTSe NCs were studied by energy dispersive X-ray spectroscopy (EDX). Haas et al.,19 pointed out that CZTSe NCs prepared by the oleylamine chemical route exhibited a broad range of chemical composition heterogeneity; therefore we analysed several randomly selected areas of the samples by EDX. The average atomic concentrations of the samples are shown in Table 2. As shown in Table 2, the chemical composition of the obtained CZTSe NCs can be tuned by changing the reaction conditions. For example, when the reaction temperature changed from 230 °C to 250 °C, the atomic ratio of zinc increased from 0.5 at% to 2.5 at%. Furthermore, the at% of Zn rose to 14.0 at% by substitution of reactants of copper acetylacetonate and zinc acetate dehydrate for the Cu–oleate and Zn–oleate complexes. The difference in the chemical compositions may due to the differential relative reactivity of the reactants. The results of the PXRD and TEM measurements indicate that the structure and composition of the CZTSe NCs can be tuned by controlling the reaction conditions such as temperature and reactants.
| Cu (at%) | Zn (at%) | Sn (at%) | Se (at%) | |
|---|---|---|---|---|
| Sample A | 36.9 | 0.5 | 13.1 | 49.5 |
| Sample B | 33.1 | 2.5 | 12.9 | 51.5 |
| Sample C | 25.0 | 14.2 | 6.8 | 54.0 |
It is known that PXRD alone is not enough to rule out the existence of secondary phases such as ZnSe, Cu2SnSe3 because of the similar PXRD patterns among ZnSe, Cu2SnSe3 and CZTSe.
Although the EDX measurements indicate that all four elements (Cu, Zn, Sn and Se) are present in the as-synthesized products, it is also possible that the signals came from the mixture of ZnSe and Cu2SnSe3. Therefore, to further confirm that the obtained products are CZTSe NCs rather than ZnSe, Cu2SnSe3 or a mixture of ZnSe and Cu2SnSe3, Raman spectroscopy measurements were performed on sample C, as shown in Fig. 4. The spectrum displays the strongest peak located at 191 cm−1, which is considered as the main feature of the vibrational A1 symmetry mode from CZTSe.5,20,21,30 In addition, a shoulder peak at 173 cm−1 and a broad peak at 235 cm−1 were found by fitting the spectrum with a Lorentzian curve using the Peak-of-mat software. These two peaks can be attributed to CZTSe, according to the literature reports.5,20,21,30 There are no additional peaks indicating that the as-synthesized NCs are CZTSe.
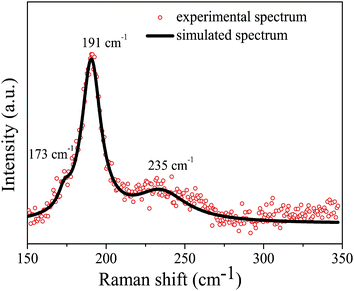 | ||
| Fig. 4 Raman spectrum of CZTSe NCs (sample C) measured at room temperature. | ||
The optical properties of the CZTSe NCs from the typical sample C have been studied by UV-Vis absorption spectroscopy, as shown in Fig. 5. The optical band gap energy was determined by extrapolating the linear region of the plot of (αhν)2versus photon energy (hν) and taking the intercept on the hν-axis. There are large discrepancies about the optical band gap energy of CZTSe based on the reported values, which varied from 0.85 eV to 1.6 eV.18,20,21,26,31,32 Therefore, the estimated optical band gap energy of 1.38 eV is within the reasonable range.
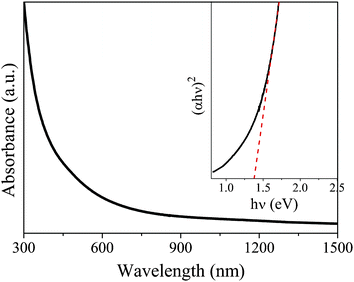 | ||
| Fig. 5 UV-Vis absorption spectrum of CZTSe nanocrystals (sample C) dispersed in toluene. Inset is the plot of (αhν)2versus hν (eV) for the nanocrystals. | ||
For the application of the CZTSe NCs in thin film photovoltaic devices, a further annealing process of the CZTSe NC thin films at a higher temperature to get a larger grain is necessary. Therefore, it is important to know the phase stability of wurtzite type CZTSe NCs. Jiang et al. showed that the orthorhombic wurtz-stannite type CZTS particles can be transformed into kesterite type CZTS by annealing at 500 °C for 2 h.25 However, tin loss has been known to occur during the annealing process, according to literature reports.9,33,34 To reduce the loss of tin, we annealed the samples at a shorter time of 30 min at different temperatures (500 and 540 °C). The result of the PXRD measurement (Fig. 6(b)) shows that a kesterite type CZTSe phase is present besides the wurtzite type CZTSe after annealing at 500 °C in a selenium vapour atmosphere for 30 min. However, the PXRD pattern of CZTSe NCs, annealed at 540 °C for 30 min (Fig. 6(c)), reveals that all the Bragg peaks match very well with the kesterite type CZTSe, and the Bragg peaks ascribing to wurtzite type CZTSe disappeared, indicating that the wurtzite CZTSe NCs have completely transformed to a kesterite type structure.
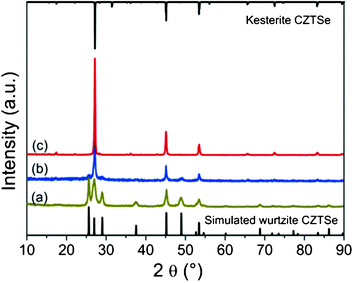 | ||
| Fig. 6 PXRD patterns of wurtzite-derived CZTSe before (a) and after annealing at 500 °C (b) and 540 °C (c) for 30 min in a selenium atmosphere. | ||
Conclusions
In summary, a simple synthetic route for producing CZTSe NCs with tunable structure and composition is presented. The crystal structure of the CZTSe NCs can be tuned from mainly the kesterite type to mainly the wurtzite type by controlling the reaction conditions, such as metal salt reactants and reaction temperature. PXRD and TEM measurements confirm the structural properties of the CZTSe NCs. Raman spectroscopy measurement reveals that the as-obtained NCs are pure CZTSe, without secondary phases such as ZnSe and Cu2SnSe3. The wurtzite type CZTSe NCs transformed into the kesterite type CZTSe when annealed at 540 °C for 30 min. The optical band gap of the CZTSe NCs in solution was estimated to be 1.38 eV, which is ideal for solar energy conversion.Acknowledgements
This work was carried out as part of a program supported by the BMBF (Grant 03SF0363B). The authors would like to thank Ulrike Bloeck for the TEM measurements. One of the authors (Xianzhong Lin) gratefully acknowledges the financial support from the Chinese Scholarship Council, HZB and Helmholtz Association.References
- H. Katagiri, K. Jimbo, W. S. Maw, K. Oishi, M. Yamazaki, H. Araki and A. Takeuchi, Thin Solid Films, 2009, 517, 2455 CrossRef CAS.
- S. Ahn, S. Jung, J. Gwak, A. Cho, K. Shin, K. Yoon, D. Park, H. Cheong and J. H. Yun, Appl. Phys. Lett., 2009, 97, 021905 CrossRef.
- Y. B. K. Kumar, S. G. Babu, P. U. Bhaskar and V. S. Raja, Sol. Energy Mater. Sol. Cells, 2009, 93, 1230 CrossRef.
- H. W. Hillhouse and M. C. Beard, Curr. Opin. Colloid Interface Sci., 2009, 14, 245 CrossRef CAS.
- D. B. Mitzi, O. Gunawan, T. K. Todorov, K. Wang and S. Guha, Sol. Energy Mater. Sol. Cells, 2011, 91, 1421 CrossRef.
- A. Ennaoui, M. Lux-steiner, A. Weber, D. Abou-ras, I. Kötschau, H. Schock, R. Schurr, A. Hölzing, S. Jost, R. Hock, T. Voß, J. Schulze and A. Kirbs, Thin Solid Films, 2009, 517, 2511 CrossRef CAS.
- S. E. Habas, H. A. S. Platt, M. F. A. M. van Hest and D. S. Ginley, Chem. Rev., 2010, 110, 6571 CrossRef CAS.
- B. Shin, O. Gunawan, Y. Zhu, N. A. Bojarczuk, S. J. Chey and S. Guha, Prog. Photovoltaics, 2012, 20, 6 Search PubMed.
- Q. Guo, G. M. Ford, W.-C. Yang, B. C. Walker, E. A Stach, H. W. Hillhouse and R. Agrawal, J. Am. Chem. Soc., 2010, 132, 17384 CrossRef CAS.
- S. Chen, X. G. Gong, A. Walsh and S.-H. Wei, Appl. Phys. Lett., 2009, 94, 041903 CrossRef.
- S. Nakamura, T. Maeda and T. Wada, Jpn. J. Appl. Phys., 2010, 49, 121203 CrossRef.
- S. Schorr, Sol. Energy Mater. Sol. Cells, 2011, 95, 1482 CrossRef CAS.
- S. Chen, A. Walsh, Y. Luo, J.-H. Yang, X. Gong and S.-H. Wei, Phys. Rev. B, 2010, 82, 1 Search PubMed.
- C. Steinhagen, M. G. Panthani, V. Akhavan, B. Goodfellow, B. Koo and B. A Korgel, J. Am. Chem. Soc., 2009, 131, 12554 CrossRef CAS.
- Q. Guo, H. W. Hillhouse and R. Agrawal, J. Am. Chem. Soc., 2009, 131, 11672 CrossRef CAS.
- S. C. Riha, B.A Parkinson and A. L. Prieto, J. Am. Chem. Soc., 2009, 131, 12054 CrossRef CAS.
- A. Shavel, J. Arbiol and A. Cabot, J. Am. Chem. Soc., 2010, 132, 4514 CrossRef CAS.
- H. Wei, W. Guo, Y. Sun, Z. Yang and Y. Zhang, Mater. Lett., 2010, 64, 1424 CrossRef CAS.
- W. Haas, T. Rath, A. Pein, J. Rattenberger, G. Trimmel and F. Hofer, Chem. Commun., 2011, 47, 2050 RSC.
- L. Shi and Q. Li, CrystEngComm, 2011, 13, 6507 RSC.
- L. Shi, C. Pei, Y. Xu and Q. Li, J. Am. Chem. Soc., 2011, 133, 10328 CrossRef CAS.
- X. Lu, Z. Zhuang, Q. Peng and Y. Li, Chem. Commun., 2011, 47, 3141 RSC.
- A. Singh, H. Geaney, F. Laffir and K. M. Ryan, J. Am. Chem. Soc., 2012, 134, 2910 CrossRef CAS.
- M. D. Regulacio, C. Ye, S. H. Lim, M. Bosman, E. Ye, S. Chen, Q. H. Xu and M. Y. Han, Chem.–Eur. J., 2012, 18, 3127 CrossRef CAS.
- H. Jiang, P. Dai, Z. Feng, W. Fan and J. Zhan, J. Mater. Chem., 2012, 22, 7502 RSC.
- J.-J. Wang, J.-S. Hu, Y.-G. Guo and L.-J. Wan, NPG Asia Mater., 2012, 4, e2 CrossRef.
- T. Rath, W. Haas, A. Pein, R. Saf, E. Maier, B. Kunert, F. Hofer, R. Resel and G. Trimmel, Sol. Energy Mater. Sol. Cells, 2012, 101, 87 CrossRef CAS.
- J. Park, K. An, Y. Hwang, J.-G. Park, H.-J. Noh, J.-Y. Kim, J.-H. Park, N.-M. Hwang and T. Hyeon, Nat. Mater., 2004, 3, 891 CrossRef CAS.
- J. Rodriguez-Carjaval, Phys. B, 1993, 192, 55 CrossRef.
- A. Redinger, K. Hönes, X. Fontané, V. Izquierdo-Roca, E. Saucedo, N. Valle, A. Pérez-Rodríguez and S. Siebentritt, Appl. Phys. Lett., 2011, 98, 101907 CrossRef.
- M. Altosaar, J. Raudoja, K. Timmo, M. Danilson, M. Grossberg, J. Krustok and E. Mellikov, Phys. Status Solidi A, 2008, 205, 167 CrossRef CAS.
- G. S. Babu, Y. B. K. Kumar, P. U. Bhaskar and S. R. Vanjari, Sol. Energy Mater. Sol. Cells, 2010, 94, 221 CrossRef.
- A. Redinger, D. M. Berg, P. J. Dale and S. Siebentritt, J. Am. Chem. Soc., 2011, 133, 3320 CrossRef CAS.
- J. J. Scragg, T. Ericson, T. Kubart, M. Edoff and C. Platzer-bj, Chem. Mater., 2011, 23, 4625 CrossRef CAS.
Footnote |
| † Electronic Supplementary Information (ESI) available: Crystal structure and simulation parameters of kesterite, wurtzite, and wurtz-stannite type CZTSe for X-ray diffraction pattern. See DOI: 10.1039/c2ra21293e |
| This journal is © The Royal Society of Chemistry 2012 |
