Generation of inorganic–organic core-shell crystalline nanoparticles of silver and p-hydroxyacetanilide†
Subhojit
Das
a and
Arun
Chattopadhyay
*ab
aDepartment of Chemistry, Indian Institute of Technology Guwahati, Guwahati-781039, Assam, India. E-mail: arun@iitg.ernet.in; Fax: +91(361) 258 2349; Tel: +91(361) 258 2304
bCentre for Nanotechnology, Indian Institute of Technology Guwahati, Guwahati-781039, Assam, India.
First published on 31st August 2012
Abstract
We report the generation of core-shell crystalline inorganic–organic hybrid nanoparticles (NPs). This has been achieved by the formation of a crystalline layer of p-hydroxyacetanilide (pHA) on metallic Ag NPs. The core-shell NPs formed when an aqueous mixture of Ag NPs and acetone-dissolved pHA was allowed to evaporate at room temperature. UV/Vis spectroscopic measurements exhibited a systematic blue shift of the extinction maximum with time, indicating the changes in the dielectric medium surrounding the NPs. Transmission electron microscopy (TEM) studies of the sample from the medium indicated formation of a thin shell of organic layer over the NPs. The organic moiety was crystalline as established by selected area electron diffraction (SAED) and X-ray diffraction (XRD) studies. The optical properties of the Ag NPs did not show any other significant change in the presence of the crystalline layers of pHA over them. Further, TEM observations indicated melting of the organic layer in the presence of a high energy beam and at longer exposure times. The results also indicated deposition of smaller organic crystals first on the surface of the NPs followed by growth of the organic layer leading to the formation of the shell.
1. Introduction
Combinations of properties of two dissimilar nanocrystals (NCs) or other nanoscale materials, in the form of core-shell structures, provide additional opportunities in advanced nanoscale materials, which are not attainable using either of the component crystals only. The blend could invoke optical, magnetic, chemical and biochemical properties in order to generate materials where the combined properties could be more than simple additions of the components.1 Thus the optical properties of metal nanoparticles (NPs) and semiconductor NCs have been modified using core-shell structures consisting of NPs of metal–metal, magnetic compound–metal, metal–semiconductor, semiconductor–semiconductor, metal–metal oxide, and metal–polymer components.2–7 Further, the occurrence of the well-known Fano resonance has been demonstrated using metal NP core-shell structures with a silica spacer layer in between.8 It is interesting to note that while there are significant reports on the formation of core-shell structures involving inorganic NCs, there is no report – as far as our knowledge goes – on the formation of an organic NC grown as a shell on an inorganic NP. However, a recent report on thiol-capped Ag NPs in a polymer matrix suggested formation of crystalline packing on the NP, although no clear evidence on the formation of a crystalline outer shell was presented.9 From the scientific point of view, it is challenging to grow the crystal of an organic compound on the surface of an inorganic particle, whose crystalline parameters are widely different. Also, a drug in the form of organic NCs deposited over a plasmonic NP could have an additional advantage of laser heating of the inorganic NP for enhanced therapeutic values. For example, we have recently demonstrated that a combination of Ag NPs, paracetamol and its dimer provide high antimicrobial activity with linearization of DNA of the bacteria,10 thus introducing a novel way in this regard. Further, plasmonic properties of the NP core could possibly be tuned with the organic shell crystals present outside.We report herein the formation of crystalline organic shell structures on the Ag NPs. The organic molecule that we have used is p-hydroxyacetanilide (pHA), otherwise known as paracetamol or acetaminophen. Addition of pHA to citrate-stabilized Ag NPs in aqueous medium, followed by evaporation, led to the formation of core-shell structures with pHA as the shell (Ag@pHA), which was revealed by transmission electron microscopy (TEM). Selected area electron diffraction (SAED) studies supported the presence of crystalline Ag NPs as well as pHA. This was further corroborated by X-ray diffraction (XRD) studies. Interestingly, with the exposure to high energy electron beams of the TEM for longer periods, the outer organic layers could be found to have been melted. Further, TEM experiments suggested the deposition of smaller organic crystals on the surface of the NPs followed by their further growth as a mechanism of formation of the core-shell structure.
2. Experimental section
2.1. Materials
Silver nitrate (AgNO3) (Sigma-Aldrich), trisodium citrate (Merck, 99%) and p-hydroxyacetanilide (pHA) (Merck, 99%), were all used as received without further purification. Milli-Q grade water with a resistivity of 18.2 MΩ cm−1 was used in all experiments. All glassware and magnetic stir bars used were cleaned with aqua regia and rinsed with Milli-Q water prior to the start of experiments.2.2. Experimental
Colloidal Ag NP solution was prepared by the reduction of AgNO3 by trisodium citrate, which also acted as the stabilizing agent for the NPs.11 Typically, 17 mg AgNO3 was dissolved in 100 mL water and the solution was allowed to boil under magnetic stirring. After 2 min of boiling, an aqueous solution of citrate (35 mM, 10 mL) was rapidly added to the flask. The solution turned yellowish within a few minutes, indicating the formation of Ag NPs. The solution was allowed to boil for an additional 6 min and after this the heating mantle was removed and the solution was allowed to cool. The so-prepared NP dispersion was washed by centrifugal precipitation at 5000 RPM (twice); the precipitate was redispersed in water for further use.To 50 mL of the above solution, 100 mg pHA was dissolved and the resulting solution was allowed to stand undisturbed for 10–12 h. After this time, the solution was centrifuged at 5000 RPM and the precipitate (another sample of which was also used for FTIR studies) was redispersed in 40 mL water. 20 mL acetone solution of pHA (300 mg) was added to the above solution under vigorous stirring. Stirring was allowed to continue for some time. The dispersion was allowed to stand as such at room temperature and on day 5, the same was centrifuged and the precipitate used for XRD and TEM (wherever mentioned) studies. On the other hand, the dispersion samples (without centrifugation) on day 0, day 3, and day 5 were used for TEM analyses.
2.3. Methods
UV/Vis absorption spectra were recorded using a Hitachi U-2900 spectrophotometer. FTIR spectra, of discs of the sample prepared after mixing with KBr, were recorded using a Perkin Elmer Spectrum One spectrometer. A TEM sample was prepared by drop-coating dispersion onto a Cu grid coated with carbon. Images were acquired using a JEOL JEM 2100 transmission electron microscope operating at a maximum accelerating voltage of 200 kV. Samples for XRD were prepared by drying the dispersions onto glass cover slips. XRD data were acquired using a Bruker AXS D8 Advance X-ray diffractometer with Cu-Kα1 radiation (λ = 1.54060 Å), operated at 40 kV and 40 mA.3. Results and discussion
As mentioned above, the centrifuged sample of citrate-stabilized Ag NPs was incubated with pHA to obtain pHA-stabilized Ag NPs. The UV/Vis spectrum of pHA-stabilized Ag NPs (Fig. S1a, ESI†) exhibited a rather broad extinction spectrum with the maximum occurring at 435 nm. This is indicative of the presence of Ag NPs of multiple shapes and sizes. TEM measurements indicated the presence of a few rod-shaped particles, in addition to the spherical particles formed in the medium (Fig. S1b–d†). The average (spherical) particle size as measured using TEM was 58 ± 7 nm. The presence of non-spherical particles, coincidentally, helped in studying the crystallization behavior of pHA on differently shaped particles under identical experimental conditions. Fourier transform infra-red (FTIR) spectroscopic measurement of the pHA-incubated and centrifuged samples indicated the presence of N–H stretching band at 3206 cm−1 (Fig. S2†), which was considerably blue-shifted from the N–H stretching band of pure pHA (3168 cm−1). Also, the intensity of the peak in the former was considerably diminished in comparison to that in the latter. This indicated that the weakly bound citrate ligands were replaced by pHA moieties having –NH functional group that can otherwise bind more strongly to the NP surfaces.12,13 It was observed that removal of citrate from the medium and functionalization of the citrate-stabilized Ag NPs with pHA rendered them amenable for further crystal growth. Acetone-dissolved pHA was then added to the dispersion, so that the concentration of pHA in the medium was 0.331 M. The final dispersion consisted of Ag NPs with a value of extinction at the maximum being 0.54 (indicated as day 0 in Fig. 1). The dispersion was then kept in a vial covered with perforated aluminum foil and was allowed to evaporate at room temperature.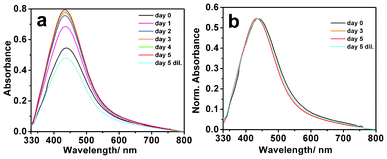 | ||
| Fig. 1 UV/Vis spectra (a, b) of Ag NP-pHA crystallizing medium, recorded for a sample from day 0 to day 5. (λmax: day 0: 439 nm; day 1: 435 nm; day 2: 435 nm; day 3: 434 nm; day 4: 434 nm; day 5: 434 nm; day 5 dil.: 438 nm). Spectra in panel (a) represent as-recorded data, while spectra in panel (b) represent data normalized to the value of maximum at the peak. | ||
The UV/Vis spectrum of the dispersion of Ag NP and pHA (mentioned above) was recorded at time intervals of 24 h, the results of which are shown in Fig. 1. Interestingly, the surface plasmon resonance (SPR) band due to Ag NPs exhibited gradual narrowing with time in comparison to that of the dispersion on day 0. In addition to narrowing, blue shift of the band could be observed. After slow evaporation of the solution till day 5, the volume of the mixture was found to be less than that of the Ag NP dispersion (i.e., before addition of acetone-dissolved pHA) on day 0. The reduction in the volume was due to evaporation of acetone and some amount of water from the medium. Typically, when starting with a mixture of 40 mL Ag NP dispersion and 20 mL acetone-dissolved pHA the volume was a little less than 40 mL on day 5. UV/Vis spectrum of the dispersion indicated the extinction at the peak (which was blue-shifted by as much as 5 nm from the day 0 spectrum) to be 0.79. Remarkably, upon dilution of the dispersion of day 5 to that of the original volume (to have the concentration as on day 0), by addition of a mixture of water and acetone, the extinction spectrum broadened as well as red-shifted in position to its original value (indicated as day 5 dil. in Fig. 1) i.e., due to the dispersion on day 0. Thus starting with the dispersion on day 0 the UV/Vis spectrum consisted of a broad peak with maximum at 439 nm, which narrowed and blue-shifted to 434 nm upon evaporation till day 5. This dispersion upon dilution led to a broader peak with the maximum at 438 nm. The observations suggested that the dielectric layer surrounding the Ag NPs changed upon evaporation of the solvent (causing line narrowing and blue-shift) which upon dilution reverted back to the original spectrum. That the SPR frequency of metal NPs can be tuned by coating with a dielectric material has been reported elsewhere.14,15 The small difference in the extinction spectrum of the original dispersion (day 0) and that of the diluted one (day 5) could be due to agglomeration of a few NPs during dilution. On the other hand, control experiments, involving recording of UV/Vis spectra of pHA-stabilized Ag NP dispersion in water only (being evaporated at 40 °C), showed no change in the line shape and position with time (Fig. S3†).
TEM analyses of the dispersion on day 0 (Fig. S4†) showed Ag NPs with no discernible change either in size or agglomeration in comparison to as-prepared NPs. Any minor difference could be due to evaporation of the dispersion during the sample preparation. On the other hand, TEM images of the dispersion on day 3 indicated formation of shell around the NPs (Fig. 2, S5†). It may be mentioned here that images recorded for samples earlier than day 3 consisted of depositions of smaller particles on the NPs. The shell formation was complete by day 3, although the thickness of the shell was not necessarily uniform. The typical shell thickness that could be observed was 2–8 nm, albeit thickness higher than these could also be observed. It is interesting to note that the shell formation could also be observed around particles of rod shape (Fig. 2b, S5b, S5f†) and the thicknesses around both axes of the rod were nearly uniform (with a maximum of 5 nm along the minor axis). There was the presence of individual particles with shells surrounding the NPs. In addition, there were also particles which were fused at the shells. They were present in the forms of dimers, trimers and higher agglomerated structures. On day 5, the shells appeared relatively thicker than that on day 3 (Fig. S6†). It was also observed that the coated Ag NPs existed more as clusters than as isolated ones. It is possible that the shell that was forming on the NPs led to their fusions. Further, dilution of the solution to original volume led to loss of shells from most of the particles, as is clear from Fig. S7†. It is important to remember that the original dispersion (day 0) consisted of Ag NPs, pHA and acetone. The above results indicated that upon evaporation pHA might have been deposited on the surface of the NPs to have formed shells. Since pHA is highly soluble in water (and acetone) thus upon dilution the shell structures were dissolved leading to primarily bare NPs (probably with a thin stabilizing layer of pHA). In addition, there was the presence of a few fused NPs which could have resulted during dilution. In other words, when the pHA shell was dissolved after addition of excess solvent, the NPs (at least some of them) might have lost their stabilizing pHA layer completely and thus were fused together due to resultant lowered surface energy. Further, in order to check if the pHA shells which appeared over Ag NPs were artifacts developed during the process of drying of the dispersion for TEM sample preparation, the concentrated dispersion on day 5 was centrifuged and the precipitate was then suspended in hexane. TEM investigation of the suspension clearly showed pHA shells surrounding Ag NPs (Fig. S8†), with no significant change with respect to the observations on the samples of day 3 or day 5.Thus pHA in water upon slow evaporation, in the presence of Ag NPs, resulted in the formation of core-shell structures consisting of NPs of Ag@pHA.
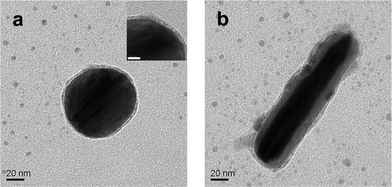 | ||
| Fig. 2 TEM images of Ag@pHA NPs: (a) spherical, and (b) rod-shaped. (Inset in (a) is its higher resolution image distinctly showing a thin pHA shell on the Ag NP; scale bar: 10 nm). | ||
XRD pattern of the sample, obtained after 5 days of evaporation followed by centrifugation, is shown in Fig. 3a. The pattern consisted of diffractions from (10![[1 with combining macron]](https://www.rsc.org/images/entities/char_0031_0304.gif) ), (101), (111), (022), (21
), (101), (111), (022), (21![[1 with combining macron]](https://www.rsc.org/images/entities/char_0031_0304.gif) ), (211), (131), (310), (30
), (211), (131), (310), (30![[3 with combining macron]](https://www.rsc.org/images/entities/char_0033_0304.gif) ) planes of the pHA crystals, corresponding to its monoclinic polymorphic form. In addition, there were peaks due to the presence of Ag, occurring at 38°, 44° and 64° corresponding to diffractions from the (111), (200) and (220) planes respectively of metallic Ag. It may be mentioned here that at around these positions of diffraction peaks there ought to be the presence of peaks due to pHA also.13 However, the broadness of the peaks at those angles indicated the presence of Ag NPs. Additionally, the diffraction patterns were in agreement with literature values for both pHA and Ag NPs (Fig. S9†). Further, SAED study of a particle imaged under TEM indicated the presence of crystalline pHA in addition to metallic Ag. The SAED pattern is shown in Fig. 3b. The presence of diffractions due to (022), (211), (310), (135) planes of pHA could be identified. In addition, diffractions from (111), (220) planes of metallic Ag could also be observed in the same image. Thus the electron diffraction results indicated the presence of crystalline pHA in the core-shell structures (in addition to, of course, Ag NPs). Overall, the above results indicated that a mixture of Ag NPs and pHA upon evaporation led to the formation of crystalline shells of pHA on the surface of the NPs.
) planes of the pHA crystals, corresponding to its monoclinic polymorphic form. In addition, there were peaks due to the presence of Ag, occurring at 38°, 44° and 64° corresponding to diffractions from the (111), (200) and (220) planes respectively of metallic Ag. It may be mentioned here that at around these positions of diffraction peaks there ought to be the presence of peaks due to pHA also.13 However, the broadness of the peaks at those angles indicated the presence of Ag NPs. Additionally, the diffraction patterns were in agreement with literature values for both pHA and Ag NPs (Fig. S9†). Further, SAED study of a particle imaged under TEM indicated the presence of crystalline pHA in addition to metallic Ag. The SAED pattern is shown in Fig. 3b. The presence of diffractions due to (022), (211), (310), (135) planes of pHA could be identified. In addition, diffractions from (111), (220) planes of metallic Ag could also be observed in the same image. Thus the electron diffraction results indicated the presence of crystalline pHA in the core-shell structures (in addition to, of course, Ag NPs). Overall, the above results indicated that a mixture of Ag NPs and pHA upon evaporation led to the formation of crystalline shells of pHA on the surface of the NPs.
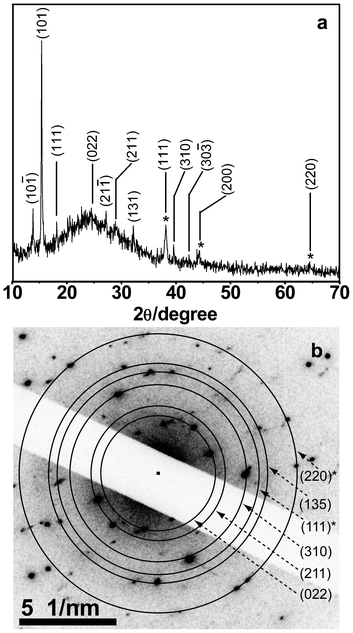 | ||
| Fig. 3 (a) XRD and (b) SAED patterns of Ag@pHA NPs (planes due to fcc Ag NP are marked with asterisk). The hump at around 2θ = 25° in (a) was due to the diffractions of the glass cover slip used for the preparation of sample. | ||
The formation of a crystalline layer of pHA surrounding the Ag NP was further confirmed by inverse fast Fourier transform (IFFT) image analysis of the TEM image of one such crystal. Fig. 4a shows high resolution TEM (HRTEM) of a particle consisting of shell. As is clear from the figure, the dark inner image is indicative of the presence of metallic Ag while the lighter outer shell is indicative of the organic moiety. Further, IFFT analysis of the image (Fig. 4b) clearly indicated the presence of lattice fringes of spacing equal to 0.56 nm. The lattice spacing (d) was assigned to the (101) plane of pHA. The fringes were present beyond the darker region and till the lighter region of the composite particle. The contiguous fringes clearly evidenced the complete encapsulation of Ag NPs by pHA crystals. It may be pointed out here that XRD results also indicated the growth of (101) plane as the major plane of growth. It is interesting to observe that while uniform spacing could be observed across the image, the bottom lighter part of the image indicated different contrast possibly due to height difference and the nature of materials. Thus the core-shell particles were formed in the medium consisting of pHA and Ag NPs and the outer shell consisted of crystalline pHA while the inner core was due to metallic Ag.
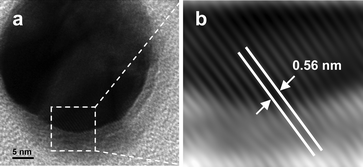 | ||
| Fig. 4 HRTEM image of (a) Ag@pHA NP and corresponding IFFT (b) of the select region in (a). | ||
Further, crystals were subjected to exposure of high energy electron beams in TEM, while the crystals were being imaged by the same beam. It was observed that exposure of the crystals to 200 kV beams being kept at higher resolution (400 kX) parameters for 5 min or longer led to melting of the same. It is already known that organic and other biological and non-conducting materials tend to melt or get damaged upon exposure to high energy electron beam.16Fig. 5i shows one such crystal (rod-shaped) at 80 kX amplification. As is clear from the figure the crystal consisted of core-shell rod. The core-shell nature could be observed further at 200 kX amplification (Fig. 5ii). On the other hand, at 400 kX magnification the outer shell of the crystal melted and the outer shell disappeared (Fig. 5iii). A better view of the melted crystal at 80 kX magnification (Fig. 5iv) again indicated that the entire outer shell of the crystal melted in the presence of the electron beam. The above observations clearly indicated the organic nature of the shell of the core-shell particle, substantiating the growth of organic shell (pHA crystal here) around the Ag NP/rod in the present experiments.
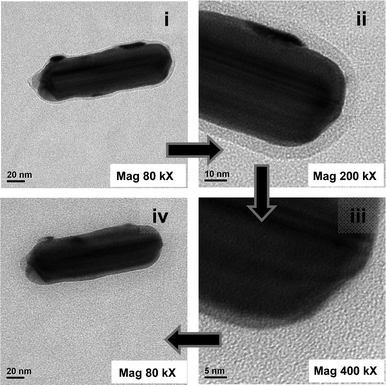 | ||
| Fig. 5 TEM images of an Ag@pHA NP at magnifications (i) 80 kX, (ii) 200 kX, (iii) 400 kX, and back to (iv) 80 kX. | ||
Additionally, electron diffraction studies of Ag@pHA NPs using an electron beam at a particular magnification and the same sample being observed after melting of the pHA shell (following exposure to electron beam at higher magnifications) resulted in the observations of change in the SAED pattern (Fig. 6). For instance, the SAED pattern obtained for the particle observed at 300 kX magnification (Fig. 6A1) consisted predominantly of diffractions from pHA crystal (Fig. 6A2), planes due to which are indexed as (022), (30![[3 with combining macron]](https://www.rsc.org/images/entities/char_0033_0304.gif) ), (15
), (15![[1 with combining macron]](https://www.rsc.org/images/entities/char_0031_0304.gif) ). On increasing the magnification further (∼500 kX), partial melting of pHA layer had occurred. Interestingly, recording the SAED pattern again at 300 kX magnification (Fig. 6B1) revealed the appearance of diffraction patterns due to fcc Ag NPs (marked with arrows), in addition to that due to pHA (Fig. 6B2).
). On increasing the magnification further (∼500 kX), partial melting of pHA layer had occurred. Interestingly, recording the SAED pattern again at 300 kX magnification (Fig. 6B1) revealed the appearance of diffraction patterns due to fcc Ag NPs (marked with arrows), in addition to that due to pHA (Fig. 6B2).
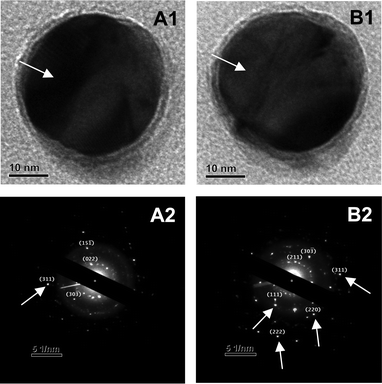 | ||
| Fig. 6 TEM images (A1, B1) and SAED patterns (A2, B2) of an Ag@pHA NP before (A1 and A2) and after (B1 and B2) melting experiments. (Arrows in A1 and B1 show the change in the contrast due to melting of pHA crystal on Ag NP, while those in A2 and B2 show the planes due to diffractions from fcc Ag NP.) The sample was collected from the medium on day 5. | ||
We were interested in understanding the mechanism of growth of the pHA crystal on the NPs. It was observed that presence of thinner shells could not be followed easily by TEM and hence growth of thicker shells was preferred. Thus the growth of organic moieties surrounding the NP/rod at shorter time of incubation indicated the presence of smaller crystals (of about 2 nm and above) attached to the NP/rod. The images are shown in Fig. 7. It appears that smaller (organic) particles were deposited on the surfaces of the Ag crystals in the beginning (lighter particles attached to the larger darker particles). It could be that these particles were first formed in the medium and were subsequently attached to the NP due to the inherent instability of the NPs. The presence of organic particles could also be observed in the TEM, meaning that there were independent organic particles (smaller) in the medium (also refer to Fig. 2, S5†). It has been reported that when an organic crystal is immersed in a medium in the presence of Au NPs the NPs get deposited over the crystal.17 This has been attributed to the high surface free energy of the NPs. The same may be the case here except for the fact the smaller organic crystals were deposited on the larger inorganic NP/rod. Once an initial layer of organic moieties was deposited on the NP/rod further growth of organic crystal could take place using the initially deposited crystals as the seed crystals. Thus a uniform layer of organic crystal grew around the NP/rod with longer time of incubation. It may be mentioned that the TEM images reported here consisted of large pHA crystals and thicker layers of the same on the NPs. On the other hand, the same could not be observed for thinner shells of crystals deposited on the NPs. It is plausible that still smaller crystals were first deposited on the NPs (which could not be observed under high energy beam) followed by growth of the crystalline layer. However, the uniform shell thickness of the thin layers also indicated growth of crystalline layers of pHA, akin to epitaxial growth, on the pHA layer stabilizing the NPs.
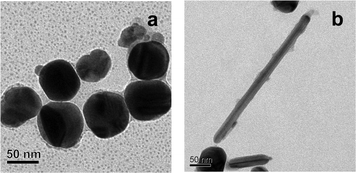 | ||
| Fig. 7 TEM images (a, b) showing the depositions/growth of pHA crystals over Ag NPs. The sample was collected from the medium prior to day 3 of evaporation. | ||
4. Conclusions
In conclusion, we have generated Ag@pHA core-shell NPs where the crystalline pHA layer was formed on the NPs. The formation of the crystalline shell of the organic moiety was established using XRD and TEM studies. The crystalline shell could be melted using electron beam of TEM. Results also indicated that smaller particles were first deposited on the NP, followed by growth of the complete crystalline shell. The change in the optical property of the Ag NPs upon the formation of crystalline pHA shell makes an interesting appeal for modification of optical properties of NPs by organic crystals. It is anticipated that this first report on the growth of an organic molecule as a crystalline shell over a metallic NP would usher newer avenues of organic-inorganic hybrid materials with tunable properties.Acknowledgements
We thank the Department of Biotechnology (BT/49/NE/TBP/2010), India for funds. S.D. thanks the Council of Scientific and Industrial Research (CSIR) for a fellowship (09/731(0063)/2008-EMR-I).References
- R. G. Chaudhuri and S. Paria, Chem. Rev., 2012, 112, 2373 CrossRef.
- B. Rodríguez-González, A. Burrows, M. Watanabe, C. J. Kiely and L. M. Liz-Marzán, J. Mater. Chem., 2005, 15, 1755 RSC.
- L. Wang, J. Luo, Q. Fan, M. Suzuki, I. S. Suzuki, M. H. Engelhard, Y. Lin, N. Kim, J. Q. Wang and C.-J. Zhong, J. Phys. Chem. B, 2005, 109, 21593 CrossRef CAS.
- W. Lu, B. Wang, J. Zeng, X. Wang, S. Zhang and J. G. Hou, Langmuir, 2005, 21, 3684 CrossRef CAS.
- X. Peng, M. C. Schlamp, A. V. Kadavanich and A. P. Alivisatos, J. Am. Chem. Soc., 1997, 119, 7019 CrossRef CAS.
- L. Zhang, D. A. Blom and H. Wang, Chem. Mater., 2011, 23, 4587 CrossRef CAS.
- H. A. Clark, P. J. Campagnola, J. P. Wuskell, A. Lewis and L. M. Loew, J. Am. Chem. Soc., 2000, 122, 10234 CrossRef CAS.
- S. Mukherjee, H. Sobhani, J. B. Lassiter, R. Bardhan, P. Nordlander and N. J. Halas, Nano Lett., 2010, 10, 2694 CrossRef CAS.
- A. Longo, G. Carotenuto, M. Palomba and S. D. Nicola, Polymers, 2011, 3, 1794 CrossRef CAS.
- A. K. Sahoo, M. P. Sk, S. S. Ghosh and A. Chattopadhyay, Nanoscale, 2011, 3, 4226 RSC.
- P. C. Lee and D. Meisel, J. Phys. Chem., 1982, 86, 3391 CrossRef CAS.
- Y. Cao, R. Jin and C. A. Mirkin, J. Am. Chem. Soc., 2001, 123, 7961 CrossRef CAS.
- S. Das, A. K. Sahoo, S. S. Ghosh and A. Chattopadhyay, Langmuir, 2010, 26, 15714 CrossRef CAS.
- L. M. Liz-Marzán, M. Giersig and P. Mulvaney, Langmuir, 1996, 12, 4329 CrossRef.
- W. Shi, H. Zeng, Y. Sahoo, T. Y. Ohulchanskyy, Y. Ding, Z. L. Wang, M. Swihart and P. N. Prasad, Nano Lett., 2006, 6, 875 CrossRef CAS.
- L. Reimer, Transmission electron microscopy. Physics of image formation and microanalysis. Berlin, Heidelberg, New York, Tokyo: Springer-Verlag Press, 1993, pp. 431-463 Search PubMed.
- Y. Fujiki, N. Tokunaga, S. Shinkai and K. Sada, Angew. Chem., Int. Ed., 2006, 45, 4764 CrossRef CAS.
Footnote |
| † Electronic Supplementary Information (ESI) available: See DOI: 10.1039/c2ra21264a |
| This journal is © The Royal Society of Chemistry 2012 |
