Graphene/SnO2/polypyrrole ternary nanocomposites as supercapacitor electrode materials
Wenjuan
Wang
,
Qingli
Hao
*,
Wu
Lei
,
Xifeng
Xia
and
Xin
Wang
*
Key Laboratory for Soft Chemistry and Functional Materials, Nanjing University of Science and Technology, Ministry of Education, Nanjing, China. E-mail: haoqingli@yahoo.com; wangx@mail.njust.edu.cn; Fax: +86-025-84315054; Tel: + 86-025-84315943
First published on 31st August 2012
Abstract
A ternary electrode material, based on graphene, tin oxide (SnO2) and polypyrrole (PPy) was obtained via one–pot synthesis. The graphene/SnO2/PPy (GSP) nanocomposite is composed of a thin conducting film of PPy on the surface of graphene/SnO2 (GS). An enhanced specific capacitance (616 F g−1) of GSP was obtained at 1 mV s−1 in 1 M H2SO4 compared with GS (80.2 F g−1) and PPy (523 F g−1). The GSP electrode shows better cycle stability and no obvious decay after 1000 galvanostatic cycles at 1 A g−1. Its specific power density and energy density can reach 9973.26 W kg−1, and 19.4 W h kg−1, respectively. The excellent electrochemical performance arises from the well-designed structure advantages, the good combination of components and the synergistic effect between the three components. Well-dispersed graphene is used as a framework for sustaining the pseudocapacitive materials of SnO2 and PPy. The PPy film restricts the aggregation and volume change of SnO2 during charge–discharge cycling, and also enhances the surface area. The electrochemical results show that the ternary composite of GSP is a promising candidate electrode material for high-performance supercapacitors.
1. Introduction
Low cost, environmentally friendly and renewable energy materials as well as their devices are being intensively pursued owing to the diminishing supply of fossil fuels and climate change.1 Consequently, there has been an increasing demand for sustainable and renewable energy resources. Supercapacitors, also known as electrochemical capacitors with the advantages of high power density, light weight, small size, long cycling life, are considered to be one of the most-promising energy-conversion/storage systems to fulfill future energy-storage needs.2 Nowadays, the hot research on supercapacitors is aimed at increasing specific power and energy densities as well as lowering fabrication costs while using environmentally friendly materials.3,4 Therefore, electrode materials are the primary factor for the electrochemical performance of supercapacitors. However, carbon materials, for example graphene, which have high specific surface area and cycle stability, exhibit a large and stable double layer capacitance, but easy agglomeration and stacking limit its application in high energy density supercapacitors. Conducting polymers and transition metal oxides are two kinds of typical pseudocapacitive materials, which are capable of storing more charges than carbon materials, but are limited by their poor stability and high resistance during cycling.5,6 Thus, the combination of any two materials mentioned above has become a promising solution recently for improvement of the electrochemical performance of supercapacitors.7–9 Among these, the graphene-based binary composites have attracted considerable interest due to their unique properties and their enhanced electrochemical performance with a synergetic effect between the conducting polymers and metal oxides,10–13 and plenty of such binary composites have been reported.14–17 However, to date, ternary composites based on graphene, metal oxides, and conducting polymers have seldom been reported for use as supercapacitors.18 Very recently, our group19 has reported a ternary composite of graphene/MoO3/polyaniline with a high energy density obtained via a one-step method for use as supercapacitors. So the study of graphene based ternary composites in the field are at a primary stage, more ideas and challenges will be needed for progress to be made.SnO2, as a transparent semiconductor has attracted much attention due to its unique properties such as high optical transparency, electrical conductivity, high theoretical capacity (calculated to be 782 mA h g−1), and low cost.20,21 To date, there are a few reports about graphene/SnO2 composites with widespread availability in electrochemical energy storage such as lithium-ion batteries22,23 or supercapacitors.21 However, the low conductivity and poor stability usually necessitate adding conductive phases to enhance electron transport. Polypyrrole (PPy) is a promising electrode material with high energy storage capacity and good electrical conductivity for supercapacitors due to unusual doping/dedoping processes, simple synthesis and stability in ambient air.14,24
In this study, a novel ternary nanocomposite, graphene/SnO2/PPy (GSP) has been fabricated via a one-pot synthesis method. The chemical reduction of graphene oxide (GO) and the generation of SnO2 commenced firstly, and then the PPy film was coated on the surface of graphene/SnO2 (GS) via in-suit polymerization. SnO2 and PPy were introduced to hold back the aggregation of the graphene sheets and to simultaneously increase the electrochemical performance which is much higher than that of GS or PPy, especially the remarkable cycling stability, due to the synergetic effect among the three components.
2. Experimental section
All chemicals (purchased from Shanghai Chemical Co.,Ltd.) used in this experiment were analytical grade and were used without further purification. All aqueous solutions were prepared with ultrapure water (>18 MΩ) from a Milli-Q Plus system (Millipore).2.1 Synthesis of graphene/SnO2/polypyrrole (GSP) nanocomposites
GO was prepared from powdered flake graphite (12![[thin space (1/6-em)]](https://www.rsc.org/images/entities/char_2009.gif) 500 mesh) by the modified Hummers method,25 and used as the precursor of graphene. A one-pot synthesis method was designed for the fabrication of GSP. Firstly, GO was dispersed in distilled water (1 mg mL−1) by ultrasonication for 1 h to get an exfoliated yellow–brown GO suspension. Subsequently, 0.5 g of SnCl2·2H2O was added into the GO suspension under stirring for 6 h to get a black GS solution. The equation can be expressed as follows:
500 mesh) by the modified Hummers method,25 and used as the precursor of graphene. A one-pot synthesis method was designed for the fabrication of GSP. Firstly, GO was dispersed in distilled water (1 mg mL−1) by ultrasonication for 1 h to get an exfoliated yellow–brown GO suspension. Subsequently, 0.5 g of SnCl2·2H2O was added into the GO suspension under stirring for 6 h to get a black GS solution. The equation can be expressed as follows:| SnCl2 + GO + H2O → SnO2 + graphene + 2HCl |
Then 0.5 mL pyrrole was slowly added. The mixture was stirred for 2 h, followed by drop-wise addition of 10 mL aqueous solution containing 1.5 g ammonium persulfate (APS). After stirring in an ice bath for 4 h, the GSP nanocomposite was filtrated and washed with ethanol, water and dried at 60 °C under a vacuum. For comparison, the composite graphene/PPy without SnO2 (GP) was also synthesized. Firstly, graphene was obtained by reducing GO with hot sodium hydroxide. Subsequently, the GP was synthesized by the in situ polymerization of pyrrole with ammonium persulfate and hydrochloric acid was used as the initiator and doping agent, respectively, in the presence of graphene.
2.2 General characterization
Powder X-ray diffraction (XRD) analyses were performed on a Bruker D8 Advance diffractometer with Cu–Kα radiation (λ = 1.5406 Å). The diffraction data were recorded for 2θ angles between 5° and 80°. Raman spectra were recorded from 100 to 4000 cm−1 on a Renishaw Invia Raman Microprobe using a 514.5 nm argon ion laser, respectively. Fourier transform infrared spectrometry (FT-IR) was carried out using a Bruker Vector 22 and KBr pellets. Morphology analyses of samples were carried out with a JEOL JEM-2100 transmission electron microscope (TEM), energy dispersive spectroscopy (EDX) and scanning electron microscopy (SEM, HITACHI S-4800).2.3 Electrochemical characterization
The working electrodes were fabricated by mixing the as-prepared composite, acetylene black, and polytetrafluoroethylene (1% wt) with a mass ratio 85![[thin space (1/6-em)]](https://www.rsc.org/images/entities/char_2009.gif) :
:![[thin space (1/6-em)]](https://www.rsc.org/images/entities/char_2009.gif) 10
10![[thin space (1/6-em)]](https://www.rsc.org/images/entities/char_2009.gif) :
:![[thin space (1/6-em)]](https://www.rsc.org/images/entities/char_2009.gif) 5. The mixture was ground adequately to form a slurry, then was coated onto stainless steel, pressed at 10 MPa, and dried under vacuum at 60 °C for 24 h.26 All electrochemical experiments were carried out in 1 M H2SO4 using a three electrode system, in which platinum foils and a saturated calomel electrode (SCE) were used as counter and reference electrodes. Cyclic voltammetry (CV) and electrochemical impedance spectroscopy (EIS) measurements were performed with a CHI760C workstation. The scan rates of CV were in the range from 1 mV s−1 to 100 mV s−1. EIS was recorded under the following conditions: AC voltage amplitude 5 mV, frequency range 1 × 10⁵ to 1 × 10⁻³ Hz at 0.4 V. Galvanostatic charge–discharge testing was done from −0.2 to 0.5 V in H2SO4 using a Land Battery workstation at 22 °C.
5. The mixture was ground adequately to form a slurry, then was coated onto stainless steel, pressed at 10 MPa, and dried under vacuum at 60 °C for 24 h.26 All electrochemical experiments were carried out in 1 M H2SO4 using a three electrode system, in which platinum foils and a saturated calomel electrode (SCE) were used as counter and reference electrodes. Cyclic voltammetry (CV) and electrochemical impedance spectroscopy (EIS) measurements were performed with a CHI760C workstation. The scan rates of CV were in the range from 1 mV s−1 to 100 mV s−1. EIS was recorded under the following conditions: AC voltage amplitude 5 mV, frequency range 1 × 10⁵ to 1 × 10⁻³ Hz at 0.4 V. Galvanostatic charge–discharge testing was done from −0.2 to 0.5 V in H2SO4 using a Land Battery workstation at 22 °C.
3. Results and discussion
Fig. 1a demonstrates the XRD patterns of GO, GS, pure PPy and GSP. The feature diffraction peak of GO appears at 10.7° corresponding to its (002) facet. With comparison, the disappearance of this peak in the curves of GS and GSP indicates the successful reduction and exfoliation of GO. And all the characteristic diffraction peaks of GS and GSP can be assigned to the tetragonal structure of SnO2 (JCPDS card no. 41-1445). No obvious peaks corresponding to SnO were found for GS and GSP revealing that the SnO2 nanoparticles are generated simultaneously while the Sn2+ ions reduce GO to graphene. Also no peaks of graphite at 26.6° were observed in the GS and GSP, suggesting that the agglomeration of graphene sheets is successfully inhibited by SnO2 nanoparticles present on their surfaces and well-dispersed in the composites. A broad characteristic peak of amorphous PPy appears at about 26°, which may be integrated with SnO2 in the GSP ternary composites.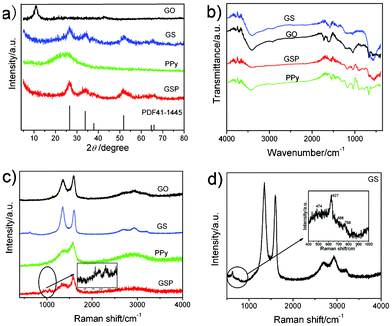 | ||
| Fig. 1 (a) XRD patterns of the as-prepared products GO, GS, PPy, GSP and PDF41-1445; (b) FTIR and (c) Raman spectra of GO ,GS, PPy and GSP; (d) Raman spectrum of GS in detail. | ||
In order to assess the reduction of GO and the formation of composites, FT-IR spectra of various samples were recorded (Fig. 1b). The FT-IR spectrum of GO shows the presence of various oxygen-containing groups. A broad characteristic peak at 3416 cm−1 is present corresponding to –OH. And the peaks at 1725 cm−1 and 1045 cm−1 are assigned to carboxy (COOH) and epoxide (C–O–C) respectively, and the peak at 1608 cm−1 is due to the contributions from the skeletal vibrations of unoxidized graphitic domains or the remaining sp2 carbon character of graphite.27 However, in the case of GS and GSP, most of oxygen-containing groups decrease or disappear, which demonstrates that GO can be reduced by Sn2+. The FT-IR study confirms the formation of SnO2 with a characteristic vibration mode of Sn–O at 579 cm−1. For PPy, a broad band at 3000–3500 cm−1 describes N–H and C–H stretching vibrations. The characteristic peaks of PPy are located at 1551 cm−1 and 1462 cm−1 and may be assigned to typical PPy ring vibrations (C–C and C–N) indicating the presence of large conjugation. The peak of GSP centered at about 908 cm−1 can be attributed to the bipolaron state of PPy,28,29 which is due to the antisymmetric and symmetric ring-stretching modes, respectively.30 Therefore, FT-IR results ascertain the presence of SnO2 and PPy in the ternary GSP nanocomposite.
The significant structural changes from GO to GSP are also reflected in the Raman spectra (Fig. 1c). The broad peaks at 1352 cm−1 and 1590 cm−1, are ascribed to the D and G peaks of GO or graphene respectively.31 The D peak is associated with the disorder of graphene and the G peak corresponds to ordered sp2-bonded carbon atoms, so the intensity ratio of D to G is related to the density of defects in the graphene-based composites.32 The increase of D/G ratio from 0.85(GO) to 1.13(GS) suggests that GO is reduced and more defects have been doped into the GS composites. However, compared with those of GO, GS and PPy, the intensity ratio of the two peaks decreases down to 0.65 for GSP due to the integration of C–C in-plane deformation (1310–1400 cm−1) and C![[double bond, length as m-dash]](https://www.rsc.org/images/entities/char_e001.gif) C backbone stretching (1579 cm−1) of PPy. It may meliorate the disordered structure of graphene,33,34 leading to the better electronic properties of GSP. This explanation can be further confirmed by the results of electrochemical tests. Furthermore, the presence of bands in the region of 988–1081 cm−1 clearly indicate the presence of PPy in the GSP ternary composite.35,36 The clear Raman spectrum of GS and its partially magnified spectrum can be observed in Fig. 1d in the region of 600–800 cm−1, three other peaks are observed at 627, 688 and 768 cm−1, respectively, corresponding to the A1g, A2u and B2g vibration modes of SnO2 nanoparticles.37 Additionally, the peaks at about 2695 cm−1, 2934 cm−1 and 3203 cm−1 can be ascribed to 2D, D + G and 2D′ modes respectively. And the 2D peak can be used to distinguish graphene from other carbon materials in Raman spectra which is the characteristic peak of graphene.38
C backbone stretching (1579 cm−1) of PPy. It may meliorate the disordered structure of graphene,33,34 leading to the better electronic properties of GSP. This explanation can be further confirmed by the results of electrochemical tests. Furthermore, the presence of bands in the region of 988–1081 cm−1 clearly indicate the presence of PPy in the GSP ternary composite.35,36 The clear Raman spectrum of GS and its partially magnified spectrum can be observed in Fig. 1d in the region of 600–800 cm−1, three other peaks are observed at 627, 688 and 768 cm−1, respectively, corresponding to the A1g, A2u and B2g vibration modes of SnO2 nanoparticles.37 Additionally, the peaks at about 2695 cm−1, 2934 cm−1 and 3203 cm−1 can be ascribed to 2D, D + G and 2D′ modes respectively. And the 2D peak can be used to distinguish graphene from other carbon materials in Raman spectra which is the characteristic peak of graphene.38
The morphologies of GO, GS and GSP are observed by TEM, high resolution TEM (HRTEM) and FESEM in Fig. 2. The TEM image of GO shows its transparent sheets and smooth surface (Fig. 2a). However, the images of GS and GSP exhibit quite different morphology due to the growth of SnO2 and PPy nanoparticles on graphene sheets. The presence of tiny SnO2 nanoparticles homogeneously distributed on the graphene is clearly observed as black dots in Fig. 2b for GS. The results indicate that the SnO2 nanoparticles can be uniformly distributed on GO through the relatively strong interaction (electrostatic binding or charge transfer) between GO and SnO2 nanoparticles.39 The insert in Fig. 2b reveals that the average particle size of SnO2 can be determined to be about 4 nm, which is in accordance with the broad diffraction peaks of the XRD patterns in Fig. 1a.
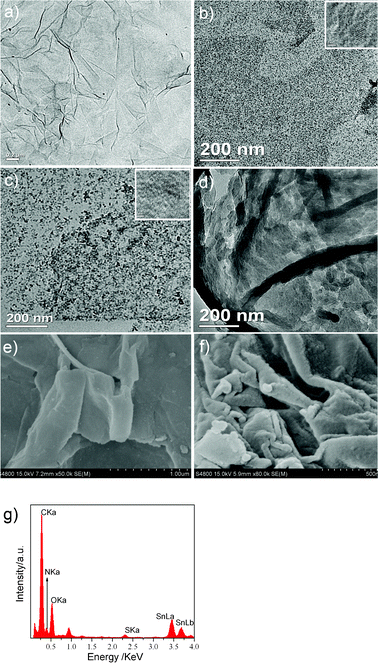 | ||
| Fig. 2 TEM images of GO(a), GS(b), GSP(c) (insets are the HRTEM image of GS and GSP), and GP(d); FESEM images of GS (e) and GSP (f); EDX date of GSP(g). | ||
While, it is noted that the appearance of GSP (Fig. 2c) is evidently different from GS, and fewer black dots are observed in its TEM image due to PPy coating on the surface of GS. And the HRTEM image of GSP confirms the dark dots result from the existence of SnO2 nanoparticles. It also can be observed that PPy on graphene without SnO2 nanoparticles distributes poorly and mainly forms aggregates on graphene sheets (Fig. 2d). The result implies that SnO2 nanoparticles play a critical role in promoting the uniform distribution of PPy on the graphene surface. By comparison with the FESEM images of samples, we can obverse that the tiny SnO2 nanoparticles and PPy are distributed on the curly graphene nanosheets, and the anchoring nanoparticles can act as a spacer to prevent the re-stacking of individual graphene nanosheets meantime. The thickness and roughness of GS and GSP are different owing to the PPy layer. Furthermore, the data of EDX spectroscopy (Fig. 2g) confirm the presence of Sn, C, O and N in the GSP composites, which agree well with the result of FTIR and further explain the formation of GSP composites.
XPS was carried out to further investigate the surface composition and the chemical states of the species in the ternary nanocomposites. Curve fittings assumed the standard non-Shirley background subtraction, and used component peaks based on 80% Gaussian and 20% Lorentzian shape. From Fig. 3a, the existence of carbon, nitrogen, oxygen and tin in the GSP ternary nanocomposites can be evidently observed, no other hetero elements are detected, which is consistent with the EDX analysis mentioned above. The XPS of GSP also provides the content of elements: C 64.9%, O 18.2%, N 14.3% and Sn 2.6%, and the presence of N and Sn is attributed to PPy and SnO2 receptively. The Sn 3d spectrum is shown in Fig. 3b. Two symmetrical peaks at 486.2 eV and 494.7 eV are attributable to Sn 3d5/2 and Sn 3d3/2, respectively, which are in good agreement with the energy splitting of the standard spectrum of SnO2.21 The peak-to-peak separation between the Sn 3d 5/2 and Sn 3d 3/2 level is 8.5 eV, and the area ratio of the two peaks is about 1.5, which are approximately the same values as those reported in the XPS spectrum of SnO2.40 Moreover, there is no peak assigned to other chemical states of Sn, confirming the formation of SnO2 nanoparticles on the surface of GO, which is consistent with the results of XRD. Fig. 3c presents the N1s XPS core level spectrum of GSP indicating the existence of several structures. The N1s originated from PPy can be deconvoluted into three Gaussian peaks with the binding energy of 398.3 ,400.1 and 401.2 eV, related to the imine-like structure (–C![[double bond, length as m-dash]](https://www.rsc.org/images/entities/char_e001.gif) N–), the neutral and amine-like structure (–NH–) and positively charged structure (–NH+–).41
N–), the neutral and amine-like structure (–NH–) and positively charged structure (–NH+–).41
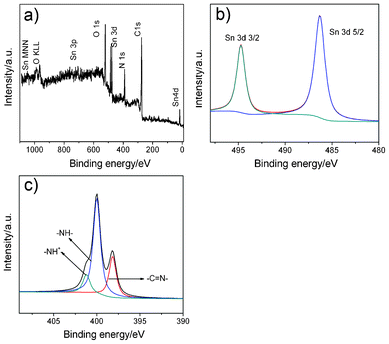 | ||
| Fig. 3 XPS spectra of the GSP nanocomposites (a); Sn 3d (b) and N 1 s (c) XPS spectra of GSP. | ||
The C 1s core-level spectra can detect the constitutional change of GO before and after its reduction. Fig. 4a and 4b display the high-resolution spectra of the C 1s region of GO and GSP nanocomposites, respectively. The XPS spectrum of C 1s for GO is deconvoluted into four components corresponding to carbon atoms in different oxygen-containing functional groups with binding energies at about 284.7, 286.8, 287.8, and 289.2 eV, attributable to the C–C, C–OH, C![[double bond, length as m-dash]](https://www.rsc.org/images/entities/char_e001.gif) O and O–C
O and O–C![[double bond, length as m-dash]](https://www.rsc.org/images/entities/char_e001.gif) O species, respectively.42 In Fig. 4b, the four types of carbon species can still be seen in the GSP, but the intensities of the components associated with oxygenated functional groups decreased markedly, indicating the reduction of GO with Sn2+. In addition, there is an additional peak at 285.2 eV corresponding to the C–N bonds of PPy.35 Moreover, the intensity for C–C is higher than that of GO due to the presence of PPy coated on the both sides of GS. The results confirm the formation of PPy.
O species, respectively.42 In Fig. 4b, the four types of carbon species can still be seen in the GSP, but the intensities of the components associated with oxygenated functional groups decreased markedly, indicating the reduction of GO with Sn2+. In addition, there is an additional peak at 285.2 eV corresponding to the C–N bonds of PPy.35 Moreover, the intensity for C–C is higher than that of GO due to the presence of PPy coated on the both sides of GS. The results confirm the formation of PPy.
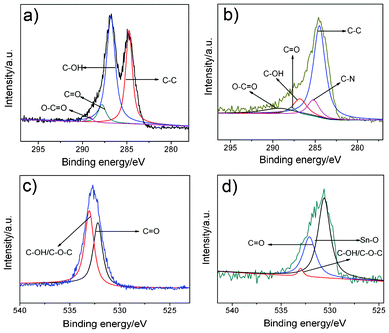 | ||
| Fig. 4 XPS C 1 s core-level spectra of (a) GO and (b) GSP. O 1 s of (c) GO (d) GSP, respectively. | ||
The O 1s XPS spectrum of GO is illustrated in Fig. 4c, which is deconvoluted into two peaks. The peaks at 532.2 and 533.1 eV are ascribed to C![[double bond, length as m-dash]](https://www.rsc.org/images/entities/char_e001.gif) O and C–O–C/C–OH of GO, respectively. Due to the low reducibility of Sn2+, there are still small amounts of residual oxygenated groups left which are also observed in Fig. 4d. The presence of SnO2 can also be further confirmed by the O 1s XPS peak at 530.8 eV (Fig. 4d), which corresponds to the typical binding energy of Sn–O bond.43 However, the remaining small amount of oxygenated groups help to maintain highly dispersed SnO2 nanocrystals on graphene sheets through hydrogen bonding and electrostatic attraction.
O and C–O–C/C–OH of GO, respectively. Due to the low reducibility of Sn2+, there are still small amounts of residual oxygenated groups left which are also observed in Fig. 4d. The presence of SnO2 can also be further confirmed by the O 1s XPS peak at 530.8 eV (Fig. 4d), which corresponds to the typical binding energy of Sn–O bond.43 However, the remaining small amount of oxygenated groups help to maintain highly dispersed SnO2 nanocrystals on graphene sheets through hydrogen bonding and electrostatic attraction.
Fig. 5a reveals the CV curves of GS, PPy and GSP electrode materials in 1 M H2SO4 at 10 mV s−1. The CV curves for GS indicate that its specific capacitance is attributed to EDL capacitance and pseudocapacitance, and the dominated EDL capacitance leads to the roughly rectangular CV curve. The larger area of the closed CV loop of the GSP electrode indicates that its specific capacitance is higher than those of GS and PPy. A pair of broad redox peaks (the oxidation peak at about +0.25 V and the reduction peak at about 0.03 V) appearing in a similar rectangular CV of GSP mean that the capacitance of GSP not only possesses EDL capacitance, but also exhibits apparent pseudocapacitance from PPy and SnO2. It reveals that the as-obtained electrode material combines simultaneously two kinds of energy storage mechanisms EDL and Faradaic capacitance.
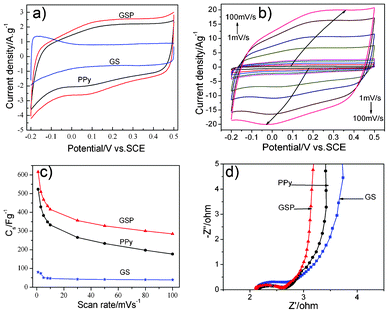 | ||
| Fig. 5 CV curves of GS, PPy and GSP at 10 mV s−1 (a); different scan rates of GSP in 1 M H2SO4 (b); capacitance values of GS, PPy and GSP against scan rates calculated by CV curves (c); EIS of GS, PPy and GSP in 1 M H2SO4 (d). | ||
CV curves of GSP composite in 1 M H2SO4 at various scan rates (at 1, 3, 5, 8, 10, 30, 50, 80, 100 mV s−1 respectively) are shown in Fig. 5b. Notablely, all the curves show a similar rectangular shape with redox peaks. The redox peaks shift with the increment of scan rates, indicative of EDL capacitive behavior and good ion response.15,36 The high currents of the CV curves mean that the electrode materials show high conductivity and low internal resistance. Moreover, the current swell with increasing scan rate means that there is a good rate capability for GSP in 1 M H2SO4, which may be due to efficient combination of the three kinds of electrode materials and the synergistic effect between components in the ternary-nanostructured GSP composite.
The specific capacitance (C, F g−1) of the electrode can be calculated according to the following equation from the CV curves
 | (1) |
Fig. 5c shows the change trends of C of PPy, GS and GSP as the scan rate increases from 1 to 100 mV s−1. For all the composites, the specific capacitance decreases with an increase in the scan rate. It is noted that the C of GSP decreases swiftly from 1 to 10 mV s−1, and then decreases slowly from 10 to 100 mV s−1. The results show that GSP achieves a maximum capacitance of 616 F g−1, which is higher than those of GS (80.2 F g−1) and PPy (523 F g−1) at 1 mV s−1. By further increasing the scan rate to 10 mV s−1, the C value of GSP remains as high as 416 F g−1, which is significantly higher than that for GS and PPy (46 F g−1, 332 F g−1). So the GSP electrode shows not only high capacitance but also better rate capability due to the synergistic effect of each of the components. The decrease phenomenon in C is because the presence of inner active sites cannot sustain the redox transition completely at higher scan rates.
EIS is a useful technique for the analysis of electrochemical property. The ideal Nyquist impedance plot is composed of a half semicircle at high frequency and a line at low frequency. Fig. 5d gives the Nyquist plots of GS, PPy and GSP tested in 1 M H2SO4. At high frequency region, a small arc is observed which is related to the process at the electrode material–electrolyte interface; and the low frequency region indicates a capacitive behavior related to the charging mechanism. High frequency intercepts of the real axis, which are related to the electrolyte resistances, are almost the same for the three samples. In the high-to-middle frequency region, the semicircle with the least diameter of about 0.5 Ω is observed for GSP, which means the low resistance of the ternary composite. Compared to GSP, PPy has a slightly larger diameter, while GS shows the largest diameter of the semicircle, which indicates a biggish electron transfer resistance due to the poor conductivity of SnO2. On the other hand, as observed in Fig. 5d, it is observed that the straight line of GSP is more close to 90° compared with GS and PPy in the low frequency range, suggesting that the ternary composite of GSP has a better capacitive behavior than the pure PPy and binary GS. The EIS results indicate that GSP possesses a lower charge transfer resistance and better capacitive behavior compared with that of PPy or GS, which is consistent with the outcomes of the CV tests. These characteristics may be due to the synergistic effects and the ideal combination of the three components, which can lead to a better capacitive performance for supercapacitors.
Galvanostatic charge/discharge is a reliable method for evaluating the electrochemical performance of electrode materials under controlled current conditions. Fig. 6a shows the galvanostatic charge/discharge curves of GS, PPy and GSP for the first cycle at a current density of 0.1 A g−1. For the GS electrode, its charge/discharge curve exhibits a symmetrical triangular shape, implying that its capacitance is mainly ascribed to EDL capacitance, in agreement with the results obtained by CV of GS in Fig. 5a. While a deviation from a symmetrical triangular shape in the curves of GSP reveals the combination of EDL capacitance with Faradaic capacitance for GSP electrode materials. The discharge time of the GSP electrode extends as long as 2000 s, which demonstrates a higher capacitance. Fig. 6b depicts the galvanostatic charge/discharge curves of GSP at different current densities. Evidently, the discharge time of GSP decreases with an increase in current density. It can also be seen that the GSP electrode not only exhibits EDL capacitance but also Faradaic capacitance.
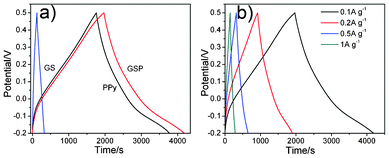 | ||
| Fig. 6 Galvanostatic charge/discharge curves of GS, PPy and GSP at current density of 0.1 A g−1 (a); galvanostatic charge/discharge curves of GSP at different current density (b). | ||
To the best of our knowledge, electrochemical stability is also a key requirement for evaluating supercapacitors.
The variation of specific capacitance of GS, PPy and GSP as a function of cycle number is presented in Fig. 7a. Furthermore, the specific capacitance of the GSP electrode is higher than that of PPy and GS under the same current density, which can be easily found from Fig. 7a, and can be calculated according to eqn (2).
 | (2) |
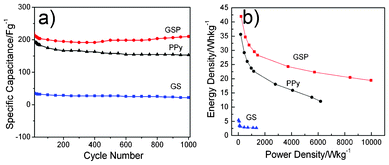 | ||
| Fig. 7 Variation of specific capacitance of GS, PPy and GSP at current density of 1 A g−1 in 1 M H2SO4 (a); Ragone plots of GS, PPy and GSP in 1 M H2SO4 at scan rates of 1, 3, 5, 8, 10, 30, 50, 80 and 100 mV s−1(b). | ||
The electrodes based on GS, PPy and GSP were subjected to 1000 cycles at the same current density of 1 A g−1. The specific capacitance of the ternary GSP composite is the highest due to the synergistic effect of GS and PPy. After 1000 cycles, the GSP electrode still retains 98% of specific capacitance as compared to the initial capacitance. More interestingly, the repeated tests show that the stability of GSP becomes better and better after long-time cycling. The fluctuation of the capacitance retain may be attributed to the activation of the electrode materials. The active process will be more complete with the circulations, resulting in an increase in the active points of the electrode materials, and hence an enhancement of the specific capacitance compared to the initial circulations. The results indicate that the GSP electrode has long-term electrochemical stability at such a high current density. The synergistic effect among the three components plays an important role in the better cycle stability of GSP. The inner layer of the well-dispersed graphene enhances the mechanical strength of the GSP nanocomposites avoiding the destruction of the electrode material and is beneficial for better stability. This could be due to unknown interactions among the components. The mechanism is still under investigation.
Energy density is a critical factor for evaluating the practical application of the as-prepared composites as supercapacitor electrodes. The energy density and power energy are calculated by CV curves at different scan rates using eqn (3).
 | (3) |
Ragone plots of GS, PPy and GSP are presented in Fig. 7b. Compared with GS and PPy, the ternary composite GSP is more suitable as a supercapacitor as it has a high energy and power density. Its energy density is estimated to be 19.4 W h kg−1 at a high power density of 9973.26 W kg−1, and about 31.2 W h kg−1 at a power density of 818.2 W kg−1 in 1 M H2SO4, revealing the decrease in energy density of the electrode material with an increase in power density. Compared with GSP, the energy density of GS is only 2.7 W h kg−1, while the power density is 1366 W kg−1 calculated at 100 mV s−1. It indicates that the ternary composite of GSP shows a better application potential in the high power and energy devices.
4. Conclusions
In summary, a novel ternary graphene/SnO2/PPy composite as a supercapacitor electrode has been prepared by a one-pot synthesis method. The GSP electrode exhibits a higher specific capacitance, better rate performance and extraordinary cycling stability at 1 A g−1. The excellent electrochemical performance of the ternary composites as supercapacitor electrodes is due to the synergistic effects among the components in the composites. Taking the higher capacitance, lower cost, higher energy and power into consideration, the GSP composite could be applicable for the fabrication of inexpensive, high-performance electrochemical supercapacitors. Moreover, its design strategy is general for the fabrication of other similar ternary composites based on carbon materials, conducting polymers, and metal oxides. The study suggests that such a ternary composite exhibits superior electrochemical stability, and shows promise for application in energy storage devices or power output technologies in the future.Acknowledgements
This work was supported by the National Natural Science Foundation of China (NSFC) (No. 21073092, 21103092), DFSR (No A2620110010), the Science and Technology Support Plan of Jiangsu Province, China (No. BE2011835), the Excellent Plan Foundation of NUST (2008) and the Department of Education of Jiangsu Province, and PAPD.References
- B.-L. Su, Q. Zhang, D. Bonifazi and J. Li, ChemSusChem, 2011, 4, 1327 Search PubMed.
- C. Liu, F. Li, L.-P. Ma and H.-M. Cheng, Adv. Mater., 2010, 22, E28 CrossRef CAS.
- L. L. Zhang, R. Zhou and X. S. Zhao, J. Mater. Chem., 2010, 20, 5983 RSC.
- R. Kötz and M. Carlen, Electrochim. Acta, 2000, 45, 2483 CrossRef CAS.
- A. Ghosh and Y. H. Lee, ChemSusChem, 2012, 5, 480 Search PubMed.
- S. Bose, T. Kuila, A. K. Mishra, R. Rajasekar, N. H. Kim and J. H. Lee, J. Mater. Chem., 2012, 22, 767 RSC.
- Y. Hou, Y. Cheng, T. Hobson and J. Liu, Nano Lett., 2010, 10, 2727 CrossRef.
- Z. Tang, C.-h. Tang and H. Gong, Adv. Funct. Mater., 2012, 22, 1272 CrossRef CAS.
- H. Lee, H. Kim, M. Cho, J. Choi and Y. Lee, Electrochim. Acta, 2011, 56, 7460 Search PubMed.
- M. Pumera, Chem. Soc. Rev., 2010, 39, 4146 RSC.
- Y. Sun, Q. Wu and G. Shi, Energy Environ. Sci., 2011, 4, 1113 RSC.
- Y. Huang, J. Liang and Y. Chen, Small, 2012, 8, 1805 Search PubMed.
- Y. H. Hu, H. Wang and B. Hu, ChemSusChem, 2010, 3, 782 CrossRef CAS.
- S. Biswas and L. T. Drzal, Chem. Mater., 2010, 22, 5667 CrossRef CAS.
- C. Xu, J. Sun and L. Gao, J. Mater. Chem., 2011, 21, 11253 RSC.
- H. Lee, J. Kang, M. S. Cho, J.-B. Choi and Y. Lee, J. Mater. Chem., 2011, 21, 18215 RSC.
- H.-W. Wang, Z.-A. Hu, Y.-Q. Chang, Y.-L. Chen, H.-Y. Wu, Z.-Y. Zhang and Y.-Y. Yang, J. Mater. Chem., 2011, 21, 10504 RSC.
- H. Su, T. Wang, S. Zhang, J. Song, C. Mao, H. Niu, B. Jin, J. Wu and Y. Tian, Solid State Sci., 2012, 14, 677 Search PubMed.
- X. Xia, Q. Hao, W. Lei, W. Wang, H. Wang and X. Wang, J. Mater. Chem., 2012, 22, 8314 RSC.
- X. Wang, X. Zhou, K. Yao, J. Zhang and Z. Liu, Carbon, 2011, 49, 133 CrossRef CAS.
- F. Li, J. Song, H. Yang, S. Gan and Q. Zhang, Nanotechnology, 2009, 20, 455602 CrossRef.
- J. Liang, W. Wei, D. Zhong, Q. Yang, L. Li and L. Guo, ACS Appl. Mater. Interfaces, 2012, 4, 454 CrossRef CAS.
- Y. Li, X. Lv, J. Lu and J. Li, J. Phys. Chem. C, 2010, 114, 21770 CrossRef CAS.
- S. Sahoo, G. Karthikeyan, G. C. Nayak and C. K. Das, Synth. Met., 2011, 161, 1713 Search PubMed.
- N. I. Kovtyukhova, P. J. Ollivier, B. R. Martin, T. E. Mallouk, S. A. Chizhik, E. V. Buzaneva and A. D. Gorchinskiy, Chem. Mater., 1999, 11, 771 CrossRef CAS.
- H. Wang, Q. Hao, X. Yang, L. Lu and X. Wang, ACS Appl. Mater. Interfaces, 2010, 2, 821 CrossRef CAS.
- Y. Xu, H. Bai, G. Lu, C. Li and G. Shi, J. Am. Chem. Soc., 2008, 130, 5856 CrossRef CAS.
- Y.-C. Liu, Y.-C. Liu and Y.-T. Lin, J. Phys. Chem. B, 2003, 107, 11370 CrossRef CAS.
- H. N. M. E. Mahmud, A. Kassim, Z. Zainal and W. M. M. Yunus, J. Appl. Polym. Sci., 2006, 100, 4107 Search PubMed.
- G. Cho, B. M. Fung, D. T. Glatzhofer, J.-S. Lee and Y.-G. Shul, Langmuir, 2001, 17, 456 CrossRef CAS.
- S. Stankovich, D. A. Dikin, R. D. Piner, K. A. Kohlhaas, A. Kleinhammes, Y. Jia, Y. Wu, S. T. Nguyen and R. S. Ruoff, Carbon, 2007, 45, 1558 CrossRef CAS.
- C. N. R. Rao, A. K. Sood, K. S. Subrahmanyam and A. Govindaraj, Angew. Chem., Int. Ed., 2009, 48, 7752 CrossRef CAS.
- F. Tuinstra and J. L. Koenig, J. Chem. Phys., 1970, 53, 1126 CrossRef CAS.
- A. C. Ferrari and J. Robertson, Phys. Rev. B: Condens. Matter, 2000, 61, 14095 CrossRef CAS.
- S. Bose, T. Kuila, M. E. Uddin, N. H. Kim, A. K. T. Lau and J. H. Lee, Polymer, 2010, 51, 5921 CrossRef CAS.
- D. Zhang, X. Zhang, Y. Chen, P. Yu, C. Wang and Y. Ma, J. Power Sources, 2011, 196, 5990 CrossRef CAS.
- A. R. Wang and H. Xiao, Mater. Lett., 2009, 63, 1221 CrossRef.
- A. Ferrari, J. Meyer, V. Scardaci, C. Casiraghi, M. Lazzeri, F. Mauri, S. Piscanec, D. Jiang, K. Novoselov and S. Roth, Phys. Rev. Lett., 2006, 97 Search PubMed.
- G. Williams, B. Seger and P. V. Kamat, ACS Nano, 2008, 2, 1487 CrossRef CAS.
- A. Guimin, N. Na, Z. Xinrong, M. Zhenjiang, M. Shiding, D. Kunlun and L. Zhimin, Nanotechnology, 2007, 18, 435707 Search PubMed.
- J. Wang, Y. Xu, J. Zhu and P. Ren, J. Power Sources, 2012, 208, 138 Search PubMed.
- S. Stankovich, R. D. Piner, X. Chen, N. Wu, S. T. Nguyen and R. S. Ruoff, J. Mater. Chem., 2006, 16, 155 RSC.
- Y. Li, S. Zhu, Q. Liu, J. Gu, Z. Guo, Z. Chen, C. Feng, D. Zhang and W.-J. Moon, J. Mater. Chem., 2012, 22, 2766 RSC.
| This journal is © The Royal Society of Chemistry 2012 |
