Novel preparation of nitrogen-doped graphene in various forms with aqueous ammonia under mild conditions†
Gang
Wang
ab,
Li-Tao
Jia
*a,
Yan
Zhu
c,
Bo
Hou
a,
De-Bao
Li
a and
Yu-Han
Sun
*c
aState Key Laboratory of Coal Conversion, Institute of Coal Chemistry, Chinese Academy of Sciences, 030001 Taiyuan, Shanxi, P. R. China. E-mail: jialitao910@163.com; Fax: + 81 351 404 1153; Tel: +81 351 412 1877
bUniversity of Chinese Academy of Sciences, 100049 Beijing, P. R. China
cLow Carbon Conversion Center, Shanghai Advanced Research Institute, Chinese Academy of Sciences, 201203 Shanghai, P. R. China. E-mail: yhsun@sxicc.ac.cn
First published on 26th September 2012
Abstract
Nitrogen-doped graphene (N-G), in the form of a stable dispersion, a strong hydrogel and a macroporous aerogel, was synthesized by simultaneous nitrogen doping and reduction of graphene oxide with aqueous ammonia under mild conditions. The N content and thermal stability of the resultant samples proved to be high.
Nowadays, graphene has attracted extensive attention worldwide in the application fields of composites materials,1 electron devices,2 catalysts,3 gas sensors,4 lithium ion batteries5 due to its superior chemical and physical properties over conventional materials. Modulating properties of carbon materials via chemical doping with nitrogen, which has been frequently applied to carbon nanotubes, carbon scaffolds and carbon nanofibers, is an effective method to introduce new or improved functions. For instance, graphitic carbon nitride exhibited photocatalytic properties under visible light.6 For graphene, nitrogen doping endows it with n-type electron doping behavior,7 band gap tuning8 and even electrocatalytic activity for oxygen reduction reactions.9 At present, nitrogen-doped graphene (N-G) is mainly produced in solid state with the assistance of ammonia or N2 by means of high-power electrical joule heating,2 high-temperature annealing (about 900 °C),7 chemical vapor deposition (CVD)9 and microwave plasma enhanced CVD method (MPECVD).10 However, the drawbacks of the above methods lie in their high consumption of energy, sophisticated operation or low nitrogen content (5%). Though approaches using toxic acetonitrile,11 hydrazine/ammonia12 and NLi313 as nitrogen sources have been reported, solution-processable methods for the preparation of N-G under mild conditions are relatively less investigated, which is easy to operate and of significance for the large-scale application of graphene in different fields. Furthermore, nitrogen-doping improves the hydrophilicity of carbon materials14 and makes further treatments easier. In addition, graphene materials used for different applications usually possess unique characteristics, such as porous structures for catalysts and supercapacitors,15,16 single crystals for electronics,17 and hydrogels for drug release.18 Therefore, a facile and practical approach to prepare N-G with controllable N content, variable solubility and various forms under mild conditions is quite desirable. Herein we first report a promising approach to simultaneously nitrogen dope and reduce graphene oxide by aqueous ammonia under mild conditions, obtaining a stable dispersion below 100 °C, a hydrogel above 100 °C and an aerogel of N-G after lyophilization, respectively.
The colloid of graphene oxide (GO) at a concentration of 1.5 mg mL−1 was prepared by Hummers' method19 and further post treatments of sonication and centrifugation. Then 8 mL 28 wt% of aqueous ammonia was added into 100 mL of the as-made GO dispersion, followed by transferring the mixture into a Teflon-lined autoclave and heating at 60–180 °C for 5 h without stirring (see ESI†). The collected samples were denoted as N-G-x, where x represents reaction temperature.
The GO dispersion was subjected to a reaction with ammonia under hydrothermal conditions at 60–100 °C, accompanied by the color change of the stable dispersion from brown to black (Fig. 1a). The reaction process was monitored by UV-vis absorption spectroscopy (Fig. S1, ESI†). The absorption peak of the GO dispersion centered at 231 nm was red-shifted to 263 nm after the reaction at 100 °C, indicating the restoration of the electronic conjugation and deoxygenation of GO.20 The thickness change of a single graphene sheet from 1 nm to 0.86 nm (Fig. S2, ESI†) further directly confirms the reduction of GO, which is attributed to the restoration of the conjugated network and the partial removal of oxygen-containing functional groups, comparable to the reported one.21 The nitrogen species in graphene were clearly verified by the EELS mapping of N-G-100 (Fig. S3, ESI†). Apparently, each element mapping graph matches well with the TEM images of the sample with a crumpled sheet-like morphology, indicating that the C, N and O elements were uniformly distributed in the as-made N-G.
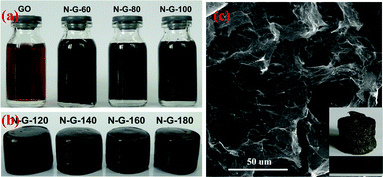 | ||
| Fig. 1 Photographs of N-G in the forms of (a) stable dispersion and (b) hydrogel; (c) SEM images of aerogel of N-G-140. Inset in Fig. 1(c) is a digital image of the aerogel of N-G-140. | ||
When the reaction is conducted above 100 °C, the hydrogel of N-G is obtained (Fig. 1b), which could be attributed to the in situ self-assembly of randomly oriented graphene sheets. The formation of graphene hydrogel, driven by the hydrophobicity and π–π stacking interactions between graphene layers, were also previously observed by others via a controlled reduction process.22,23 Similarly, we also find that the apparent sizes of the as-prepared hydrogels decreased with increasing the reaction temperature. It seems that more water was expelled from the assembly of N-G and more cross linkages between graphene sheets were formed at higher temperatures, therefore, obtaining more compact and stronger hydrogels. The rheological properties of the obtained hydrogel were determined by small-deformation oscillatory measurements. It was found that the hydrogel of N-G exhibits a shear-thinning behavior (Fig. 2a) as a typical characteristic of a physical gel; and the elastic modulus (G′) of N-G is about 20 times higher than its loss modulus (G′′) in the frequency range of 1–200 rad s−1 (Fig. 2b), indicating a predominantly elastic response; the G′′ of N-G hydrogel is slightly sensitive to the frequency and does not cross over G′, implying a highly and non-covalently cross-linked hydrogel.22 Based on these characteristics, we can conclude that the hydrogel of N-G is physically cross-linked to form a permanent and strong network. The G′ value of N-G-180 at 10 rad s−1 was 460 KPa, much higher than 50 KPa of robust graphene/α-FeOOH hydrogel.24
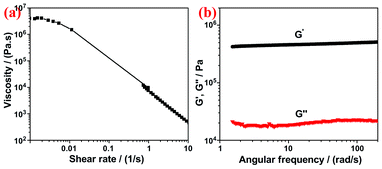 | ||
| Fig. 2 (a) Steady and (b) dynamic rheological behavior of N-G hydrogel. | ||
As an important parameter of gel, the swelling power of the hydrogels prepared above is over 168 (Table S1, ESI†), i.e. high-water content (>99.4 wt%). Moreover, the hydrogel of N-G differs significantly from other self-assembled hydrogels in terms of thermal stability because the former remains quite stable in the temperature range of 5–100 °C without a sol–gel transition observed. The hydrogel of N-G also tends to encapsulate more water than the reduced graphene oxide prepared at the same hydrothermal condition without ammonia (Fig. S4, ESI†); that should derive from the better solubility of nitrogen groups incorporated into the graphene.25 After lyophilization of the N-G hydrogels, aerogels of N-G rich in pores are successfully fabricated, meanwhile maintaining the shape of the as-synthesized hydrogel (inset of Fig. 1c). Fig. 1c shows a 3D continuous network of freely oriented graphene sheets in samples which are loosely compacted and consist of pores in several tens of micrometers. The quality of the resultant N-G is further revealed by Raman spectra (Fig. S5, ESI†). The intensity ratio of the D to G band (ID/IG) of N-G slightly increased compared with that of GO, indicating that a few more defect sites or nitrogen heteroatoms were introduced into the graphene network.
The XPS was used to characterize the extent of N-doping and reduction by quantitatively analyzing the element composition of the samples from peak area (C1s, N1s and O1s) and their atomic sensitivity factors. As Fig. 3a shows, the intensified N1s peak at ∼400 eV and the decreased O1s peak at ∼530 eV are obviously observed with increasing the reaction temperature, indicating a simultaneous N-doping and deoxygenation of GO. Fig. 3b further reveals that the N content (N/C) of the samples is in the range of 7–12.5 at% from 60 to 180 °C, accompanied by a sharp decrease of O content (O/C) from 32.6 to 9.4 at% (Table S2, ESI†). And the (O+N)/C ratios of the samples present a two-stage pattern: it almost remains constant at about 40 at% below 100 °C and 17 at% above 100 °C respectively, implying different reactions may occur between GO and aqueous ammonia at elevated temperatures. Besides, the influence of pressure was also investigated by replacing the autoclave by round flask with reflux under atmospheric pressure. And the prepared samples were denoted as N-G-F-x. It's revealed that pressure had a promotive effect on reduction and N-doping of GO because both C/O (i.e. the reciprocal of O/C) and N/C of N-G-(60, 80, 100) were higher than those of N-G-F-(60, 80, 100), which should be due to the thicker concentration of ammonia under hydrothermal condition over that at normal pressure.
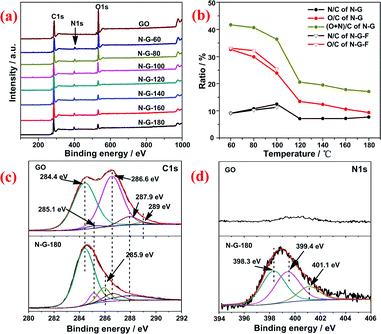 | ||
| Fig. 3 (a) XPS spectra of N-G prepared at various temperatures; (b) the extent of N-doping (atomic ratio of N/C), reduction (O/C) and the ratios of (O+N)/C of the samples calculated from XPS results; (c) high resolution C1s and (d) N1s spectra of GO and N-G-180. | ||
The bonding configuration of nitrogen incorporated into the graphene was revealed by high-resolution XPS N1s spectrum. Deconvolution of N1s spectrum of N-G-180 (Fig. 3d) yields two main components from pyridinic N (398.3 eV) and amino or pyrrolic N (399.4 eV), and a minor one corresponding to graphitic N (401.1 eV).7,26 Pyridinic N and pyrrolic N respectively devote one and two p-electrons to the π conjugated network. Graphitic N results from the substitution of C by N inside the graphene layer. Apart from these three nitrogen types, NH4+ (401.3 eV)12,27 deriving from reaction of sulfonic groups with ammonia28 was also observed for N-G-(60, 80, 100) and the amino N dominated in the synthesized N-G at low temperatures (Fig. S6, ESI†). Whereas for N-G-(120–180), the amino and pyridinic N dominated compared with little graphitic N in the samples. The transformation between N groups at elevated temperature should occur as observed for N-G synthesized via thermal annealing.7,26
The deconvolution of C1s spectra of GO and N-G-180 (Fig. 3c) further confirm the successful N-doping and reduction of GO: the components of the C1s spectrum of GO located at 284.4 eV, 285.1 eV, 286.6 eV, 287.9 eV and 289.0 eV can be assigned to C in graphite, C–OH, C–O–C, C![[double bond, length as m-dash]](https://www.rsc.org/images/entities/char_e001.gif) O and COOH groups respectively; while for N-G-180, the components from C–O–C and COOH nearly disappear and the dominating peaks located at 285.9 eV can be ascribed to C–N bonds.25 A similar conclusion can also be reached from the results of diffuse reflectance infra-red Fourier transform spectroscopy (DRIFT, Fig. S7, ESI†). The peaks from oxygen-containing functional groups, such as C–O–C (988 and 1227 cm−1), C–OH (1069 and 3000–3700 cm−1) and CO from carboxyl/carbonyl (1736cm−1), gradually decreased with increasing the reaction temperature. And the peaks ascribed to CC (1545 cm−1), N–H from NH4+ (1458 cm−1) and C–N (1338 cm−1) were found in the spectra of N-G. The narrow band of GO at 1627 cm−1 corresponding to oxygen surface compounds29,30 broadened and then gradually faded. This should result from the reaction of oxygen-containing functional groups (C–O–C, COOH) with ammonia31 and further deoxygenation of GO.
O and COOH groups respectively; while for N-G-180, the components from C–O–C and COOH nearly disappear and the dominating peaks located at 285.9 eV can be ascribed to C–N bonds.25 A similar conclusion can also be reached from the results of diffuse reflectance infra-red Fourier transform spectroscopy (DRIFT, Fig. S7, ESI†). The peaks from oxygen-containing functional groups, such as C–O–C (988 and 1227 cm−1), C–OH (1069 and 3000–3700 cm−1) and CO from carboxyl/carbonyl (1736cm−1), gradually decreased with increasing the reaction temperature. And the peaks ascribed to CC (1545 cm−1), N–H from NH4+ (1458 cm−1) and C–N (1338 cm−1) were found in the spectra of N-G. The narrow band of GO at 1627 cm−1 corresponding to oxygen surface compounds29,30 broadened and then gradually faded. This should result from the reaction of oxygen-containing functional groups (C–O–C, COOH) with ammonia31 and further deoxygenation of GO.
The good thermal stability of N-G was then verified by TG equipped with in situ MS (Fig. 4a and b) and heat treatment under Ar. The N-G-180 exhibits less than 1.8 wt% loss in the range of 0–200 °C with a predominated corresponding peak in MS at about 100 °C (m/z = 18, 17), which can be ascribed to the desorption of water physically absorbed between the layers of N-G. In the range of 300–1000 °C, N-G-180 presents a 15 wt% loss, which can be attributed to the formation of CO (m/z = 28) and CO2 (m/z = 44) in the sweep gas. The similar weight loss (10–15 wt%) was also found in other chemically reduced graphenes, even the strongest reductants (hydrazine and vitamin C) were used.32 Further insight into the stability of nitrogen species in N-G was accomplished by analyzing the high resolution N1s spectrum of N-G-180 after heat treatment at various temperatures in Ar atmosphere (Fig. 4c). With increasing treatment temperature, the N1s XP spectrum of N-G-180 evolved from a relatively symmetric peak to an asymmetric one with two small peaks centered at 398.3 and 401.1 eV, implying the existence of superiorly stable N species (pyridinic and graphitic N) in the obtained N-G. Similarly, it also has been reported that pyridinic and graphitic N tend to be more stable than amino or pyrrolic N in the graphene structure.13,26
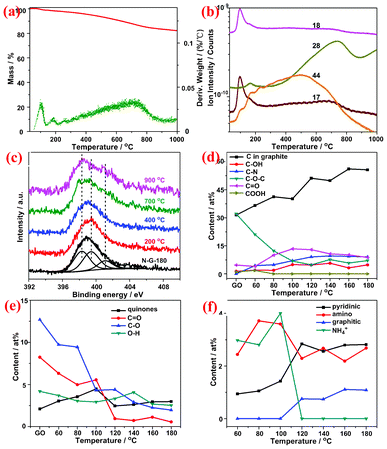 | ||
| Fig. 4 (a) TG (red) and DTG (green) plots of N-G-180; (b) in situ MS spectra of sweep gas from N-G-180 at various temperatures and (c) high resolution N1s spectra of N-G-180 after heat treatment for 1h under Ar atmosphere. The content evolution of functional groups with temperature change obtained by deconvolving the (d) C1s, (e) O1s and (f) N1s spectra of N-G. | ||
The content evolution of functional groups in samples with the temperature change, calculated from the results of XPS (Fig. S6, ESI†), was investigated to explore the possible reaction pathway. With increasing reaction temperature, the content of C in graphite and C–N bond gradually intensified in contrast to that of C–O–C (Fig. 4d–e), indicating the restoration of the π conjugated system, the formation of a covalently bonded nitrogen and deoxygenation. It's noteworthy that the intensity of C–OH and CO strengthened and then weakened in the temperature range (Fig. 4d–e), which should originate from the combination of the reaction of oxygen groups (i.e. COOH and C–O–C) with ammonia and further deoxygenation at higher temperatures (Scheme 1). On the one hand, NH4+ in the basic reaction system can react with carboxyl and epoxy groups, leading to the formation of amides, hydroxyl and amine groups, thus resulting in the decrease of the COOH and C–O–C groups and the increase of C–N, C–OH and CO groups at low temperatures (<100 °C). This proposed mechanism is supported experimentally28 and theoretically33 since the ring-opening of epoxy groups can take place under alkaline conditions. It also agrees with the results of XPS, giving rise to a reasonable explanation that the (O+N)/C ratio (40 at%) of N-G remains comparable to the 38.5 at% of GO at low temperature. On the other hand, further reduction of GO is accomplished under alkaline conditions at higher temperatures, accompanied by the transformation of N groups and structural rearrangement to restore the π conjugated network. That corresponds well to the further decrease of oxygen-containing groups at high temperatures (>100 °C). Though the detailed process still remains to be revealed, it seems that OH− can effectively promote the reduction of GO especially at high temperatures, as reported.21
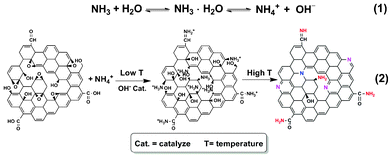 | ||
| Scheme 1 Proposed illustration for the N-doping and reduction of GO with aqueous ammonia under hydrothermal condition. | ||
In summary, a scalable approach to prepare N-G in various forms is reported, including a stable dispersion, a hydrogel and an aerogel of N-G. The stable dispersion of N-G mainly consists of single-sheet graphene and the hydrogel is physically cross-linked to be quite strong. For the aerogel of N-G, interconnected macropores were observed. The pressure has a promotive effect on the reduction and N-doping of GO. Both the thermal stability and N content of the synthesized N-G proved to be high. Finally, the mechanism of N-doping and reduction is proposed. This solution-processable method will open up a practical opportunity to fabricate chemically doped graphene in various forms for different applications.
Acknowledgements
This work was supported by National Natural Science Foundation of China (21003149 and 21076218).References
- X. Huang, X. Qi, F. Boey and H. Zhang, Chem. Soc. Rev., 2012, 41, 666–686 RSC.
- X. Wang, X. Li, L. Zhang, Y. Yoon, P. K. Weber, H. Wang, J. Guo and H. Dai, Science, 2009, 324, 768–771 CrossRef CAS.
- A. R. Siamaki, A. E. R. S. Khder, V. Abdelsayed, M. S. El-Shall and B. F. Gupton, J. Catal., 2011, 279, 1–11 CrossRef CAS.
- F. Schedin, A. K. Geim, S. V. Morozov, E. W. Hill, P. Blake, M. I. Katsnelson and K. S. Novoselov, Nat. Mater., 2007, 6, 652–655 CrossRef CAS.
- Z.-S. Wu, W. Ren, L. Wen, L. Gao, J. Zhao, Z. Chen, G. Zhou, F. Li and H.-M. Cheng, ACS Nano, 2010, 4, 3187–3194 CrossRef CAS.
- K. Maeda, X. Wang, Y. Nishihara, D. Lu, M. Antonietti and K. Domen, J. Phys. Chem. C, 2009, 113, 4940–4947 CAS.
- X. Li, H. Wang, J. T. Robinson, H. Sanchez, G. Diankov and H. Dai, J. Am. Chem. Soc., 2009, 131, 15939–15944 CrossRef CAS.
- M. Deifallah, P. F. McMillan and F. Cora, J. Phys. Chem. C, 2008, 112, 5447–5453 CAS.
- L. T. Qu, Y. Liu, J. B. Baek and L. M. Dai, ACS Nano, 2010, 4, 1321–1326 CrossRef CAS.
- N. Soin, S. Sinha Roy, S. Roy, K. S. Hazra, D. S. Misra, T. H. Lim, C. J. Hetherington and J. A. McLaughlin, J. Phys. Chem. C, 2011, 115, 5366–5372 CAS.
- W. Qian, X. Cui, R. Hao, Y. Hou and Z. Zhang, ACS Appl. Mater. Interfaces, 2011, 3, 2259–2264 CAS.
- D. H. Long, W. Li, L. C. Ling, J. Miyawaki, I. Mochida and S. H. Yoon, Langmuir, 2010, 26, 16096–16102 CrossRef CAS.
- D. Deng, X. Pan, L. Yu, Y. Cui, Y. Jiang, J. Qi, W.-X. Li, Q. Fu, X. Ma, Q. Xue, G. Sun and X. Bao, Chem. Mater., 2011, 23, 1188–1193 CrossRef CAS.
- L. Jiang and L. Gao, Carbon, 2003, 41, 2923–2929 CrossRef CAS.
- Z. Fan, Q. Zhao, T. Li, J. Yan, Y. Ren, J. Feng and T. Wei, Carbon, 2012, 50, 1699–1703 CrossRef CAS.
- Z. Tang, S. Shen, J. Zhuang and X. Wang, Angew. Chem., Int. Ed., 2010, 49, 4603–4607 CrossRef CAS.
- L. Gao, W. Ren, H. Xu, L. Jin, Z. Wang, T. Ma, L.-P. Ma, Z. Zhang, Q. Fu, L.-M. Peng, X. Bao and H.-M. Cheng, Nat. Commun., 2012, 3, 699 CrossRef.
- H. Bai, C. Li, X. Wang and G. Shi, Chem. Commun., 2010, 46, 2376–2378 RSC.
- W. S. Hummers and R. E. Offeman, J. Am. Chem. Soc., 1958, 80, 1339–1339 CrossRef CAS.
- D. Li, M. B. Muller, S. Gilje, R. B. Kaner and G. G. Wallace, Nat. Nanotechnol., 2008, 3, 101–105 CrossRef CAS.
- X. Fan, W. Peng, Y. Li, X. Li, S. Wang, G. Zhang and F. Zhang, Adv. Mater., 2008, 20, 4490–4493 CrossRef CAS.
- Y. Xu, K. Sheng, C. Li and G. Shi, ACS Nano, 2010, 4, 4324–4330 CrossRef CAS.
- W. Chen and L. Yan, Nanoscale, 2011, 3, 3132 RSC.
- H.-P. Cong, X.-C. Ren, P. Wang and S.-H. Yu, ACS Nano, 2012, 6, 2693–2703 CrossRef CAS.
- L. Lai, L. Chen, D. Zhan, L. Sun, J. Liu, S. H. Lim, C. K. Poh, Z. Shen and J. Lin, Carbon, 2011, 49, 3250–3257 CrossRef CAS.
- L. S. Zhang, X. Q. Liang, W. G. Song and Z. Y. Wu, Phys. Chem. Chem. Phys., 2010, 12, 12055–12059 RSC.
- W. E. Swartz Jr and R. A. Alfonso, J. Electron Spectrosc. Relat. Phenom., 1974, 4, 351–354 CrossRef.
- C. Petit, M. Seredych and T. J. Bandosz, J. Mater. Chem., 2009, 19, 9176–9185 RSC.
- T. Szabó, O. Berkesi and I. Dékány, Carbon, 2005, 43, 3186–3189 CrossRef.
- M. Seredych and T. J. Bandosz, Langmuir, 2010, 26, 5491–5498 CrossRef CAS.
- M. Seredych, J. A. Rossin and T. J. Bandosz, Carbon, 2011, 49, 4392–4402 CrossRef CAS.
- M. J. Fernández-Merino, L. Guardia, J. I. Paredes, S. Villar-Rodil, P. Solís-Fernández, A. Martínez-Alonso and J. M. D. Tascón, J. Phys. Chem. C, 2010, 114, 6426–6432 Search PubMed.
- J. M. Coxon and M. A. E. Townsend, Tetrahedron, 2007, 63, 5665–5668 CrossRef CAS.
Footnote |
| † Electronic Supplementary Information (ESI) available: details of experiments, characterization and additional figures. See DOI: 10.1039/c2ra21348f |
| This journal is © The Royal Society of Chemistry 2012 |