Kinetics studies on wet and dry gas–solid carbonation of MgO and Mg(OH)2 for CO2 sequestration
Johan
Fagerlund
*a,
James
Highfield
b and
Ron
Zevenhoven
*a
aThermal and Flow Engineering Laboratory, Åbo Akademi University, Piispankatu, 20500, Turku, Finland. E-mail: johan.fagerlund@abo.fi; ron.zevenhoven@abo.fi; Fax: +358 2 215 4792
bInstitute of Chemical & Engineering Sciences (ICES), Agency for Science, Technology and Research (A*Star), 1 Pesek Rd., Jurong Island, Singapore 627833
First published on 21st September 2012
Abstract
Mineral carbonation is a carbon dioxide capture and storage (CCS) route that warrants further investigation. Although most of the CCS research to date has been concerned with underground storage in liquefied form, mineral carbonation is the only method that disposes CO2 in a permanent and inherently safe manner. Here, we consider the gas–solid conversion of both MgO and Mg(OH)2 with CO2 in the presence and absence of steam in an attempt to model and predict the optimum conditions for rapid and complete carbonation. Results from pressurised thermogravimetric analysers (PTGA) and a laboratory scale pressurised fluidised bed (PFB) are presented. The results show that the carbonation of Mg(OH)2 is much faster (∼50% in 4 min) in a PFB than the carbonation of comparatively fine MgO (<44 μm) in a PTGA (∼50% in 30 min). Furthermore, the results show that the presence of water vapour is pivotal, giving rise to a clear distinction between MgO and Mg(OH)2 carbonation. In the case of MgO, steam (>10%) accelerates the carbonation considerably. However, in the case of Mg(OH)2, the addition of steam to the CO2 is less important as it is provided intrinsically, as a result of the dehydroxylation of Mg(OH)2 at elevated temperatures. Still, humidifying the gas stream can help control dehydroxylation, thereby sustaining carbonation, which typically levels out short of completion. A careful control of the carbonation conditions (temperature, pressure, fluidising velocity, gas composition) and particle properties should allow for close to complete carbonation (>90%) without compromising the carbonation kinetics. Because the PFB carbonation step considered here is part of a larger CCS process (Mg extraction from a natural and abundant mineral followed by production of MgCO3), the precipitation stage [Mg(OH)2 formation] may be tailored to obtain the necessary particle properties (surface area, porosity).
Introduction
Mineral carbonation, CO2 sequestration and carbon dioxide sequestration by mineralisation all refer to the same natural carbon dioxide capture and storage (CCS) concept that was introduced by Seifritz in 1990.1 Since then, research has focused on accelerating this process, also known as natural weathering, but demonstration scale projects utilising CO2 mineralisation are still scarce.2 Typically, these types of processes have been found too expensive and energy intensive, but a few alternatives are being intensively developed.3–7 One of these mineral carbonation processes is being developed at the Åbo Akademi University (ÅA).7–10The most straightforward way of CO2 emissions mitigation by mineral carbonation is the direct gas–solid carbonation of a mineral powder. Lackner et al.11 performed such experiments on various magnesium rich minerals, but were unable to achieve reasonable carbonation kinetics on fine particles (i.e. complete carbonation within an hour) even under severe conditions (340 bar, 500 °C). Thus, other approaches are required, one of which is to first extract magnesium from a mineral and then carbonate the extracted/separated magnesium. This counts as a so called “indirect” carbonation route and is inherently more complicated than direct carbonation. The added complexity is there to improve the reaction kinetics, but the trade-off for such processes is usually a reduced overall sequestration potential due to process energy and chemical requirements. For example, in a recent paper by Romão et al.12 it was concluded that in order to fix 1 kg of CO2, around 3 MJ of energy, mainly as heat, and 3.1 kg of rock (serpentinite) is required using the ÅA carbonation process. This is a significant energy penalty, especially as it involves the use of a pure CO2 stream. Including the CO2 capture step into the picture adds another large energy penalty to the system as can be reviewed in two recent mineral carbonation life cycle assessment studies.13,14 The possibility to use flue gases directly is currently being developed at ÅA, which would remove the need for an expensive CO2 separation step.
The ÅA carbonation process involves the extraction of Mg from a magnesium silicate rock and the subsequent carbonation of Mg(OH)2. It should be noted that Mg in the form of MgO has also been considered, but for reasons of reactivity, Mg(OH)2 has been preferred.7,11 Still, depending on the calcination temperature, MgO can exhibit greatly varying carbonation reactivity.15–17 In addition, it should be noted that MgO formation is a necessary precursor to MgCO3 formation18,19 and clearly the carbonation of Mg(OH)2 is more complicated than what could be assumed by looking at the overall reaction equation given below:
| Mg(OH)2 (s) + CO2 (g) ↔ MgCO3 (s) + H2O (g) | (1) |
Eqn (1) simplifies the overall Mg(OH)2 carbonation reaction, which has been suggested to take place via several intermediate steps, indicating that there are different magnesium hydroxide states that determine the outcome of the carbonation reaction.15,16,18 Still, a process that could control the formation of these intermediate phases and thus accelerate carbonation has not yet been reported.
One of the key parameters in gas–solid carbonation is the presence of water and there have been several observations of water catalysing the reaction.20,21 At the same time, it has been shown that water vapour inhibits dehydroxylation of Mg(OH)218,22 as can be understood from the equation below:
| Mg(OH)2 (s) ↔ MgO (s) + H2O (g) | (2) |
Many researchers have studied heterogeneous reactions between magnesium or calcium species and CO2 or H2O. These studies, although not aiming directly at CO2 sequestration, are a useful addition to the mineral carbonation research and perhaps one of the most important findings is of the role of H2O in the carbonation process. Considering a paper by Shih et al.23 who studied the kinetics of Ca(OH)2 carbonation in the presence of humid low temperature CO2, some valuable insights of the surface chemistry can be obtained. It is uncertain whether this information can be correlated with Mg(OH)2 carbonation taking place at much higher temperatures, but it was found that a high humidity increased the final conversion degree by increasing the water layer that covers the reacting particles. Similarly, Wu et al.24 noted that the CO2-sorption capacity of Ca(OH)2 was enhanced in the presence of steam, attributing the effect to a mechanism whereby gaseous steam maintains open pores in Ca(OH)2 to sustain carbonation. Also, it was noted that the CO2 pressure increased the sorption kinetics but without displacing sorption equilibrium, which governed the final conversion degree.
In the case of Mg(OH)2 carbonation, Béarat et al.19 showed that carbonation of low-temperature (375 °C) -calcined Mg(OH)2 reacts only slightly with both dry and humid CO2 at 375 °C and atmospheric pressure. When the temperature is lowered, carbonation and rehydroxylation in the presence of steam is increased markedly. This shows that when the temperature is too high steam cannot participate (reducing the H2O activity at the particle surface) in the carbonation reaction unless the vapour pressure is increased and that water plays an important role in the carbonation reaction. One could argue that it need not be present in the external gas-phase as long as it is present in some other form e.g. within the mineral, such as that in Mg(OH)2. Furthermore, if the mineral to be carbonated is Mg(OH)2, external water vapour may actually inhibit the carbonation reaction by slowing down dehydroxylation.22
High pressure and temperature carbonation has also been studied previously and already in 1998, Butt et al.20 were able to show carbonation degrees up to 90% within 30 min (565 °C and 52.7 bar CO2) using an autoclave wherein the sample of Mg(OH)2 was subjected to a slow flowing gas i.e. no mechanical strain on the particles. That the gas was slow flowing proved important, as both static and higher flow conditions showed slower carbonation rates, but the same final conversion. This could suggest that (in accordance with what Butt et al. suggested in 1998) there is an optimal flow rate for Mg(OH)2 carbonation. However, they did not report the MgO composition of the various samples and it could be that, in a higher flow rate, the formed water vapour is carried away so quickly by the passing CO2 stream that it does not have time to interact with the CO2 to form the carbonate. In other words, evaporation is enhanced by the fluidising gas, and the resulting MgO is inert to further carbonation. In case of near static conditions, Butt et al.20 argued that the reduced reactivity could be the result of an increased H2O pressure around the particles, hindering both further dehydroxylation and CO2 penetration.
Evidently there are a number of factors that need to be considered in order to understand and develop a large-scale mineral carbonation unit and an attempt at explaining these have been made here. Previously reported findings are compared and discussed together with new carbonation results from both a pressurised fluidised bed (PFB) and a pressurised thermogravimetric analyser (PTGA). In addition, the results have been tested on models that aim to capture the underlying phenomena of both MgO and Mg(OH)2 carbonation.
Experimental
This paper is concerned with gas–solid mineral carbonation in general, but particular emphasis has been placed on experiments performed using a PTGA at the Institute of Chemical & Engineering Sciences (ICES) in Singapore and a PFB at Åbo Akademi University (ÅAU). Also included here is a further analysis of PTGA data from tests performed in Finland several years ago, which involved Mg(OH)2 carbonation tests for which the degree of carbonation and rate of conversion to MgCO3 were reported.7,25The experimental setup at ICES in Singapore consists of a (vertical) PTGA that allows for pressures up to 60 bar and temperatures up to 1000 °C, more than enough for the purpose of MgO [and Mg(OH)2] carbonation. In addition, the system is equipped with a H2O injector that allows for high steam partial pressures. The PTGA equipment used for some earlier carbonation experiments done in Finland7,25 is similar to the one at ICES, but the maximum pressure is limited to around 45 bar.
At ÅAU, a laboratory-scale PFB (height 0.5 m, inner diameter 1.5 cm) has been built for the purpose of Mg(OH)2 carbonation.8 The maximum temperature and pressure conditions are around 600 °C and 75 bar. A HPLC pump can be used to provide steam to the gas stream, but unlike the PTGA's this system requires/allows much larger experimental batches (few grams to tens of grams).
Most of the experiments discussed here have been performed using Mg(OH)2 from Dead Sea Periclase Ltd. [DSP-Mg(OH)2], but a significant number of experiments have also been performed using Sigma-Aldrich MgO #325. Detailed scanning electron microscope (SEM) images of both of these materials can be seen in Fig. 1, clearly showing the difference in porosity between the two samples. In addition, serpentinite-derived Mg(OH)2 (from both Finnish and Lithuanian rock) is also discussed. In short, the experiments considered can be divided into MgO experiments using a PTGA,26 Mg(OH)2 experiments using a PFB,8,12,27,28 and some early work using DSP-Mg(OH)2 in a PTGA.7,25 Using MgO in the PFB has not been considered as Mg(OH)2 is the result of a preceding step of Mg extraction from silicate rock.9,10 Future work will address Mg(OH)2 carbonation in more detail using in situ DRIFTS and in situ XRD.
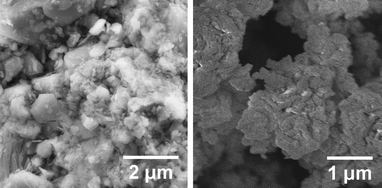 | ||
| Fig. 1 SEM-images of commercial Mg(OH)2 (Dead Sea Periclase Ltd.) and MgO (Sigma-Aldrich) | ||
For details about the materials discussed in this paper, see Table 1. In addition to the particle size ranges given in Table 1, a number of other particle sizes have also been used, but not measured for surface area and/or pore volume.
| Name | Description | Particle size range/μm | Surface area/m2 g−1 | Pore volume/cm3 g−1 | Used with: |
|---|---|---|---|---|---|
| DSP-Mg(OH)2 | Commercial Mg(OH)2 from Dead Sea Periclase Ltd. | 75–125 | 5.4 | 0.024 | Finland-PTGA, PFB |
| 125–212 | 5.5 | N/A | |||
| DSP-MgO | Calcined DSP-Mg(OH)2 | 75–125 | N/A | N/A | Finland-PTGA, PFB |
| Fi-Mg(OH)2 | Finnish serpentinite-derived Mg(OH)2 | 75–125 | 46.9 | 0.24 | PFB |
| Li-Mg(OH)2 | Lithuanian serpentinite-derived Mg(OH)2 | Finely ground (2 batches) | 44.4 | N/A | PFB |
| 55.4 | |||||
| HCl-Mg(OH)2 | Dissolved (in HCl) DSP-Mg(OH)2 and reprecipated | Finely ground | 10.2 | N/A | PFB |
| MgO #325 | Commercial MgO #325 from Sigma-Aldrich | <44 | 139 | 0.23 | Singapore-PTGA |
Model development
Pressurised thermogravimetric analysis of MgO carbonation
It has been shown that carbonation of MgO in the presence of steam is much faster than in a dry CO2 atmosphere.26 Therefore, based on our own experimental results, as well as on work by others,29,30 the following reaction mechanism for MgO carbonation in the presence of steam is proposed: | (3) |
 | (4) |
When steam is omitted from the gas phase, MgO reacts only slightly as can be seen from Fig. 2, where temperature and weight data as a function of time for two comparative PTGA experiments are given. The difference between the two experiments was in the composition of the gas. One contained CO2 only, while the other contained 5% vol. H2O mixed with CO2. The total pressure and temperature were the same; 20 bar and 300 °C, respectively. The sudden drop in temperature (450 to 300 °C) marks the start of the experiment as (pressure dependent) carbonation becomes thermodynamically favourable at the lower temperature.
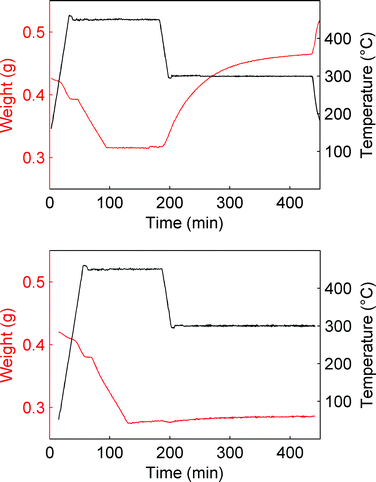 | ||
| Fig. 2 Comparison between carbonation (300 °C, Ptot = 20 bar) in the absence (bottom) and presence of steam (5% vol.). | ||
Although MgO is much more reactive in humid CO2, a small weight gain can be observed in the absence of steam as well. This weight increase can be attributed to direct carbonation of MgO and thus another equation should be added to the here considered reaction system:
 | (5) |
Eqn (5) incorporates the possibility of a reverse reaction, calcination, which takes place if the temperature exceeds a certain thermodynamic limit for MgCO3 stability dictated by the CO2 pressure (as discussed in the Appendix).
Following Liu and Shih,30 who studied calcium sulphation reactions in the presence of humid simulated flue gases, it could be assumed that H2O enhances the carbonation reaction by forming a region of dense water vapour around the reacting MgO particles where CO2 reacts to form carbonate ions and H+ ions, and where released Mg2+ ions could react with the carbonate ions to form MgCO3. A dense H2O region would generate more ions and thus increase both the yield and rate of carbonation as depicted in Fig. 3, which represents a single grain of a larger MgO [or Mg(OH)2] particle. Note that the picture is purely for illustrative purposes and the scales of the reacting elements are not based on any real observations.
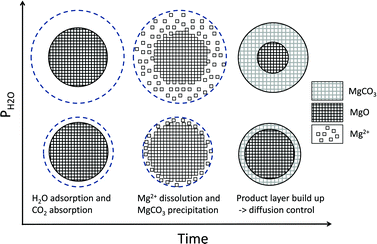 | ||
| Fig. 3 H2O adsorption model, schematic diagram with increasing water density in the y-axis and time on the x-axis. The topmost circles represent carbonation at a comparatively high steam pressure. | ||
Despite the clear evidence of H2O enhancing carbonation, the amount of steam and type of MgO is also of importance. In PTGA experiments by Zevenhoven et al.7,25 calcined DSP-Mg(OH)2, i.e. MgO, was very unreactive when subjected to a decreasing temperature and a mixture of CO2 and 1% steam at different pressures. Interestingly, it was even noted that the carbonation degree (which was very low) lowered with increasing CO2 pressure, in contrast to what might be expected. The reason for the low reactivity could be the high temperature (700 °C, 30 min) at which the Mg(OH)2 (75–125 μm) was calcined to MgO (which is known to affect the porosity and surface area of the formed particles31,32) or the low steam pressure. Irrespective of this, the reason for the decreasing carbonation trend with increasing pressure is less clear. One could speculate that the available pore volume of the particles was reduced with increasing pressure, thus inhibiting the available space for carbonation, but no measurements of pore volume as a function of pressure were done.
In contrast to these results, Highfield et al.26 were able to achieve near complete carbonation of MgO (Sigma-Aldrich MgO #325) in around 2 h with steam pressures between 5–10% of the total pressure (20–40 bar). Furthermore, it was found that steam was a necessary addition to carbonation of this fine MgO powder (<44 μm surface area = 110 m2 g−1, see Fig. 2). Based on these results and other experiments with the same material, the reaction system given by eqn (6) to (8) has been described by assuming an Arrhenius type mechanism for the reaction rate coefficients (k1, k1r, k2 and k3). The calcination reactions have not been considered for this model [i.e. the reverse reactions of eqn (4)and (5)] because all experiments where performed below the thermodynamic limit of MgCO3 stability,7i.e. Kp2 = k2/k2r ≫ 1 and Kp3 = k3/k3r ≫ 1.
 | (6) |
 | (7) |
 | (8) |
Here, ci represents the concentration of species i and MH stands for hydrated MgO (MgO·H2O), a simplified way to account for the complex chemistry of dissolution and precipitation reactions depicted in Fig. 3. The total concentration of Mg-species is constant. That both CO2 and H2O partial pressures influence the overall reaction has been considered by assigning each rate equation with a pressure exponential term (ni).
A frequently observed problem of gas–solid carbonation has been the formation of a carbonate layer on top of an unreacted solid core,7,19,22 preventing both outward and inward diffusion of species. Thus, in order to account for the formation of a rate-limiting MgCO3 layer building up on the surface, all three rate-equations have been multiplied by (cmax − cMgCO3)np, where cmax represents the maximum conversion degree and np is an experimentally determined factor. The maximum conversion degree is, for a given starting material, assumed to be a function of temperature, CO2 pressure, and H2O pressure (as given by eqn (17)) and it is based on similar observations done in other gas–solid (namely CaO) reaction systems (e.g. Ref. 33,34).
The maximum conversion degree, or final conversion degree reached for a set of MgO experiments can also be found dependent of the particle porosity,35 because carbonation of MgO is accompanied by a significant volume increase. This increase in volume can be seen in Fig. 4 as a decrease in porosity as carbonation proceeds for a set of experiments performed with the same starting material using a PTGA. Based on Fig. 4, it could be speculated that the initial pore volume (0.23 cm3 g−1 in this case) determines the maximum conversion degree attainable. As will be discussed below, this also appears to be the case for our DSP-Mg(OH)2 experiments performed using a PFB.
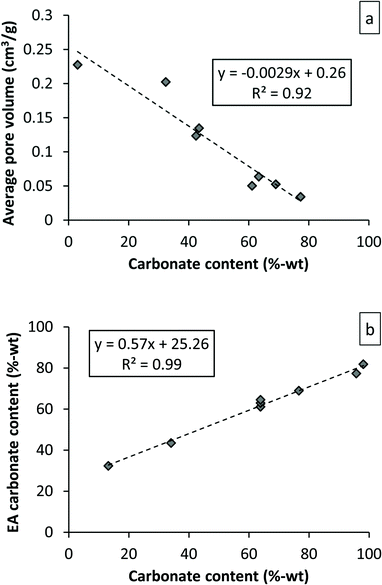 | ||
| Fig. 4 Pore volume as a function of conversion degree for PTGA experiments performed with Sigma-Aldrich #325 MgO (a). Elemental analysis results compared to PTGA weight signal derived magnesium carbonate content. Note that the experiments are not the same for both cases. | ||
One complication introduced by a water layer-initiated carbonation reaction is that the weight signal observed by a PTGA becomes a combination of both adsorbed H2O and adsorbed and reacted CO2. In other words, it is not possible to convert the weight increase directly to carbonate formation as the weight signal does not distinguish between different species. Comparing the elemental analysis results with the maximum weight difference achieved in the PTGA gives a straight line as seen in Fig. 4b. In an ideal case the weight increase detected by the PTGA would correspond exactly to the amount of CO2 in the sample, but this was not the case. What causes this discrepancy is not clear, but it could be the result of CO2 or H2O release associated with sample removal [that there is no Mg(OH)2 formation, is based on XRD scans of the final products]. For modelling purposes the difference between the two sets of data could be ignored. In other words, the slope of the weight curve has been assumed to match (well) the actual carbonation rate, although the rate of carbonation vs. H2O adsorption cannot be determined from this study. However, it has previously been noted that the initial adsorption of water can be very fast (within 1 min, temperature range 100–150 °C).29
Using a pressurised fluidised bed for Mg(OH)2 carbonation
The experiments considered here have been obtained using a laboratory scale (height: ∼0.5 m, inner diameter: 1.4 cm) PFB (a detailed description of the equipment can be found elsewhere8) and have been performed varying a number of parameters in order to maximise the carbonation degree. These parameters are temperature, pressure, water injection rate, flow rate, bed composition, reaction time, particle size and (BET) specific surface area (SA).Chizmeshya et al.15 studied the dehydroxylation of Mg(OH)2 and found it to take place via a series of oxyhydroxide intermediates. This observation suggests that the resulting product of Mg(OH)2 carbonation could be a mixture of several species, depending on the reaction conditions. In a recent study26 we observed the formation of so called oxymagnesite MgO·2MgCO3. It is therefore likely that the intermediate solid-solution behaviour, explained by Chizmeshya et al.15 can lead to incomplete carbonation at certain conditions. However, the reason for the sudden drop in MgCO3 conversion observed in our PFB experiments,8 could in fact be the result of limiting pore space. As carbonation proceeds, pore volume (i.e. porosity) decreases until all available carbonation sites have been filled. At this point, the only reaction available is dehydroxylation (H2O is smaller than CO2 and passes easier through a carbonate layer), which is accompanied by a volume reduction that opens up some pore volume until no more Mg(OH)2 is present. It has been suggested that the continued dehydroxylation should allow for additional carbonation to take place (e.g. via translamellar cracking19), but this has not been observed to any significant extent in our PFB experiments.
Kato et al.29 assumed that the reaction of MgO with adsorbed water leads to the formation of Mg(OH)2 in accordance with:
| MgO + H2O ↔ MgO·H2O ↔ Mg(OH)2 | (9) |
Thus, for the formation of MgCO3 it should be possible to apply the same methodology (i.e. water layer formation) as discussed above for MgO carbonation, only in the case of Mg(OH)2 dehydroxylation, steam is provided intrinsically i.e. from inside the particle. It should be noted that if steam is already present outside the Mg(OH)2 particle, dehydroxylation is hindered,22 as might also be the case for high CO2 pressures.18 Therefore, the rate at which dehydroxylation and thus also carbonation takes place, might be controlled by adjusting the steam partial pressure.
Eqn (9) can be seen as a dehydroxylation reaction with an intermediate step that allows for the formation of both MgO and MgCO3 and although Mg(OH)2 dehydroxylation has been studied rather extensively in recent years,36 the exact reaction mechanism is still discussed in the literature. In our case, the best fit was found for the Ginstling–Braunstein diffusion model,37 which then was implemented together with suitable equations for the carbonation step. In addition, some case-specific parameters (fluidisation velocity and particle size fraction) that have earlier been found important8,27 were incorporated in the pre-exponential factor of the carbonation reaction and a trial and error approach was adapted to find the best fit for these semi-empirical parameters.
Altogether, four different species [MgCO3, MgO, Mg(OH)2 and MgO·H2O] were used for modelling the case of PFB carbonation using Mg(OH)2. A fifth parameter, representing the available pore volume, was also added to the model so as to describe the observed maximum conversion degree (<45% MgCO3 for DSP-Mg(OH)2). In addition, many researchers have observed that the reaction between Mg(OH)218,19,22,25 (or Ca(OH)238–40) and CO2 is intra-particle diffusion controlled, meaning that the reaction rate decreases steeply as the carbonation reaction proceeds. This phenomenon has also been observed in our Mg(OH)2 experiments (it seems that fluidisation is not able to remove the formed carbonate layer because it forms throughout the particles and not only on the surface) and a diffusion term has been incorporated into the reaction model. The model equations are:
 | (10) |
 | (11) |
 | (12a) |
 | (13) |
 | (14) |
 | (12b) |
Considering the rate of pore closure, similarly to Alvfors and Svedberg41 (but also Stendardo and Foscolo42), it could be speculated that the maximum possible conversion achievable is determined by the initial porosity of the particle in accordance with:
 | (15) |
![Maximum carbonation degree as a function of initial pore volume [eqn (15)]. Indicated is the maximum conversion degree attainable for DSP-Mg(OH)2.](/image/article/2012/RA/c2ra21428h/c2ra21428h-f5.gif) | ||
| Fig. 5 Maximum carbonation degree as a function of initial pore volume [eqn (15)]. Indicated is the maximum conversion degree attainable for DSP-Mg(OH)2. | ||
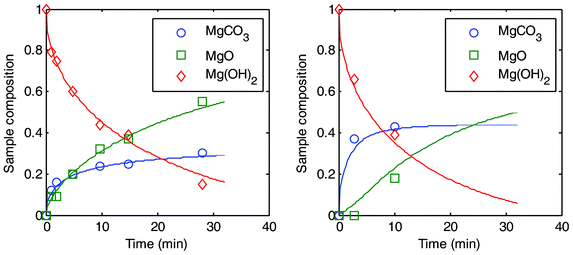 | ||
| Fig. 6 Two sets of PFB experiments plotted as a function of time. To the left: carbonation at 495 °C and 25 bar and to the right: 540 °C and 59 bar. | ||
It should be noted however, that 44% conversion can only be achieved if other conditions are favourable (such as temperature and pressure), as can be seen from Fig. 6 where two different sets of experiments have been plotted against time. For both experiments, a steady state appears to be achieved rather quickly and it can be noted that only in the case of more severe temperature and pressure conditions does the conversion level reach close to the predicted maximum of 44%.
The decrease in porosity has been modelled by assuming that the carbonation reaction continuously reduces the porosity, ε, in accordance to the hypothetical reaction equation below:
| MgO·H2O + CO2 + ε → MgCO3 + H2O | (16) |
As the reaction advances, the porosity is reduced and assumed not to be regenerated by any reverse reactions. Thus, for low porosity material, such as DSP-Mg(OH)2, carbonation quickly becomes limited by pore closure. Note that the porosity of dehydroxylated Mg(OH)2 decreases with both time and temperature.31 In other words, long reaction times at elevated temperatures might in fact inhibit further carbonation, instead of (slowly) leading to complete carbonation.
Results and discussion
The purpose of modelling the reactions between MgO/Mg(OH)2 and CO2 mixed with water is to better understand the underlying mechanisms of gas–solid carbonation. The predictive capabilities of the models presented here are obviously an important part of the objective, but the exact values of the parameters used remain uncertain until more experiments and further studies in the field have been completed.MgO carbonation
Altogether, nine representative PTGA experiments were used for parameter fitting and the results of the modelling can be seen in Fig. 7. Although the model fits the data relatively well, the model is highly dependent of a single variable, cmax, i.e. the final conversion degree. Assuming that the conversion degree is indeed dependent of the H2O pressure at the surface of the particle, cmax can be approximated (R2 = 0.99) by the following adsorption based function that incorporates both CO2 and steam pressures (in bar) as well as the temperature (in K): | (17) |
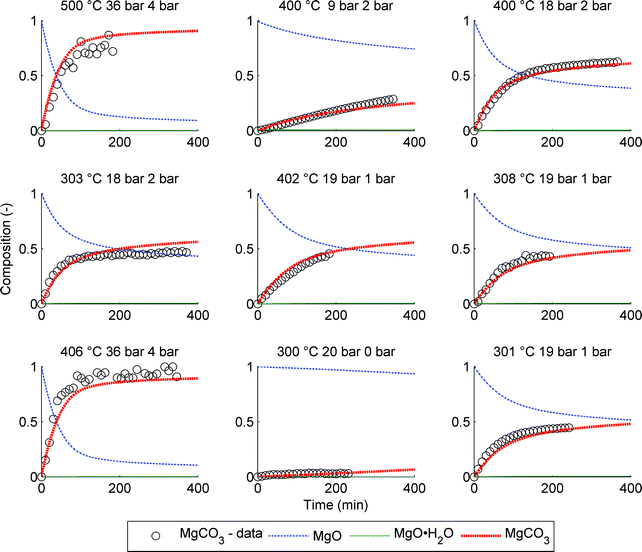 | ||
| Fig. 7 Comparison between model and PTGA data for 9 different experiments. The average conditions are given above each graph: T (°C), CO2 pressure (bar) and H2O pressure (bar). | ||
The data points in Fig. 7 have been calculated assuming that the PTGA observed weight change is due to both H2O and CO2 adsorption and reaction. However, the effect of CO2 is significantly larger, based on XRD analysis of the samples showing no species other than MgO and MgCO3 (see Fig. 10), except for the case of a low CO2 partial pressure (9 bar). In this case the final product displayed XRD peaks matching Mg(OH)2. Interestingly, the amount of predicted intermediate product (MgO·H2O) is also comparatively high for this case, indicating that the formation of Mg(OH)2 is indeed more likely compared to the other eight experiments.
One of the difficulties in modelling these particular PTGA experiments is that the starting point of the reaction is sometimes hard to determine exactly from the data. Some initiation phase, e.g. hydration, might have already taken place prior to the assumed starting point in Fig. 7, either during the lowering of the temperature towards the target value or at the point of H2O injection that preceded the temperature change. Taking this into account, the assumption that the reaction is controlled by the formation of a water layer is reasonable considering the fit quality of the model to the data.
Mg(OH)2 carbonation
Unlike the PTGA data presented above, each data-point for the PFB experiments represents the end of individual experiments performed varying a number of parameters. In other words, the data does not give the conversion degree as a function of time directly, but only the final conversion degree obtained under the given conditions. In order to display the conversion degree as a function of time, a series of experiments has to be performed under similar conditions (as shown in Fig. 6). Thus, the modelling approach adapted has also been slightly changed, the most important difference being the influence of external parameters such as particle size and fluidisation velocity. A model assuming that the final conversion degree is restricted by the particle porosity combined with diffusion control has been used [as described by eqn (10) to (14)].From Fig. 8, the results from a separate analysis of the dehydroxylation behaviour [eqn (12b)] have been compared to experimental data. The different types of data-points represent different conditions and it could be noted (indicated by the “Misc.” and “Added H2O” data in Fig. 8), that some of the experiments cannot be modelled using eqn (12). These experiments are two serpentinite-derived Mg(OH)2 experiments, two supercritical CO2 experiments, one with an unusually large sample mass (20 g vs. 4 g), one experiment performed above the temperature of MgCO3 stability and one with large particle sizes (>363 μm). In order to incorporate these experiments into the model, additional parameters would have to be added, which in turn requires additional experiments at these conditions. Particularly, particle properties, such as surface area and porosity should still be investigated. It seems that the high surface area of the serpentinite-derived samples causes the model to underestimate the dehydroxylation rate in these two cases. While in the case of the particularly large particle-size Mg(OH)2 experiment the opposite is observed, and the model overestimates the reaction rate. The results for the two supercritical condition tests and the one with a larger sample mass remain inconclusive. In the case of the experiments performed with added steam, the two most deviating samples correspond to the two highest H2O-levels, as expected. Other than that, small amounts of H2O do not seem to influence the dehydroxylation significantly.
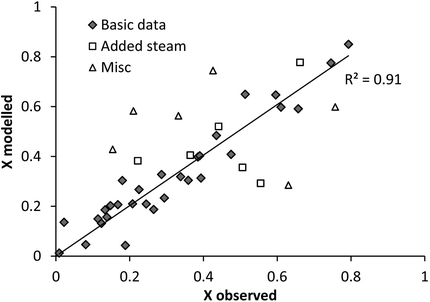 | ||
| Fig. 8 Dehydroxylation model vs. observed Mg(OH)2 data for PFB carbonated samples. | ||
Because dehydroxylation and carbonation are inherently coupled, the rate at which MgO·H2O is formed determines the maximum carbonation rate. If the temperature for Mg(OH)2 dehydroxylation is not exceeded, carbonation is likely to be almost completely inhibited in dry CO2, but not if steam is added. This was confirmed by a PTGA experiment performed at 250 °C and 40 bar CO2 which did not result in significant carbonate conversion (the dehydroxylation temperature for Mg(OH)2 at 1 bar H2O is around 260 °C). On the other hand, if the rate of dehydroxylation is much higher than that of carbonation, MgO is the formed product instead of MgCO3. At low temperatures, carbonation is quickly limited by diffusion and a high conversion degree (assuming sufficient porosity) is never reached, while higher temperatures increase diffusivity and thus enable higher conversion degrees, assuming that excessive dehydroxylation is prevented and that the thermodynamic limit for MgCO3 stability is not exceeded.
The influence of CO2 pressure is two-sided; on one hand it reduced the dehydroxylation rate, which evidently affects carbonation, but on the other hand it also increased the conversion rate of MgO·H2O to MgCO3. Similarly, H2O reduced the rate of dehydroxylation, but at the comparatively low H2O partial pressures considered, the influence on carbonation is small. Still, some PH2O is needed to prevent (too) rapid calcination to MgO. Apparently, a sensitive balance between reactivity and achieving a high conversion degree exists.
The results of the PFB modelling can be seen in Fig. 9, and it is evident that the model given by eqn (10) to (14) is unable to capture all the variations in the data. The dotted lines represent 10%-points deviations from a perfect fit. One drawback is the small number of experiments at higher steam pressures made so far as this has been shown to influence the reactions (see Fig. 8). On the other hand, large fractions of steam in the input gas are not attractive from a CCS point of view and an increasing PH2O should result from the dehydroxylation of Mg(OH)2, i.e. the carbonation process itself.
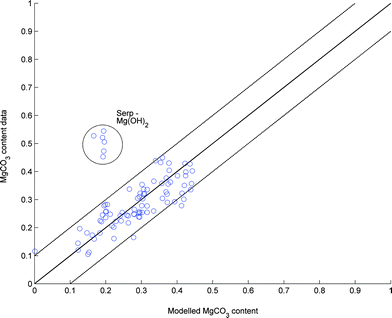 | ||
| Fig. 9 Modelled vs. observed MgCO3 content of various PFB experiments. | ||
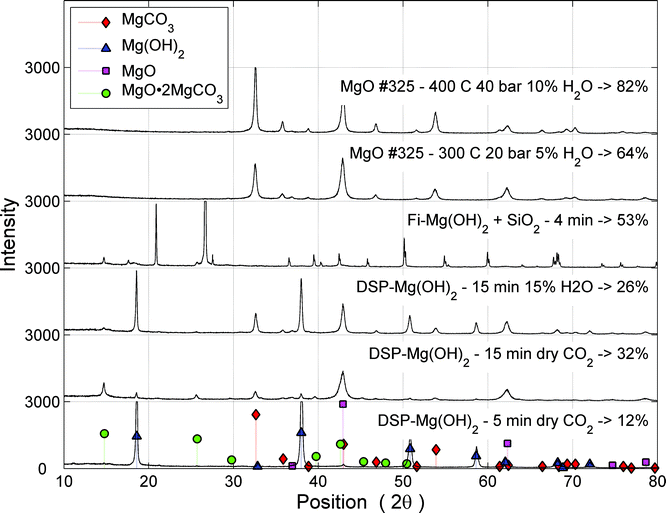 | ||
| Fig. 10 XRD scans of various carbonation experiments. The two topmost experiments were performed using a PTGA (around 2 h), while the rest were subjected to carbonation in a PFB (<15 min). | ||
From Fig. 9 it can be seen that the serpentinite-derived Mg(OH)2 samples were much more reactive than predicted by the model. The explanation for this can be found in the difference between particle surface area and porosity,43 which are much larger for the serpentinite-derived Mg(OH)2. Due to the small number of experiments performed with serpentinite-derived Mg(OH)2 particles, the influence of surface area has not been incorporated into the model, but it should be noted that the serpentinite-derived particles are not carbonation limited by pore space availability. However, the competition between MgO and MgCO3 formation might still prevent complete carbonation.
Using X-ray diffractogram (XRD) analysis on a partially carbonated Mg(OH)2 sample, it can be seen that a significant fraction of the material has formed so called magnesium oxide carbonate (MgO·2MgCO3).28 Compared to MgCO3 this carbonate can bind less CO2 per unit of Mg or more precisely the CO2 storage capacity of magnesium oxide carbonate is only 67% compared to MgCO3. This explains the comparatively low carbonation levels achieved in the PFB experiments to some extent, but even for the best results using DSP-Mg(OH)2 (45%), some 20% of uncarbonated material remains in the samples, which suggests pore closure to be the limiting factor. The role of oxymagnesite formation has not been considered in the modelling work performed here, as it is assumed to form as a result of restructuring between MgO and MgCO3 in the absence of water. Thus, the final product would still contain the same amount of MgO and MgCO3 as what the analysis gives. From Fig. 10 it can be seen that oxymagnesite is formed in dry or mildly humid carbonation conditions using a PFB, while its presence is not detected (because its formation is prevented) when the H2O fraction was increased to 15%-vol. Also for very short reaction times, MgO and oxymagnesite formation seems to be avoided, indicating that the carbonation reaction is more susceptible to inhibition than the dehydroxylation reaction. The reason for this could be in the fact that a water molecule is considerably smaller than a CO2 molecule, enabling it to penetrate a carbonate layer much easier than CO2. Furthermore, in contrast to the case of MgO carbonation, CO2 and water are diffusing in opposite directions of the dehydroxylating Mg(OH)2 particle, making the H2O–CO2 interaction at the particle surface more difficult. It has been suggested that a high external gas pressure can increase the H2O pressure at the surface thereby slowing down the dehydroxylation process.19
The two topmost plots in Fig. 10 show the results of carbonation experiments using a PTGA and the absence of magnesium oxide carbonate is evident. In the case of serpentinite-derived Mg(OH)2 (third plot from the top), the XRD plot is disturbed by the presence of SiO2 that was used during the PFB experiment. However, it is still possible to distinguish the formation of oxymagnesite from the graph, but hardly any of the other species indicated by the legend in Fig. 10.
Mg(OH)2 carbonation using a PTGA
Results from a set of ten carbonation tests in a (vertical) PTGA with the DSP-Mg(OH)2 sample (75–125 μm, gas phase CO2/H2O 99/1 vol./vol., time 6 h) have been reported earlier, giving the final degree of conversion of the magnesium content to MgCO3, as in Table 2. See Ref. 7,25 where also the test set-up and procedures are described. The reported conversion to MgCO3, is based on chemical analysis of the final samples, and as mentioned in the earlier report, there was a discrepancy between the final sample composition and the weight vs. time curves from the PTGA, assuming that only the reaction in eqn (1) occurred [the H2O pressure being too high for Mg(OH)2 calcination via the reverse reaction in eqn (5)]. For the purpose of the current paper, these PTGA data have been analysed again, checking for the conversion of Mg(OH)2 to other species than MgCO3, aiming at a better match between the weight vs. time curves from the PTGA and the chemical analysis of the final product. The result of this is given in Table 2.| Pressure/bar | Temp./°C | Conv. to MgCO3 (%) | Conv. to MgO (%) | Unreacted Mg(OH)2 (%) |
|---|---|---|---|---|
| a Normalised to MgCO3 + MgO + Mg(OH)2 = 100%. | ||||
| 1 | 370 | 6.6 | 20.9 | 72.5 |
| 12 | 460 | 18.6 | 25.7 | 55.7 |
| 35 | 495 | 49.8 | 41.8 | 8.4a |
| 35 | 510 | 46.2 | 47.5 | 6.3a |
| 35 | 525 | 43.7 | 52.7 | 3.6a |
| 35 | 540 | 42.7 | 52.9 | 4.4a |
| 40 | 510 | 59.9 | 27.9 | 12.2a |
| 40 | 525 | 37.3 | 47.2 | 15.5 |
| 40 | 540 | 39.7 | 47.2 | 13.1 |
| 45 | 525 | 44.2 | 47.6 | 8.2 |
The results in Table 2 show a considerable effect of conversion to MgO, with the relative conversion of MgCO3/MgO giving somewhat better results at 35 bar than at higher pressures, giving also the lowest values for unreacted Mg(OH)2 after the six hours. The result of 59.9% conversion to MgCO3 at 40 bar, 510 °C is exceptionally high and may contain a significant error, as also the corresponding numbers for Mg(OH)2 and MgO content deviate from the trends seen in the table otherwise. (Also, as discussed above, based on pore structure, a value of ∼44% conversion to MgCO3 is a maximum for this material.) The tests at 1 bar and 12 bar allow for maximum temperatures where conversion of Mg(OH)2 is obviously too slow, while 35 bar appears to be a level where little advantage is gained by further pressurisation and the increased temperature this then allows for. The strong formation of MgO indicates that contact between the gas and solid phases is such that a chemical equilibrium calculation; which implicitly also implies phase equilibrium, is not successful in predicting the final outcome.
Carbonation versus dehydration
In our experiments8,27 different types and size-fractions of Mg(OH)2 have been subjected to various pressure, temperature and fluidisation conditions, but the results have shown remarkably similar behaviour in most cases as can be seen from Fig. 11 and XRD scans of the final product (see Fig. 10).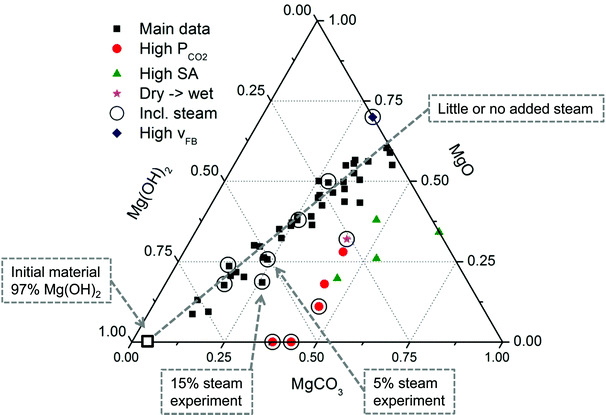 | ||
| Fig. 11 Ternary diagram of Mg(OH)2 carbonation experiments performed using a PFB at various temperature and pressure conditions. The red dots represent experiments where steam was added to the CO2 stream.28 | ||
The seemingly linear trend observed for the main portion of the data in Fig. 11 is interesting when noting the different experimental conditions that are represented. The only restriction being that the temperature was kept below the equilibrium temperature of MgCO3 stability. Thus, it is likely that (for the Main data) the data represents a kind of steady state where no further reactions take place. The experiments that deviate from this apparent trend are indicated by the legend in Fig. 11 and consist of higher than normal (>40 bar) pressure experiments, high surface area Mg(OH)2 experiments, one experiment of unusually high fluidised bed velocity (vFB) and one experiment that was first carbonated in dry CO2 and then in humid CO2. Experiments that have included steam are indicated by circles. Interestingly, two of the experiments resulted in a very low MgO content, suggesting that rapid carbonation (<10 min) can be achieved without further loss of reactive Mg(OH)2. However, these particular experiments were performed using DSP-Mg(OH)2, which seems to be limited to around 45% conversion. This is interesting, since previous studies20 have achieved much higher carbonation degrees under similar reaction conditions. On the other hand, other studies19 also show even lower carbonation degrees for the same or similar temperature and pressure conditions. One key observation between all these experiments is the type of Mg(OH)2 used and as explained previously, the higher the surface area the faster the reactions. In addition, the initial porosity needs to be sufficiently high, so as to prevent MgCO3 from completely filling the available porosity. Continued carbonation could result from dehydroxylation of the remaining Mg(OH)2, but, as seen from Fig. 11, this has not been the case using a PFB and DSP-Mg(OH)2. The high surface area Mg(OH)2 experiments consist of serpentinite-derived Mg(OH)2 and show the importance of material properties. Still, more experiments are needed to find the optimum conditions between reactivity and kinetics.
Assuming that the dehydroxylation and carbonation reactions are linked, the dehydroxylation rate in a PFB can be accelerated more than the carbonation rate resulting in partial carbonation. In other words, the passing (dry or mildly humid) CO2 stream effectively dries out the particles before CO2 interaction can take place (see High vFB experiment in Fig. 11). Obviously this does not prevent partial carbonation, but the trend line suggests that diffusion quickly becomes rate-limiting and, based on shorter time experiments, MgCO3 formation is hindered prior to dehydroxylation. Thus, it seems that controlling the Mg(OH)2 particle properties is the key to fast and complete carbonation, keeping in mind that also dehydroxylation becomes faster with increasing particle surface area.
One solution to this problem seems to be adding steam to the passing CO2, reducing the dehydroxylation rate, but the amount of steam required is still unclear. According to the dehydroxylation-model presented here [eqn (12b)], small amounts (around 1%) of steam do not influence the rate significantly, but it is more evident that higher amounts do [favours the reverse reaction in eqn (2)]. In a PTGA this effect is evidently less pronounced as the particles (when sufficiently small) have time to react (and do so much slower) with the CO2 before the H2O evaporates.
Another option to increase the final conversion degree could be alternating between dry and humid CO2. The purpose of this being to keep the fast initial kinetics of Mg(OH)2 carbonation in dry CO2 after which humid CO2 would enable the “inert” MgO to “reactivate” and form carbonates in the presence of steam (comparable to the so-called LIFAC process for flue gas desulphurisation). However, based on preliminary experiments, the effect of low steam pressures (<2.5%) is negligible in enhancing the carbonation of initially dry-carbonated samples. The reason for this could be that the elevated temperatures result in sintering of the remaining partly carbonated particles, greatly reducing the available reactive surface area.
Conclusions
The purpose of this study and all the previous mineral carbonation studies has been to find a way to effectively bind CO2 as a mineral carbonate. In our studies the purpose has been to accelerate the carbonation of Mg(OH)2 to such an extent that the heat of the carbonation reaction could be utilised to drive the pressurised fluidised bed reactor and to some extent the preceding pre-treatment steps [production of Mg(OH)2 from Mg silicate rock].Although the reactivity of MgO and Mg(OH)2 towards CO2 have been found very different, the factor that brings the two species together is water. Steam enhances the reactivity of MgO, while Mg(OH)2 is enhanced by the presence of intrinsic H2O. Using a fluidised bed for the carbonation of Mg(OH)2 was based on the assumption that a carbonate layer builds up on the surface of the reacting particles, thus hindering further carbonation. This layer could be removed by subjecting the particles to frequent collisions such as those taking place within a fluidised bed. However, it turns out that the effect of collisions is not sufficient to prevent a carbonate layer from forming on top of the particles and thus, diffusion through a carbonate layer cannot be ignored even in the case of a PFB reactor.
Besides diffusion, another effect, although less important, was found to be pore closure. Less important because it only applies to the special case of a low porosity material, such as DSP-Mg(OH)2. For serpentinite-derived Mg(OH)2 the porosity is much higher and the final conversion degree is not limited by the volume increase. For DSP-Mg(OH)2 the final conversion degree was found to level off around 45%, which correlates well with the estimated pore-closure limit. In the case of MgO conversion using a PTGA, this effect was not noticed as the initial porosity was apparently high enough for complete conversion to start with.
A clear advantage of mixing relatively large amounts of H2O with CO2 can be seen when carbonating MgO, but this is not the case when using Mg(OH)2 that requires the loss of some water before it can carbonate. Small amounts of H2O did not affect the carbonation of DSP-Mg(OH)2 significantly, but higher amounts (>5%) showed a decrease in dehydroxylation. This effect could be used to control the rate of dehydroxylation, which, if too fast, results in MgO formation rather than MgCO3. Altogether, MgO formation is more important than anticipated based on thermodynamic equilibrium calculations, presumably because not all phases (solid and gas) have perfect contact with each other.
Considering MgO carbonation, near to complete carbonation can be achieved in one hour at relatively mild conditions in a PTGA, but the particles are too fine and unattractive for use in a more industrially applicable PFB. This is also the case for using a high PH2O.
Thus, based on the observations presented here, for fast (<10 min) and near complete conversion (>90%), porous particles (>0.05 cm3 g−1) with a comparatively high surface area are required. The exact conditions have not been established, but the amount of H2O in the vapour phase, together with fluidisation velocity and particle properties (mainly surface area) is likely to determine the required pressure and temperature. The higher the surface area, the smaller the effect of intra-particle diffusion limitation and the less severe reaction conditions are required. However, the size of the particles should not be a problem to optimize if the serpentinite-derived Mg(OH)2 particles can be modified by altering the precipitation conditions.
Appendix: Thermodynamics of MgO and Mg(OH)2 carbonation
In order to assess the reaction rates of both Mg(OH)2 and MgO, carbonation is necessary to understand the thermodynamic limitations that put constraints on the reaction conditions. Butt et al.20,22 studied Mg(OH)2 carbonation using a thermogravimetric analyser (TGA) and found that dehydroxylation overwhelms carbonation at around 0.5 bar CO2, even at the optimum temperature of 375 °C (close to the thermodynamic limit of MgCO3 stability, i.e. 373 °C7 at 0.5 bar CO2 or 385 °C at 0.78 bar CO222). The thermodynamic limit for carbonation is the temperature at which MgCO3 dissociates into MgO and CO2:| MgO (s) + CO2 (g) ↔ MgCO3 (s) | (18) |
The dissociation temperature or equilibrium temperature (Teq) can be determined according to a simple CO2 partial pressure (PCO2) dependent formula (see also Ref. 7):
 | (19) |
And it has been derived from the equation relating Gibbs free energy, G, to the reaction quotient Q in accordance to:
 | (20) |
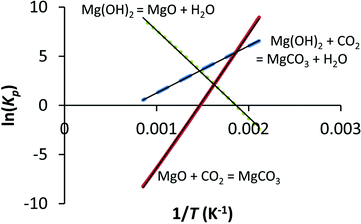
Where G is Gibbs free energy for a given temperature and pressure and R is the universal gas constant. Knowing the change in Gibbs free energy ΔG0 for a reaction (HSC 5.11 database) for a range of temperatures (200–900 °C in our case) allows one to determine the equilibrium constant KP by setting ΔG = 0 at which point Q = KP . The equilibrium constant in turn relates to the partial pressures when gases are involved. In Fig. 12 the natural logarithm of KP has been plotted against the inverse of temperature for Reactions (1), (2) and (5), and based on the linear trend lines, equations relating the equilibrium pressure [from ln(Kp)] and temperature can be derived.
In case water vapour is present, as in eqn (1), the equilibrium temperature for MgCO3 becomes a function of both CO2 and H2O partial pressures:

| (21) |
 | (22) |
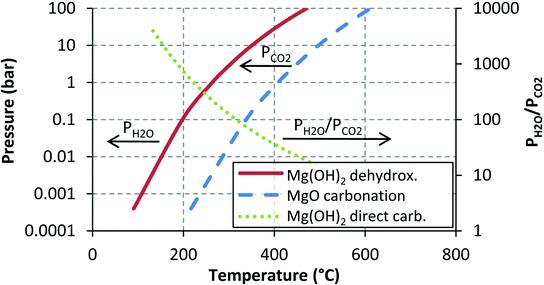
Plotting the equilibrium equations with their respective Kp values against temperature gives a set of lines that correspond to equilibrium conditions, i.e. a point at which both the forward and the reverse reactions are equally fast.
If the temperature is 400 °C and the CO2 and H2O partial pressures are (for simplicity) both 10 bar, eqn (2) predicts that MgO is favoured over Mg(OH)2, while eqn (5) predicts that MgCO3 is favoured over MgO. In the case of eqn (2), at the given conditions, the forward reaction is clearly favoured as PH2O/PCO2 = 1, which is below the dotted line. Thus, MgCO3 formation is favoured.
The most important line in Fig. 13 is that given by MgO carbonation, which gives the maximum temperature for MgCO3 stability at a given pressure. As long as the reaction conditions can be traced to the left-hand side of the MgO carbonation line, MgCO3 formation is favourable. The MgO dehydroxylation line is similar to the MgO carbonation line, but the stability of Mg(OH)2 in the presence of water vapour is some 140 °C lower (in the investigated temperature range) than that of MgCO3 in the presence of CO2. If the conditions are such that both Mg(OH)2 and MgCO3 seem favourable, eqn (1) can be used to determine the most favourable reaction product. In most cases, MgCO3 is more stable as the H2O pressure needs to be several times higher than the CO2 partial pressure in order for Mg(OH)2 to become the stable phase. This and the discussion above, however, is based on the assumption that the only species involved are those given in eqn (1), (2) and (5). In practice, this might not be the case, as has been suggested by e.g. McKelvy et al.16 who noted that there might be a whole range of intermediate carbonate hydrate magnesium compounds taking part in gas–solid carbonation reactions and even more recently we have observed that Mg(OH)2 carbonation can result in more than just simple MgO and MgCO3.26 In other words, not only can there be a significant number of oxyhydroxide intermediates,15,16,19 but the end product can also take a form different from simple MgO or MgCO3 even though chemical equilibrium thermodynamics, that also assumes perfect phase equilibrium (i.e. mixing of the phases), predicts MgCO3 formation.
Acknowledgements
The authors of this paper would like to acknowledge the Academy of Finland and its funding of the research project, Carbonates in Energy Technology (CARETECH), which was part of the Sustainable Energy programme (SusEn) during the years 2008–2011. We also acknowledge the KH Renlund foundation for support during the years 2007–2009 and the Harry Elvings legacy that enabled JF a four month research visit to Singapore in 2011. Dr Jie Bu (ICES-Singapore) is acknowledged for providing the PTGA used for our experiments and in addition, Nordkalk is acknowledged for (some) BET analyses.References
- W. Seifritz, Nature, 1990, 345, 486 CrossRef.
- R. Zevenhoven, J. Fagerlund and J. K. Songok, Greenhouse Gases: Sci. Technol., 2011, 1, 48–57 CrossRef CAS.
- R. J. Hunwick, 2008, WO2008: 101293(A1), AU2008: 000232.
- M. Werner, M. Verduyn, G. van Mossel and M. Mazzotti, Energy Proc., 2011, 4, 2043–2049 CrossRef CAS.
- K. J. Reddy, S. John, H. Weber, M. D. Argyle, P. Bhattacharyya, D. T. Taylor, M. Christensen, T. Foulke and P. Fahlsing, Energy Proc., 2011, 4, 1574–1583 CrossRef CAS.
- X. Wang and M. Maroto-Valer, Energy Proc., 2011, 4, 4930–4936 CrossRef CAS.
- R. Zevenhoven, S. Teir and S. Eloneva, Energy, 2008, 33, 362–370 CrossRef CAS.
- J. Fagerlund and R. Zevenhoven, Int. J. Greenhouse Gas Control, 2011, 5, 1406–1412 CrossRef CAS.
- E. Nduagu, T. Björklöf, J. Fagerlund, J. Wärnå, H. Geerlings and R. Zevenhoven, Miner. Eng., 2012, 30, 75–86 CrossRef CAS.
- E. Nduagu, T. Björklöf, J. Fagerlund, E. Mäkelä, J. Salonen, H. Geerlings and R. Zevenhoven, Miner. Eng., 2012, 30, 87–94 CrossRef CAS.
- K. S. Lackner, D. P. Butt and C. H. Wendt, Energy Convers. Manage., 1997, 38, 259–264 CrossRef.
- I. Romão, E. Nduagu, J. Fagerlund, L. M. Gando-Ferreira and R. Zevenhoven, Energy, 2012, 41, 203–211 CrossRef.
- H. H. Khoo, J. Bu, R. L. Wong, S. Y. Kuan and P. N. Sharratt, Energy Proc., 2011, 4, 2494–2501 CrossRef CAS.
- E. Nduagu, J. Bergerson and R. Zevenhoven, Energy Convers. Manage., 2012, 55, 116–126 CrossRef CAS.
- A. V. G. Chizmeshya, M. J. McKelvy, R. Sharma, R. W. Carpenter and H. Bearat, Mater. Chem. Phys., 2002, 77, 416–425 CrossRef.
- M. J. McKelvy, R. Sharma, A. V. G. Chizmeshya, R. W. Carpenter and K. Streib, Chem. Mater., 2001, 13, 921–926 CrossRef CAS.
- S. A. Morozov, A. A. Malkov and A. A. Malygin, Russ. J. Gen. Chem., 2003, 73, 37–42 CrossRef CAS.
- S. V. Churakov, M. Iannuzzi and M. Parrinello, J. Phys. Chem. B, 2004, 108, 11567–11574 CrossRef CAS.
- H. Béarat, M. J. McKelvy, A. V. G. Chizmeshya, R. Sharma and R. W. Carpenter, J. Am. Ceram. Soc., 2002, 4, 742–748 Search PubMed.
- D. P. Butt, S. P. Pile, Y. Park, R. Vaidya, K. S. Lackner, C. H. Wendt and K. Nomura, Report LA-UR-98-7631, 1998.
- A. Hassanzadeh and J. Abbasian, Fuel, 2010, 89, 1287–1297 CrossRef CAS.
- D. P. Butt, K. S. Lackner, C. H. Wendt, S. D. Conzone, H. Kung, Y. C. Lu and J. K. Bremser, J. Am. Ceram. Soc., 1996, 7, 1892–1898 CrossRef.
- S. Shih, C. Ho, Y. Song and J. Lin, Ind. Eng. Chem. Res., 1999, 38, 1316–1322 CrossRef CAS.
- S. F. Wu, T. H. Beum, J. I. Yang and J. N. Kim, Ind. Eng. Chem. Res., 2007, 46, 7896–7899 CrossRef CAS.
- R. Zevenhoven, S. Eloneva and S. Teir, GHGT-8, 2006 Search PubMed.
- J. Highfield, J. Bu, J. Fagerlund and R. Zevenhoven, ICCDU-XI, 2011 Search PubMed.
- J. Fagerlund, E. Nduagu, I. Romão and R. Zevenhoven, Front. Chem. Eng. China, 2010, 4, 133–141 CrossRef CAS.
- J. Fagerlund, E. Nduagu, I. Romão and R. Zevenhoven, Energy, 2012, 41, 184–191 CrossRef CAS.
- Y. Kato, N. Yamashita, K. Kobayashi and Y. Yoshizawa, Appl. Therm. Eng., 1996, 16, 853–862 CrossRef CAS.
- C. Liu and S. Shih, Ind. Eng. Chem. Res., 2009, 48, 8335–8340 CrossRef CAS.
- M. Hartman, O. Trnka, K. Svoboda and J. Kocurek, Chem. Eng. Sci., 1994, 49, 1209–1216 CrossRef CAS.
- H. Naono, Colloids Surf., 1989, 37, 55–70 CrossRef.
- V. Manovic and E. J. Anthony, Ind. Eng. Chem. Res., 2010, 49, 9105–9110 CrossRef CAS.
- D. K. Lee, Chem. Eng. J., 2004, 100, 71–77 CrossRef CAS.
- B. Khoshandam, R. Kumar and L. Allahgholi, Korean J. Chem. Eng., 2010, 27, 766–776 CrossRef CAS.
- H. Pfeiffer, Thermochim. Acta, 2011, 525, 180–182 CrossRef CAS.
- J. J. M. Órfão and F. G. Martins, Thermochim. Acta, 2002, 390, 195–211 CrossRef.
- V. Materic and S. Smedley, Ind. Eng. Chem. Res., 2011, 50, 5927–5932 CrossRef CAS.
- G. Montes-Hernandez, A. Pommerol, F. Renard, P. Beck, E. Quirico and O. Brissaud, Chem. Eng. J., 2010, 161, 250–256 CrossRef CAS.
- V. Nikulshina, M. E. Gálvez and A. Steinfeld, Chem. Eng. J., 2007, 129, 75–83 CrossRef CAS.
- P. Alvfors and G. Svedberg, Chem. Eng. Sci., 1988, 43, 1183–1193 CrossRef CAS.
- S. Stendardo and P. U. Foscolo, Chem. Eng. Sci., 2009, 64, 2343–2352 CrossRef CAS.
- J. Fagerlund, E. Nduagu and R. Zevenhoven, Energy Proc., 2011, 4, 4993–5000 CrossRef CAS.
- V. Materic, S. Edwards, S. I. Smedley and R. Holt, Ind. Eng. Chem. Res., 2010, 49, 12429–12434 CrossRef CAS.
| This journal is © The Royal Society of Chemistry 2012 |

