DOI:
10.1039/C2RA21512H
(Paper)
RSC Adv., 2012,
2, 11067-11077
Self-assembled growth of LuVO4 nanoleaves: hydrothermal synthesis, morphology evolution, and luminescence properties
Received
20th July 2012
, Accepted 18th September 2012
First published on 18th September 2012
Abstract
In the present paper, LuVO4 nanoleaves have been synthesized via a facile and low-cost complexant-assisted hydrothermal approach. The phases, morphologies, sizes, and luminescence properties of the as-prepared products were well characterized by means of XRD, FT-IR, SEM, TEM, SAED, EDX, HRTEM, PL, and CL. The results indicate that the phase, morphology, and size of the LuVO4 samples can be tuned in a controlled manner by altering the amount of Na2tar, the pH value of the initial solution, and the reaction time. The crystal growth was thoroughly investigated, and a possible formation mechanism was proposed. Upon UV and low-voltage electron beam excitation, the LuVO4:Ln3+ (Ln3+ = Eu3+, Dy3+, Sm3+, Er3+) samples exhibit bright red (Eu3+, 5D0 → 7F2), green-yellow (Dy3+, 4F9/2 → 6H13/2), orange-red (Sm3+, 4G5/2 → 6H7/2) and green (Er3+, 4S3/2 → 4I15/2) luminescence. Furthermore, the UC luminescence properties, as well as the emission mechanisms of LuVO4:Yb3+/Ln3+ (Ln3+ = Er3+, Tm3+, Ho3+) samples, were systematically investigated, which show respective green (Er3+, 4S3/2, 2H11/2 → 4I15/2), blue (Tm3+, 1G4 → 3H6) and red (Ho3+, 5F5 → 5I8) luminescence under 980 nm NIR excitation. These merits of multicolor emissions in the visible region endow this kind of material with potential applications in the field of light display systems, lasers, and optoelectronic devices.
1. Introduction
The fabrication and self-organization of inorganic materials on different scales with a special size and well-defined shapes are attracting increasing interest, the resulting materials possessing substantially enhanced properties and the potential to design new materials and devices in various fields, such as optics,1 catalysis,2 biology,3 optoelectronics4 and so forth. So, many efforts have been devoted to the design and synthesis of nano-/micro-materials with diverse morphologies and sizes, such as nanofibers,5 nanowires,6 nanorods,7 nanocubes,8 microplates,9 and hierarchical architectures,10 due to their potential applications in a wide range of fields. Mastery over the shape, dimensionality and size of nano/microcrystals not only enables control of their properties but also enhances their usefulness for a given application.11 Many methodologies including the molten-salt method, hydrothermal process, template synthesis, and high boiling solvents method have been employed widely for the synthesis of a large range of nanostructures.12–17 Among these routes, the hydrothermal method is a direct and one-step route to prepare different structured materials with high crystallinity and wide dimensions as long as chemicals and modifiers are correctly selected, and it can alter the chemical properties of reactants so that some high-temperature and/or high-pressure required reactions can be enabled under relatively mild conditions.18 As a typical solution-based approach, this method has been proven to be an environmentally acceptable process with relatively high yield of desired products. Furthermore, it has been widely recognized that the crystal growth process is not only determined by its intrinsic structure but also significantly influenced by a series of external parameters, such as pH value, reaction time, and the chelating agent. In particular, the addition of special chelating agent, which has a significant effect on the kinetics of the crystal growth, has been demonstrated to be an effective strategy to achieve control over the morphology of final products.19–21 Because of the high thermal stability and ability to form complexes with other metal ions, the sodium tartrate (Na2C4H4O6·2H2O) has a dynamic effect as the capping reagent and shape modifier by adjusting the growth rate of different facets under hydrothermal conditions, resulting in the formation of various geometries of the final products, such as Co spheres22 and hyperbranches,23 Ni nanobelts,24 hydroxyapatite hollow spheres,25 NaYF4 nanoparticles,26 CuO prickly microspheres, 27 boehmite,28 and so on.
Recently, as a series of important functional inorganic materials, rare earth (RE) compounds have been extensively studied and employed in various fields, including phosphors,29 polarisers,30 laser host materials,31 catalysis,32 solar and other functional materials based on their electronic, optical, and chemical characteristics,33 which originate from electron transitions within the 4f shell and are highly sensitive to the compositions and structures of the rare earth compounds.34–37 Among the various rare earth materials, lanthanide orthovanadates have many wonderful characteristics including good thermal, mechanical, and optical properties, and in particular they play an important role in many optical devices.38,39 Furthermore, the lanthanide orthovanadates, which possess high luminescence efficiency, have been widely applied as eminent candidates for the matrix in light phosphor powders, advanced flat panel displays, and field emission display devices.40–44 Compared with other lanthanide orthovanadates mentioned above, lutetium orthovanadates (LuVO4), owing to their higher absorption cross section than YVO4 at 880 nm,45 have been considered as promising host matrices for the substitution of lanthanide ions to produce high-power optical systems.46 As a result, considerable efforts have been paid to the fabrication of LuVO4 based phosphors with excellent luminescence properties. You et al. successfully synthesized octahedral LuVO4:Ln3+ (Ln3+ = Eu3+, Sm3+, Dy3+, Er3+) microcrystals through a designed two-step hydrothermal method.47 Rekha Rao and et al. reported zircon phase LuVO4 with Lu2O3 and V2O5 as starting materials by solid state reaction.48 Lin et al. have synthesized LuVO4 nanoparticles by a novel general and facile ultrasonic irradiation method.49 These diverse preparations of LuVO4 crystals bring promising potential applications to the field of luminescence. However, current reports on the fabrication of LuVO4 crystals still lack simultaneous control over size, phase, dimension and morphology. Furthermore, study of the mechanisms of the morphology and dimension evolution of the LuVO4 nanocrystals is also scarce, which may give us a further understanding of the nucleation and growth process of crystals of orthovanadates.
In the present work, we describe a template-free, aqueous-phase process for the synthesis of uniform LuVO4 nanoleaves with high monodispersity via a facile and mild hydrothermal process. The sodium tartrate was introduced into the reaction system to govern and adjust the morphology of the products. The effects of sodium tartrate content, pH value of the initial solution, and reaction time of the crystal morphology have been investigated in detail. XRD, SEM and TEM were used to characterize these samples in detail and a possible formation mechanism for the evolution of the crystal dimension was also proposed. In addition, the DC luminescence properties of LuVO4:Ln3+ (Ln3+ = Eu3+, Dy3+, Sm3+, Er3+) samples, and the UC luminescence properties of LuVO4:Yb3+/Ln3+ (Ln3+ = Er3+, Tm3+, Ho3+) are investigated.
2. Experimental section
2.1 Materials
All the chemicals were of analytical grade and were used as received without further purification. Eu(NO3)3, Dy(NO3)3, Sm(NO3)3, Ho(NO3)3, Er(NO3)3, Tm(NO3)3, Yb(NO3)3, and Lu(NO3)3 aqueous solutions were obtained by dissolving Eu2O3 (99.99%), Dy2O3 (99.99%), Sm2O3 (99.99%), Ho2O3 (99.99%), Er2O3 (99.99%), Tm2O3 (99.99%), Yb2O3 (99.99%), and Lu2O3 (99.99%) (Changchun Applied Chemistry Science and Technology Limited, China) in dilute HNO3 solution under heating until the pH value reached 2–3.
2.2. Preparation
In a typical procedure, 0.2 g Na2C4H4O6·2H2O (labeled as Na2tar) was first dissolved in 15 mL deionized water. Then Lu(NO3)3 (0.95 mmol) in aqueous solution with a total volume of 5 mL was then added into the obtained solution to form a chelate lanthanum complex. After vigorous stirring for 30 min, 1 mmol Na3VO4·12H2O in 15 mL deionized water was added into the solution under vigorous magnetic stirring. The pH value of the solution was adjusted to 10 with 1 M sodium hydroxide solution. The resultant solution was then transferred into a 50 mL autoclave and maintained at 180 °C for 24 h. Finally, the autoclave was cooled to room temperature naturally. The precipitates were separated by centrifugation, followed by washing with deionized water and ethanol several times. The final product was dried at 60 °C in air for 12 h.
Different pH values (6, 8, and 9), and different contents of Na2C4H4O6 to Lu3+ (0, 0.1, 0.3, and 0.4 g), and reaction times (1 h, 5 h, 12 h, and 24 h), were selected to investigate the effects of these factors on the morphologies and dimension of the as-prepared samples, while other reaction parameters remained unchanged. LuVO4:Ln3+ (Ln3+ = 5 mol% Eu3+, 5 mol% Dy3+, 5 mol% Sm3+, and 5 mol% Er3+) and LuVO4:20 mol% Yb3+/Ln3+ (Ln3+ = 2 mol% Er3+, 0.2 mol% Tm3+, 0.4 mol% Ho3+) samples were prepared in a similar procedure except that the corresponding Eu(NO3)3, Dy(NO3)3, Sm(NO3)3, Er(NO3)3, Yb(NO3)3, Er(NO3)3, Tm(NO3)3, and Ho(NO3)3 together with Lu(NO)3 were added as the starting materials, as described above.
2.3. Characterizations
Powder X-ray diffraction (XRD) measurements were performed on a Rigaku-Dmax 2500 diffractometer with Cu-Kα radiation (λ = 0.15405 nm). Fourier transform infrared (FTIR) spectra were measured with a Perkin-Elmer 580B infrared spectrophotometer with the KBr pellet technique. The morphologies and composition of the as-prepared samples were inspected on a field emission scanning electron microscope (FESEM, S4800, Hitachi) equipped with an energy-dispersive X-ray spectrum (EDX, JEOL JXA-840). Low- to high-resolution transmission electron microscopy (TEM) was performed using FEI Tecnai G2 S-Twin with a field emission gun operating at 200 kV. Images were acquired digitally on a Gatan multiple CCD camera. The PL excitation and emission spectra were recorded with a Hitachi F-7000 spectrophotometer equipped with a 150 W xenon lamp as the excitation source. The cathodoluminescent (CL) measurements were carried out in an ultrahigh-vacuum chamber (<10−8 torr), where the samples were excited by an electron beam at a voltage range 1–5 kV with different filament currents, and the spectra were recorded on an F-7000 spectrophotometer. The UC emission spectra were obtained using a 980 nm laser from an OPO (optical parametric oscillator, Continuum Surelite, USA) as the excitation source and detected by a photomultiplier tube (HAMAMATSU R955) from 400 to 900 nm. All measurements were performed at room temperature.
3. Results and discussion
3.1. Phase, structure, and morphology
Fig. 1 shows the XRD patterns of the LuVO4 and LuVO4:Eu3+ samples prepared at 180 °C for 24 h with 0.2 g Na2tar at a pH value of 10. It can be seen that all the diffraction peaks of the samples can be readily indexed to a pure tetragonal phase of LuVO4 (space group: I41/amd) according to the JCPDS file No. 17-0880 (a = b = 7.0243 Å and c = 6.2316 Å). The well-resolved diffraction peaks, no peaks shifts, and other impurity phases appear, indicating the high crystallinity and purity of the products. But, there are peak shifts after Eu3+ doping into LuVO4 compared to the XRD pattern of pure LuVO4. This also confirms that the Eu3+ ions have been effectively built into the host lattice. All the diffraction peaks of the Eu3+ doping sample have a slight shift to lower angles compared to the XRD pattern of pure LuVO4. This is because the Eu3+ ion has bigger radius than the Lu3+ ion (1.07 Å for Eu3+vs. 1.00 Å for Lu2+). In addition, the doping effects of Eu3+ on the structure of LuVO4 were investigated by determining the lattice parameters. Pure LuVO4 gives the lattice parameters a = 7.0243 Å, c = 6.2316 Å and unit cell volume V = 307.47 Å3. When the Eu3+ ions are incorporated into LuVO4, the cell volume becomes larger, and the lattice parameters are a = 7.0249 Å, c = 6.2318 Å and unit cell volume V = 307.27 Å3. In addition, the strain parameters (ε)50,51 for the as-prepared samples at different pH, duration and amount of Na2tar are calculated and listed in Table 1.
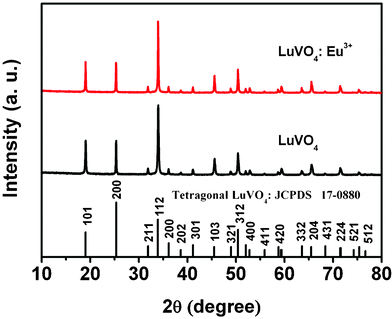 |
| | Fig. 1 XRD patterns of LuVO4 and LuVO4:Eu3+ samples prepared at 180 °C for 24 h with 0.2 g Na2tar at a pH value of 10, and the standard data for LuVO4 (JCPDS No. 17-0880) as a reference. | |
Table 1 Strain values of LuVO4 products prepared under various conditions
| Product |
Strain value |
| pH = 7, Na2tar = 0.2 g |
0.2742 |
| pH = 8, Na2tar = 0.2 g |
0.3700 |
| pH = 9, Na2tar = 0.2 g |
0.0365 |
| pH = 10, Na2tar = 0.2 g |
0.0326 |
|
t = 1 h, Na2tar = 0.2 g, pH = 10 |
0.0420 |
|
t = 5 h, Na2tar = 0.2 g, pH = 10 |
0.0390 |
|
t = 12 h, Na2tar = 0.2 g, pH = 10 |
0.0350 |
| Na2tar = 0 g, pH = 10 |
0.0544 |
| Na2tar = 0.1 g, pH = 10 |
0.0590 |
| Na2tar = 0.3 g, pH = 10 |
0.0629 |
| Na2tar = 0.4 g, pH = 10 |
0.0313 |
Fig. 2A shows the crystal structure of LuVO4, which was built using standard LuVO4 structural parameters from the ICSD File No. 78083 (Inorganic Crystal Structure Database) data. LuVO4 has a tetragonal zircon structure (Wakefieldite type, space group I41/amd), similar to that of YVO452 and GdVO4.53 This type of structure is composed of a chain of alternating edge-sharing VO4 tetrahedral and LnO8 triangular dodecahedra parallel to the c axis, which is joined laterally by edge-sharing LnO8 dodecahedra (the point symmetry of Ln3+ is D2d). To further confirm the formation of the LuVO4 crystal structure, Fourier transform infrared (FTIR) spectroscopy was performed on the as-prepared LuVO4 sample, as illustrated in Fig. 2B. A strong absorption band at 952, 797 cm−1 and a weak band at 458 cm−1 can be attributed to the adsorption of the V–O (from the VO43− group) and Lu–O bonds, respectively.54 This implies that the crystalline LuVO4 phase has formed in the as-prepared particles. The broad absorption band located at 3422 cm−1 can be ascribed to the O–H stretching vibration of water. The bands at 1603 and 1400 cm−1 can be assigned to the asymmetric (vas) and symmetric (vs) stretching vibrations of the carboxylic group (–COO−), respectively.55 Although the as-prepared sample was washed several times with water and ethanol, there were still some organic molecules sodium tartrate (Na2tar) on the surface of the particles.
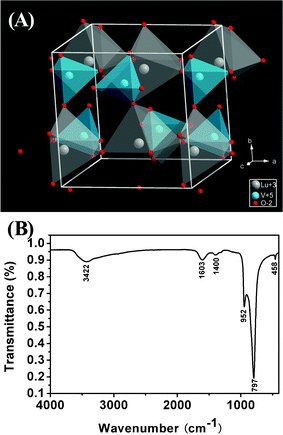 |
| | Fig. 2 Simulated crystal structures of tetragonal LuVO4 (A), and the FT-IR spectrum (B) of LuVO4 sample. | |
More structural information and compositions of the LuVO4 sample were well examined by SEM, TEM, HRTEM, SAED and EDX. As evident from Fig. 3A, the products are well-defined nanoleaves with a rhombic-like morphology. The average length is determined to be about 1.2 μm, measured on the basis of SEM images for about 50 particles. The thickness of the plates is about 50 nm, as determined from those plates that are perpendicular to the conducting resin in the SEM image. The edges and corners of such nanoleaf products seem to be sharp with a raised center (Fig. 3B). The TEM images (Fig. 3C) also confirm the morphology of the nanoleaves in the sample, corresponding well with the above SEM results. In the HRTEM image (Fig. 3D), the obvious lattice fringes confirm the high crystallinity of the sample. The distance of 0.352 nm between the adjacent lattice fringes agrees well with the d200 spacing (0.351 nm) of tetragonal-phased LuVO4 (JCPDS No. 17-0880, a = b = 7.0243 Å and c = 6.2316 Å). Furthermore, the selected area electron diffraction (SAED) pattern (inset in Fig. 3D) exhibits a large and homogeneous regular diffraction dot array, which indicates the single crystalline feature of the synthesized LuVO4. The chemical composition of these nanoleaves was further determined by EDX, as shown in Fig. 3E. The signals of lutetium (Lu), vanadium (V), and oxygen (O) suggest the presence of the corresponding element in the product (the carbon and copper signal is due to the carbon-coated copper grid used). Moreover, the atomic ratio of O![[thin space (1/6-em)]](https://www.rsc.org/images/entities/char_2009.gif) :
:![[thin space (1/6-em)]](https://www.rsc.org/images/entities/char_2009.gif) V
V![[thin space (1/6-em)]](https://www.rsc.org/images/entities/char_2009.gif) :
:![[thin space (1/6-em)]](https://www.rsc.org/images/entities/char_2009.gif) Lu is 3.97
Lu is 3.97![[thin space (1/6-em)]](https://www.rsc.org/images/entities/char_2009.gif) :
:![[thin space (1/6-em)]](https://www.rsc.org/images/entities/char_2009.gif) 1.06
1.06![[thin space (1/6-em)]](https://www.rsc.org/images/entities/char_2009.gif) :
:![[thin space (1/6-em)]](https://www.rsc.org/images/entities/char_2009.gif) 1, which approximately corresponds to the stoichiometric value of LuVO4 (4
1, which approximately corresponds to the stoichiometric value of LuVO4 (4![[thin space (1/6-em)]](https://www.rsc.org/images/entities/char_2009.gif) :
:![[thin space (1/6-em)]](https://www.rsc.org/images/entities/char_2009.gif) 1
1![[thin space (1/6-em)]](https://www.rsc.org/images/entities/char_2009.gif) :
:![[thin space (1/6-em)]](https://www.rsc.org/images/entities/char_2009.gif) 1).
1).
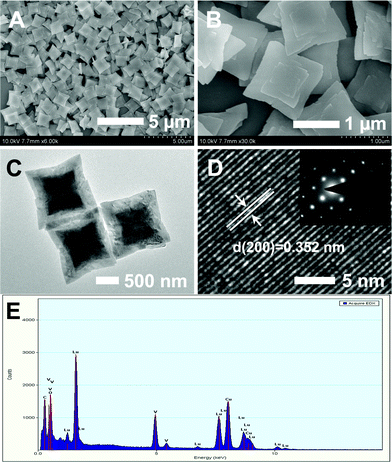 |
| | Fig. 3 SEM (A, B), TEM (C), HRTEM (D) images, and EDX spectrum (E) of the as-prepared LuVO4 nanoleaves. The inset of (D) is the corresponding SAED pattern taken from a single nanoleaf. | |
3.2. Effect of factors on morphology and dimension
In previous reports, the effects of different reaction parameters in a hydrothermal system on the size and morphology of other products have been discussed.56–63 In the present work, some reaction conditions, including the pH value of the initial solution, Na2tar content and hydrothermal time have been investigated in detail. The results indicate that products with various morphologies and dimensions can be obtained by tuning the conditions mentioned above, which will be discussed in the following paragraphs.
Effect of the pH value of the initial solution
Fig. 4A shows the XRD patterns of LuVO4 prepared at 180 °C for 24 h with 0.2 g Na2tar at pH values of 6, 8, and 9, respectively. It can be seen that all the diffraction peaks in the three patterns can be readily indexed into the tetragonal lutetium orthovanadates (JCPDS No. 17-0880) and no trace of additional peaks from other phases coupled with the doped component can be detected, implying that the three samples are of high purity and crystallinity. Moreover, it can be obviously seen that the diffraction peaks of samples at higher pH values (pH = 9) are sharper than those at a low pH value (pH = 6 and 8), suggesting the enhanced crystallinity of the samples. This is important for phosphors, because high crystallinity generally means fewer traps and stronger luminescence. It is worth noting that the XRD patterns also indicate that there are some differences in the relative intensities based on (101), (200), (112) and (103) for the samples, indicating the possibility of different preferential growth orientation under different pH conditions.64 The SEM images of the LuVO4 crystals prepared at different pH values are also given in Fig. 4B–D. As shown, when the pH value of the solution is 6 (Fig. 4B), the morphology of the final product is irregular aggregation. When the pH value is increased to 7, nanoerythrocyte-like hierarchical nanostructures which are spherical and biconcave with a diameter of around 1.2 μm are detected (Fig. 4C). As for the sample prepared at pH 9, a similar structure to that prepared at pH 10 can be observed (Fig. 4D). However, the sample prepared under this condition exhibits irregular plates. On the basis of the above analysis, it can be inferred that, in the present system, the effect of the Na2tar is greatest at alkaline pH. Therefore, we selected a pH value of 10 to carry out the following research.
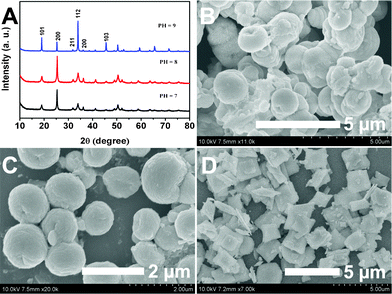 |
| | Fig. 4 XRD patterns (A) and SEM images of the samples obtained at 180 °C for 24 h with 0.2 g Na2tar and different pH values (B: 7; C: 8; D: 9). | |
Effect of the Na2tar content
Na2tar is an efficient chelating reagent, which has been reported to regulate the morphology and size of the products in the hydrothermal system.22–28 In the present system, Na2tar also plays an important role in the growth process of tetragonal LuVO4 crystals with different morphologies and dimensions. Therefore, LuVO4 samples have been prepared with different contents of Na2tar (0 g, 0.1 g, 0.3 g, 0.4 g) at 180 °C for 24 h and the pH value was maintained at 10. From the XRD patterns of the samples obtained at different contents of Na2tar, one can see that the change of reaction conditions has little effect on the purity of the phase structure of the products: all of them remain in the tetragonal phase LuVO4 (Fig. 5A). However, the morphologies of the products change a lot with the variation of the content of Na2tar. Without the use of Na2tar, many much smaller irregularly shaped nanoparticles can be observed (Fig. 5B), and the average size of the nanoparticles is about 100 nm. When a small quantity of Na2tar was added into the reaction system (Na2tar = 0.1 g), two-dimensional irregular nanoplates can be found in the SEM image (Fig. 5C). In this case, the crystal with plate-like morphology displays a shorter length compared with that prepared with the content of Na2tar at 0.2 g (Fig. 5D). As a chelating agent, Na2tar can combine with the Lu3+ ions to form the Lu3+–tar2− complex in the initial solution. This complex helps to separate the nucleation and growth stages through the controlled release of Lu3+ ions. Therefore, limited LuVO4 nuclei are formed and the aggregation process is promoted relatively. In the present system, Na2tar not only decreases the nucleation rate but also interferes with the direction of the LuVO4 crystal growth by capping the crystal surfaces. The LuVO4 crystal can only grow adequately along the axial direction so that the growth rate on the specified crystal faces of the limited nuclei should be relatively increased, resulting in 2D nanoplates. Moreover, due to its multi-hydrophilic nature, Na2tar can also cap the side surfaces of the nanoplates and prevent further aggregation to give better dispersibility. When the content of Na2tar is increased to 0.3 g, the thickness of the sample increased (Fig. 5E). As the amount of Na2tar is increased to 0.4 g, a three-dimensional (3D) pancake-like structure can be obtained (Fig. 5F). The rough surface and evident boundaries of the obtained 3D pancake-like patterns indicate that an individual architecture is composed of many thin nanoplates of 35 nm in thickness, and these original nanoplates are self-assembled into an integrated structure along the longitudinal axis direction through face-to-face attachment. From the morphological evolutions discussed above, we can conclude that organic additive Na2tar has an important influence on the morphologies of the final products in our current synthesis.
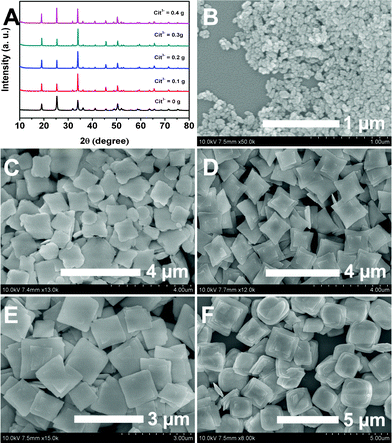 |
| | Fig. 5 XRD patterns (A) and SEM images of the samples obtained at 180 °C for 24 h with different amounts of Na2tar and a pH of 10 (B: 0 g; C: 0.1 g; D: 0.2 g; E: 0.3 g; F: 0.4 g). | |
Effect of the reaction time
In order to further understand the formation and evolution of LuVO4 nanoleaves, time-dependent experiments on the morphologies of the products were conducted. Fig. 6 shows the SEM images of LuVO4 nanoleaves (Na2tar = 0.2 g, pH = 10) prepared at 180 °C with different reaction times. In our reaction system, Na2tar lowers the concentration of Lu3+ ions by chelation and thus decreases the nucleation rate and the growth rate of LuVO4. Moreover, Na2tar could selectively adsorb on the crystal surface and interfere with the growth direction of the LuVO4 crystals. For the sample prepared at a reaction time of 1 h (Fig. 6A), nanoplates with wide particle size distribution and irregular morphology are found. With the increase of the reaction time to 5 h (Fig. 6B), some irregular nanoplates with increased length and width are achieved. When the reaction time is increased to 12 h, these incomplete nanoplates evolve into nanoleaves (Fig. 6C). When the reaction time was prolonged to 24 h, the products turned into a uniform nanoleaf morphology (Fig. 6D).
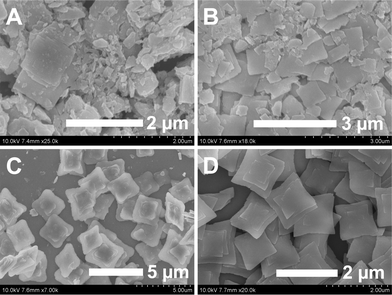 |
| | Fig. 6 SEM images of the samples obtained at different reaction times with 0.2 g Na2tar at a pH value of 10 (A: 1 h; B: 5 h; C: 12 h; D 24 h). | |
Formation mechanism for the LuVO4 nanoleaves
On the basis of the above analysis, we can confirm that the growth of the LuVO4 nanoleaves is directly related to the function of the organic molecules (Na2tar). Laudise et al.65,66 claimed that the growth of crystals is related to the relative growth rate of different crystal facets, and the difference in the growth rates of various crystal facets results in a different shape of the crystallite. In a solution-phase synthesis, organic additives acting as capping agents can change the order of the free energies of different facets through their interaction with the metal surface. This alteration may significantly affect the relative growth rates of different facets. Enlightened by our experimental results and the previous reports,67,68 a plausible process for the self-assembly of the LuVO4 nanoleaves is shown in Scheme 1. At first, Na2tar reacts with Lu3+ to form Lu3+–tar2− complexes. According to LaMer's model, the formation of such complexes could control the concentration of free Lu3+ ion concentration in solution and thus help to control the nucleation and growth of the crystals in view of the dynamic process.69 Then under hydrothermal conditions (high temperature and pressure), the chelating of the Lu3+–tar2− complex is attacked by VO43−, and Lu3+ would be released gradually. This process can slow down the nucleation and subsequent crystal growth of precursor particles. Then, tar2− anions possibly bind selectively to the active (001) facet of growing precursor nanoparticles. Thus, the crystal growth along the [001] direction is confined, and it grows preferentially along the [100] and [010] directions. This kinetic control leads to the formation of the original nanoflakes with preferential growth directions. To sum up, Na2tar species may have a double effect on the growth of the LuVO4 nanoleaves. First, as a strong ligand, it can form a stable complex with Lu3+ ions, which slows down the nucleation and subsequent crystal growth of the LuVO4 nanoleaves. Second, Na2tar acts as a structure-directing reagent binding to the surface of crystals, which directly affects the growth of different crystal facets by adjusting the growth rate of different facets, resulting in the formation of the nanoleaves. In fact, the mechanism for the formation of nanoleaf structures is very complicated, because several factors, including crystal-face attraction, electrostatic and dipolar fields associated with the aggregate, van der Waals forces, hydrophobic interactions, and hydrogen bonds, may have various effects on the self-assembly.70–72
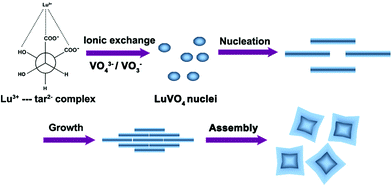 |
| | Scheme 1 Schematic illustration for the possible formation mechanism of LuVO4 nanoleaves. | |
3.3 Photoluminescence properties
Lanthanide compounds have been extensively employed as an efficient host lattice for doping other lanthanide ions, bringing about various degrees of luminescence because different doping modes may lead to quite different emission behaviors.73,74 In our present work, we focus on investigating the DC luminescence of LuVO4:Ln3+ (Ln3+ = Eu3+, Dy3+, Sm3+, and Er3+) and UC emissions of LuVO4:Yb3+/Ln3+ (Ln3+ = Er3+, Tm3+, and Ho3+) of the nanoleaves prepared at 180 °C for 24 h with 0.2 g Na2tar at pH 10. It should be noted that the small number of doping lanthanide ions have not changed the crystal structures and morphology of the host materials. All the doping ratios of Ln3+ are molar in our experiments.
Fig. 7 shows the excitation and emission spectra of the as-prepared LuVO4:Ln3+ samples and their corresponding luminescent photographs under 254 nm UV irradiation, respectively. The excitation spectrum (Fig. 7A, left) of LuVO4:5 mol% Eu3+ consists of a strong absorption band with a maximum at 275 nm, and a Eu–O charge transfer band as a hump around 270 nm and several weak lines.75 The strong absorption band is due to the charge transfer from the oxygen ligands to the central vanadium ions inside the VO43− groups. The weak lines are attributed to the f → f transitions within the 4f6 configuration of the Eu3+ ions. The absorption intensity of the general f → f transitions of the Eu3+ ions in the longer wavelength region is very weak in comparison with that of the VO43− groups, indicating that the excitation of the Eu3+ ions is mainly through the VO43− groups.75 The emission spectrum (Fig. 7A, right) exhibits five groups of emission lines between 500–800 nm, which are ascribed to the 5D1 → 7F1 and 5D0 → 7FJ (J = 1, 2, 3, 4) transitions of the Eu3+ ions, respectively. No emission from the VO43− groups was observed, revealing that the energy transfer from the VO43− groups to Eu3+ ions is very efficient.76 The emission spectrum is dominated by the red 5D0 → 7F2 (621 nm) transition of the Eu3+ ions, due to a forced electric-dipole transition of the Eu3+ ions in LuVO4. The whole excitation and emission process of LuVO4:Eu3+ under UV radiation includes three major steps. The first is absorption of UV radiation by VO43− groups; then the excited energy is subsequently transferred to Eu3+ ions after a thermally activated energy migration through the vanadate sublattice; and the final step is the de-excitation process of excited Eu3+ ions, producing strong red emissions. The excitation and emission process of VO43−, the energy transfer process from VO43− to Eu3+, as well as the emission process of Eu3+ are schematically shown in Fig. 8A. The strong red emission of the sample upon excitation at 254 nm with a UV lamp can be seen clearly (inset of Fig. 7A), and confirms the strong red emission of the YVO4:5 mol% Eu3+ sample. The chromaticity coordinates (CIE) of the LuVO4:5 mol% Eu3+ sample are x = 0.661 and y = 0.311, located in the red region (Fig. 8B, point a), which agrees well with the luminescence photograph (inset in Fig. 7A).
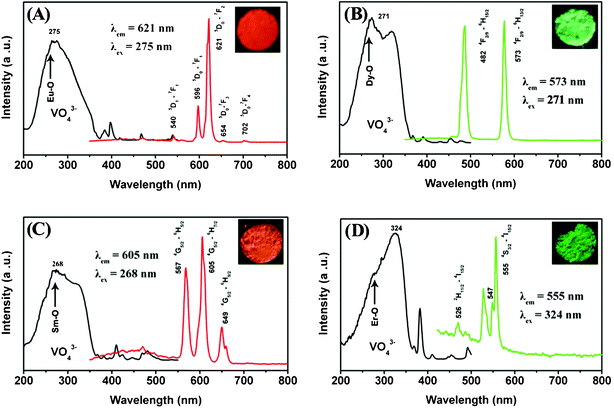 |
| | Fig. 7 Excitation and emission spectra of LuVO4:5 mol% Eu3+ (A), LuVO4:5 mol% Dy3+ (B), LuVO4:5 mol% Sm3+ (C), and LuVO4:5 mol% Er3+ (D). The insets are the corresponding luminescence photographs of the samples upon excitation at 254 nm with a UV lamp. | |
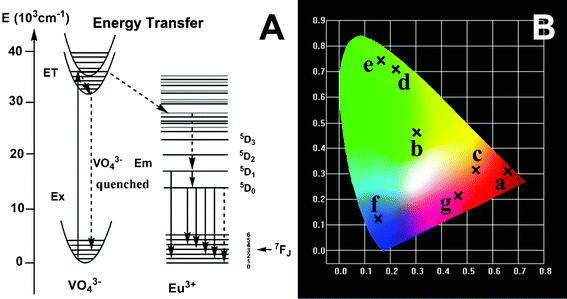 |
| | Fig. 8 (A) The scheme for the VO43−–Eu3+ energy transfer and Eu3+ emission processes and (B) the CIE chromaticity diagram showing the emission colors for the as-prepared LuVO4:Eu3+ (point a), LuVO4:Dy3+ (point b), LuVO4:Sm3+ (point c), LuVO4:Er3+ (point d), LuVO4:Yb3+/Er3+ (point e), LuVO4:Yb3+/Tm3+ (point f), and LuVO4:Yb3+/Ho3+ (point g). | |
The room-temperature excitation and emission spectra of the other rare earth ions Dy3+-, Sm3+- and Er3+-doped LuVO4 samples are given in Fig. 7B, C, and D, respectively. The excitation spectra for the LuVO4:5 mol% Dy3+, LuVO4:5 mol% Sm3+, and LuVO4:5 mol% Er3+ samples are very similar to the LuVO4:5 mol% Eu3+ sample (Fig. 7A, right); that is, monitored with 573 nm emission of Dy3+ (4F9/2 → 6H13/2), 605 nm emission of Sm3+ (4G5/2 → 6H7/2), and 555 nm emission of Er3+ (4S3/2 → 4I15/2), respectively. A strong and broad band due to the VO43− group has been observed.75 The characteristic emissions of these luminescent lanthanide ions can also be observed after excitation in the charge-transfer band of the vanadate groups. For Ln3+ = Dy3+, as indicated in Fig. 7B, the emissions at 482 and 573 nm are associated with the typical transitions from the 4F9/2 level to the 6H15/2 and 6H13/2, respectively. For Ln3+ = Sm3+ (Fig. 7C), a red-orange light was observed, which consists of the typical emissions at 567, 605, and 649 nm, which originate from the transitions from the 4G5/2 level to the 6H5/2, 6H7/2, and 6H9/2 levels, respectively. Fig. 7D exhibits the emission spectrum of the LuVO4:5 mol% Er3+ sample, which originates from the transitions 2H11/2 → 4I15/2 and 4S3/2 → 4I15/2 at 526 and 555 nm, respectively. These indicate that the same situation holds for Dy3+-, Sm3+-, and Er3+-doped LuVO4 samples, i.e. an efficient energy transfer also occurs from VO43− to Dy3+, Sm3+, and Er3+. From the above results and analysis, the emission color can be tuned by doping with different lanthanide activators. This can be confirmed from the CIE (Commission International de l'Eclairage 1931 chromaticity) coordinates for the emission spectra of the LuVO4:Ln3+ (Ln3+ = Dy, Sm, and Er) samples (Fig. 8B). The LuVO4:Dy3+ sample emits green-yellow light and its chromaticity coordinates are x = 0.302 and y = 0.463. The LuVO4:Sm3+ and LuVO4:Er3+ samples can emit orange-red and green emissions, and the chromaticity coordinates are x = 0.535, y = 0.316 and x = 0.223, y = 0.708, respectively.
The UC emission spectra of LuVO4:20 mol% Yb/x mol% Ln3+ (Ln3+ = Er3+, Tm3+, Ho3+) and their corresponding luminescent photographs under 980 nm NIR excitation are given in Fig. 9. It can be seen that the LuVO4:Yb3+/Er3+, LuVO4:Yb3+/Tm3+, and LuVO4:Yb3+/Ho3+ samples exhibit strong green, blue and red emissions (insets in Fig. 9), respectively. In the UC emission spectrum of LuVO4:Yb3+/Er3+ (Fig. 9A), the emission bands centered at 526, 554 and 659 nm can be assigned to the 2H11/2 → 4I15/2, 4S3/2 → 4I15/2 and 4F9/2 → 4I15/2 transitions of Er3+, respectively. The corresponding CIE coordinates for the emission spectrum of LuVO4:Yb3+/Er3+ are determined as x = 0.163, y = 0.745, located in the green region (point e, Fig. 8B). As for LuVO4:Yb3+/Tm3+ in Fig. 9B, the emission bands located at 473, 648 and 701 nm can be attributed to the 1G4 → 3H6, 1G4 → 3F4 and 3F3 → 3H6 transitions of Tm3+. The predominant 1G4 → 3H6 transition results in a strong blue emission and 1G4 → 3F4 yields a weak red emission. The corresponding CIE coordinates for the emission spectrum are determined as x = 0.152, y = 0.124, located in the blue region (point f, Fig. 8B). In the case of LuVO4:Yb3+/Ho3+ in Fig. 9C, the peak centered at 542 nm can be assigned to the 5S2 → 5I8 transition, and the peak at 660 nm may originate from the 5F5 → 5I8 transition. The corresponding CIE coordinates for the emission spectrum are determined as x = 0.466, y = 0.213, located in the yellow region (point g, Fig. 8B).
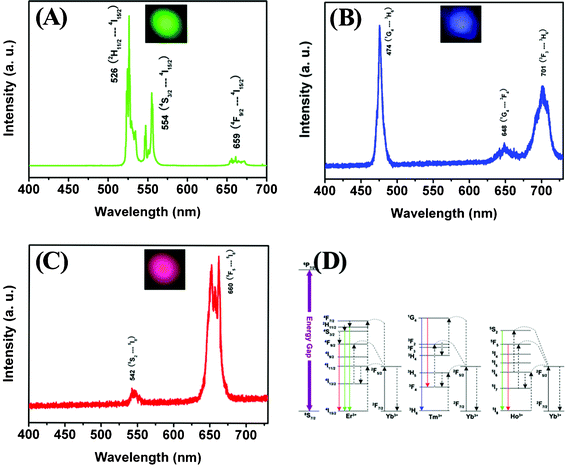 |
| | Fig. 9 NIR-to-visible UC emission spectra of LuVO4:Yb3+/Er3+ (A), LuVO4:Yb3+/Tm3+ (B), and LuVO4:Yb3+/Ho3+ (C) under 980 nm laser excitation. (D) The proposed energy transfer mechanisms under 980 nm diode laser excitation in LuVO4:Yb3+/Er3+, LuVO4:Yb3+/Tm3+, and LuVO4:Yb3+/Ho3+. The insets are the corresponding luminescence photographs of the samples upon excitation at 980 nm light. | |
The proposed UC mechanism in the LuVO4:Yb3+/Ln3+ (Ln3+ = Er3+, Tm3+, Ho3+) is described in the energy diagram, as shown in Fig. 9D. The excitation signal (980 nm) is initially absorbed by Yb3+ ions to raise the 2F7/2 to the 2F5/2 excited state. For LuVO4:Yb3+/Er3+ (Fig. 9D, left), the 4I11/2 energy level of the Er3+ ions is excited by an initial energy transfer from Yb3+ ions in the 2F5 state. Meanwhile, some of the excited Er3+ ions relax rapidly to the low-lying levels of the 4I13/2 states. Once these states are populated, a subsequent 980 nm photon transferred from the excited-state Yb3+ ions can populate a higher 4F7/2 energetic state of the Er3+ ions. The Er3+ ions can then decay nonradiatively to the low-lying 2H11/2 and 4S3/2 states of the Er3+ ions, which result in the dominant green 2H11/2 → 4I15/2 and 4S3/2 → 4I15/2 emission or further relax and populate a red 4F9/2 → 4I15/2 emission. Similarly, in the case of LuVO4:Yb3+/Tm3+ and LuVO4:Yb3+/Ho3+, the energy levels of the Tm3+ and Ho3+ ions are also excited by an initial energy transfer from the excited state Yb3+ ions. Then a few subsequent energy transfer processes from Yb3+ ions populate the upper Tm3+ and Ho3+ levels, resulting in the various emissions of Tm3+ and Ho3+.
3.4. Cathodoluminescence properties
In order to explore the potential of the as-synthesized LuVO4:Ln3+ (Ln3+ = Eu3+, Dy3+, Sm3+, and Er3+) samples to be used as CL materials, their CL properties have been investigated in detail. The LuVO4:Ln3+ (Ln3+ = Eu3+, Dy3+, Sm3+, and Er3+) products are stable under electron-beam excitation. The representative CL spectra of the LuVO4:Ln3+ samples under the excitation of the electron beam (accelerating voltage = 3 kV; filament current = 80 mA) are shown in Fig. 10, and have identical shapes to the PL emission spectra. During excitation with a 3.0 kV voltage, the above LuVO4:Eu3+, LuVO4:Dy3+, LuVO4:Sm3+, and LuVO4:Er3+ samples, respectively, show bright red, green-yellow, orange-red, and green luminescence to the naked eye, as depicted in the luminescent photographs from the insets in Fig. 10A–D. However, the relative intensity of the peaks in photoluminescence and cathodoluminescence spectra varies, which may be caused by the different excitation mechanisms. The CL emission intensities for the LuVO4:Ln3+ samples have been investigated as a function of the filament current and the accelerating voltage, as shown in Fig. 11, respectively. Under a 75 mA electron beam excitation, the CL intensity increased with the accelerating voltage from 3 to 5 kV (Fig. 11A, C, E, and G). Similarly, when the accelerating voltage is fixed at 3 kV, the CL intensity also increases with raising the filament current from 75 to 95 mA (Fig. 11B, D, F, and H). The increase in CL brightness with increasing electron energy and filament current can be attributed to deeper penetration of electrons into the phosphors and the larger electron beam current density. The electron penetration depth can be estimated using the empirical formula L [Å] = 250(A/ρ)(E/Z1/2)n, where n = 1.2/(1 − 0.29 log10Z), A is the atomic or molecular weight of the material, ρ is the bulk density, Z is the atomic number or the number of electrons per molecule in the case of compounds, and E is the accelerating voltage (kV).77 For cathodoluminescence, the Eu3+, Dy3+, Sm3+, and Er3+ ions are excited by the plasma produced by the incident electrons. With the increase of accelerating voltage or filament current, more plasma will be produced, which resulted in more Eu3+, Dy3+, Sm3+, and Er3+ ions being excited and thus the CL intensity increased. Due to the strong low voltage CL intensity and excellent dispersing properties of LuVO4:Ln3+ phosphors, they are potentially applied in field emission display devices.
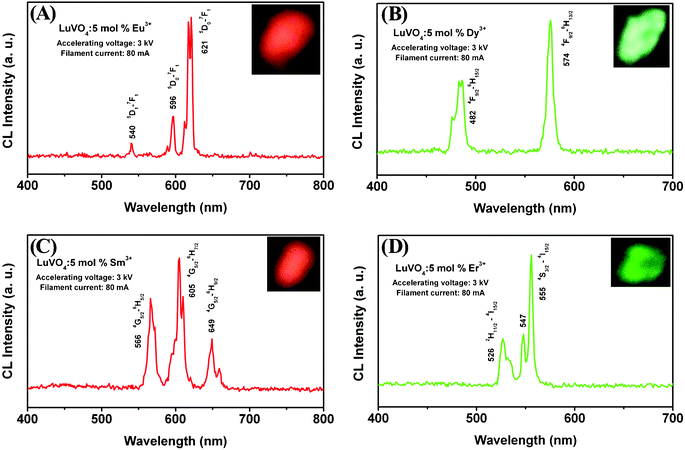 |
| | Fig. 10 Typical cathodoluminescence spectra of (A) LuVO4:5 mol% Eu3+, (B) LuVO4:5 mol% Dy3+, (C) LuVO4:5 mol% Sm3+, and (D) LuVO4:5 mol% Er3+ samples. | |
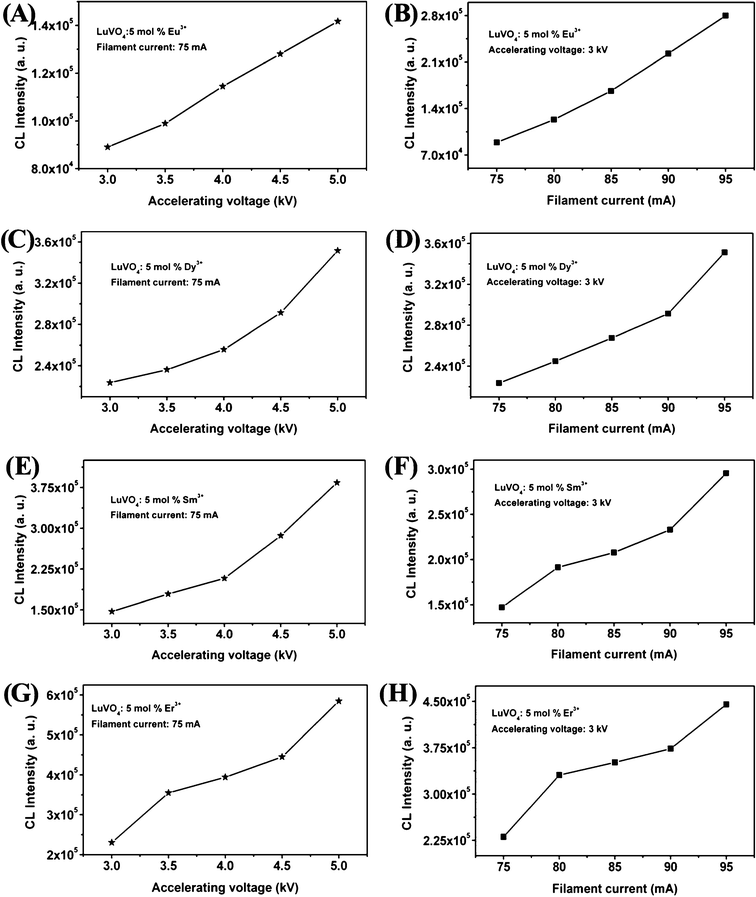 |
| | Fig. 11 Cathodoluminescence intensity of LuVO4: Ln3+ (Ln3+ = Eu3+, Dy3+, Sm3+, and Er3+) samples as a function of accelerating voltage (A, C, E, and G) and filament current (B, D, F, and H). | |
4. Conclusions
In summary, we demonstrated a simple and effective hydrothermal method to synthesize well-defined LuVO4 nanoleaves. A series of controlled experiments show that the pH value of the initial solution, the content of Na2tar and the reaction time all have an important influence on the size, shape and dimensions of the final products. The formation mechanism of nanoleaves has been investigated in detail. We believe that the synthetic strategy demonstrated here can also be extended to the controllable synthesis of other inorganic compounds by adjusting the amount of organic additive and other reaction parameters. Furthermore, under ultraviolet or low-voltage electron beam excitation, the Ln3+ (Ln3+ = Eu3+, Dy3+, Sm3+, and Er3+) ions doped LuVO4 samples show strong red, green-yellow, orange-red, and green, respectively. Upon 980 nm NIR laser excitation, Yb3+/Er3+, Yb3+/Tm3+ and Yb3+/Ho3+ co-doped LuVO4 samples exhibit strong green, blue and red UC luminescence, respectively. The results indicate that the as-prepared LuVO4 nanoleaves can be good host lattices for the luminescence of Eu3+, Dy3+, Sm3+, Er3+, Yb3+/Er3+, Yb3+/Tm3+ and Yb3+/Ho3+ ion pairs. These merits of multicolor emissions in the visible region endow this kind of material with potential applications in the field of light display systems, lasers, and optoelectronic devices.
Acknowledgements
This project is financially supported by the National Basic Research Program of China (2010CB327704), and the National Natural Science Foundation of China (NSFC 51172227, 20921002).
References
- X. Wang, J. Zhuang, Q. Peng and Y. D. Li, Inorg. Chem., 2006, 45, 6661 CrossRef CAS.
- G. Hu, D. Ma, L. Liu, M. Cheng and X. Bao, Angew. Chem., Int. Ed., 2004, 43, 3452 CrossRef CAS.
- H. Cho, G. Pauletti, J. Zhang, H. Xu, H. Gu, L. Wang, R. Ewing, C. Huth, F. Wang and D. Shi, ACS Nano, 2010, 4, 5398 CrossRef CAS.
- K. Liu, H. Fu, Y. Xie, L. Zhang, K. Pan and W. Zhou, J. Phys. Chem. C, 2008, 112, 951 CrossRef CAS.
- G. Li, Z. Hou, C. Peng, W. Wang, Z. Cheng, C. Li, H. Lian and J. Lin, Adv. Funct. Mater., 2010, 20, 3446 CrossRef CAS.
- N. Li, K. Yanagisawa and N. Kumada, Cryst. Growth Des., 2009, 9, 978 CrossRef CAS.
- L. Wang and Y. Li, Chem. Mater., 2007, 19, 727 CrossRef CAS.
- X. Wang, X. Sun, D. Yu, B. Zou and Y. Li, Adv. Funct. Mater., 2003, 15, 1442 CAS.
- G. Jia, H. You, M. Yang, L. Zhang and H. Zhang, J. Phys. Chem. C, 2009, 113, 16638 CrossRef CAS.
- G. Li, C. Peng, C. Zhang, Z. Xu, M. Shang, D. Yang, X. Kang, W. Wang, C. Li, Z. Cheng and J. Lin, Inorg. Chem., 2010, 49, 10522 CrossRef CAS.
- Y. N. Xia, Y. J. Xiong, B. K. Lim and S. E. Skrabalak, Angew. Chem., Int. Ed., 2008, 47, 2 CrossRef.
- H. Zhou, Y. Mao and S. S. Wong, Chem. Mater., 2007, 19, 5238 CrossRef CAS.
- C. Li, J. Yang, Z. Quan, P. Yang, D. Kong and J. Lin, Chem. Mater., 2007, 19, 4933 CrossRef CAS.
- Y. Mao, T.J. Park, F. Zhang, H. Zhou and S. S. Wong, Small, 2007, 3, 1122 CrossRef CAS.
- Q. S. Liu, W. G. Lu, A. H. Ma, J. K. Tang, J. Lin and J. Y. Fang, J. Am. Chem. Soc., 2005, 127, 5276 CrossRef CAS.
- Q. S. Liu, Z. Yan, N. L. Henderson, J. C. Bauer, D. W. Goodman, J. D. Batteas and R. E. Schaak, J. Am. Chem. Soc., 2009, 131, 5720 CrossRef CAS.
- Z. L. Wang, Z. W. Quan, P. Y. Jia, C. K. Lin, Y. Luo, Y. Chen, J. Fang, W. Zhou, C. J. O'Connor and J. Lin, Chem. Mater., 2006, 18, 2030 CrossRef CAS.
- H. L. Niu, Q. W. Chen, Y. S. Jia, H. F. Zhu and M. Ning, Nanotechnology, 2004, 15, 1054 CrossRef CAS.
- D. Jiang, J. Li, D. Xie, J. Zhu, M. Chen, X. Lü and S. Dang, J. Colloid Interface Sci., 2010, 350, 30 CrossRef CAS.
- Y. Sun and Y. Xia, Adv. Mater., 2002, 14, 833 CrossRef CAS.
- Z. Hou, P. Yang, C. Li, L. Wang, H. Lian, Z. Quan and J. Lin, Chem. Mater., 2008, 20, 6686 CrossRef CAS.
- Y. L. Hou, H. Kondoh and T. Ohta, Chem. Mater., 2005, 17, 3994 CrossRef CAS.
- Y. J. Zhang, S. W. Or and Z. D. Zhang, RSC Adv., 2011, 1, 1287 RSC.
- Z. P. Liu, S. Li, Y. Yang, S. Peng, Z. K. Hu and Y. T. Qian, Adv. Mater., 2003, 15, 1946 CrossRef CAS.
- M. G. Ma and J. F. Zhu, Eur. J. Inorg. Chem., 2009, 36, 5522.
- X. P. Zhou, Z. Q. Wang, S. S. Li, S. N. Shan and Xiaqin Wang, J. Nanosci. Nanotechnol., 2010, 10, 2193 Search PubMed.
- Y. Y. Xu, D. R. Chen and X. L Jiao, J. Phys. Chem. B, 2005, 109, 13561 CrossRef CAS.
- W. Q. Cai, J. G. Yu, B. Cheng, B. L. Su and M. Jaroniec, J. Phys. Chem. C, 2009, 113, 14739 CrossRef CAS.
- X. E. Ye, J. Collins, Y. Kang, J. T. N. Chen, D. G. Chend, A. B. Yodhd and C. Murraya, Proc. Natl. Acad. Sci. U. S. A., 2010, 107, 22430 CrossRef CAS.
- Y. Terada, K. Shimamura, V. V. Kochurikhin, L. V. A. Barashov, M. Ivanov and T. Fukuda, J. Cryst. Growth, 1996, 167, 369 CrossRef CAS.
- J. C. Johnson, H. J. Choi, K. P. Knutsen, R. D. Schaller, P. D. Yang and R. J. Saykally, Nat. Mater., 2002, 1, 106 CrossRef CAS.
- B. Murugan and A. V. Ramaswamy, J. Am. Chem. Soc., 2007, 129, 3062 CrossRef CAS.
- Z. Xu, P. Ma, C. Li, Z. Hou, X. Zhai, S. Huang and J. Lin, Biomaterials, 2011, 32, 4161 CrossRef CAS.
- Z. Hou, Z. Cheng, G. Li, W. Wang, C. Peng, C. Li, P. Ma, D. Yang, X. Kang and J. Lin, Nanoscale, 2011, 3, 1568 RSC.
- K. Srinivasu, R. S. Ningthoujam, V. Sudarsan, R. K. Vatsa, A. K. Tyagi, P. Srinivasu and A. Vinu, J. Nanosci. Nanotechnol., 2009, 9, 3034 CrossRef CAS.
- A. K. Gulnar, V. Sudarsan, R. K. Vatsa, T. Sakuntala, A. K. Tyagi, U. K. Gautam and A. Vinu, Nanoscale, 2010, 2, 2847 RSC.
- A. K. Gulnar, V. Sudarsan, R. K. Vatsa, R. C. Hubli, U. K. Gautam, A. Vinu and A. K. Tyagi, Cryst. Growth Des., 2009, 9, 2451 CrossRef CAS.
- H. Zimer, K. Albers and U. Wittrock, Opt. Lett., 2004, 29, 2761 Search PubMed.
- J. R. O'Connor, Appl. Phys. Lett., 1966, 9, 407 CrossRef CAS.
- A. Huignard, T. Gacoin and J. P. Boilot, Chem. Mater., 2000, 12, 1090 CrossRef CAS.
- A. Huignard, V. Buissette, G. Laurent, T. Gacoin and J. P. Boilot, Chem. Mater., 2002, 14, 2264 CrossRef CAS.
- C. J. Jia, L. D. Sun, L. P. You, X. C. Jiang, F. Luo, Y. C. Pang and C. H. Yan, J. Phys. Chem. B, 2005, 109, 3284 CrossRef CAS.
- C. J. Jia, L. D. Sun, F. Luo, X. C. Jiang, L. H. Wei and C. H. Yan, Appl. Phys. Lett., 2004, 84, 5305 CrossRef CAS.
- M. Gu, Q. Liu, S. Mao, D. Mao and C. Chang, Cryst. Growth Des., 2008, 8, 1422 CrossRef CAS.
- D. E. Zelmon, J. M. Northridge, J. J. Lee, K. M. Currin and D. Perlov, Appl. Opt., 2010, 49, 4973 CrossRef CAS.
- Y. J. Zhang, H. M. He, W. Zhu and A. Zheng, CrystEngComm, 2011, 13, 6471 RSC.
- G. Jia, H. P. You, L. H. Zhang, Y. H. Zheng, K. Liu, Y. J. Huang and H. J. Zhang, CrystEngComm, 2009, 11, 2745 RSC.
- R. Rao, A. B. Garg, T. Sakuntala, S. N. Achary and A. K. Tyagi, J. Solid State Chem., 2009, 182, 1879 CrossRef CAS.
- C. C. Yu, M. Yu, C. X. Li, C. M. Zhang, P. P. Yang and J. Lin, Cryst. Growth Des., 2009, 9, 783 CrossRef CAS.
- A. K. Parchura and R. S. Ningthoujam, Dalton Trans., 2011, 40, 7590 RSC.
- N. S. Gajbhiye and R. S. Ningthoujam, Mater. Res. Bull., 2006, 41, 1612 CrossRef CAS.
- W. X. Wang, Z. Y. Cheng, P. P. Yang, Z. Y. Hou, C. X. Li, G. G. Li, Y. L. Dai and J. Lin, Adv. Funct. Mater., 2011, 21, 456 CrossRef CAS.
- Y. H. Zheng, H. P. You, G. Jia, K. Liu, Y. H. Song, M. Yang and H. J. Zhang, Cryst. Growth Des., 2009, 9, 5101 CrossRef CAS.
- M. L. Pang, J. Lin, M. Yu and S. B. Wang, J. Solid State Chem., 2004, 177, 2237 CrossRef CAS.
- L. Y. Wang and Y. D. Li, Nano Lett., 2006, 6, 1645 CrossRef CAS.
- H. Deng, C. Liu, S. Yang, S. Xiao, Z.-K. Zhou and Q.-Q. Wang, Cryst. Growth Des., 2008, 8, 4432 CrossRef CAS.
- Z. H. Xu, X. J. Kang, C. X. Li, Z. Y. Hou, C. M. Zhang, D. M. Yang, G. G. Li and J. Lin, Inorg. Chem., 2010, 49, 6706 CrossRef CAS.
- F. Luo, C.-J. Jia, W. Song, L.-P. You and C.-H. Yan, Cryst. Growth Des., 2004, 5, 137.
- L. Xu, J. Shen, C. Lu, Y. Chen and W. Hou, Cryst. Growth Des., 2009, 9, 3129 CrossRef CAS.
- Z. H. Xu, C. X. Li, Z. Y. Hou, C. Peng and J. Lin, CrystEngComm, 2011, 13, 474 RSC.
- Y. Song, H. You, M. Yang, Y. Zheng, K. Liu, G. Jia, Y. Huang, L. Zhang and H. Zhang, Inorg. Chem., 2010, 49, 1674 CrossRef CAS.
- Z. Xu, C. Li, G. Li, R. Chai, C. Peng, D. Yang and J. Lin, J. Phys. Chem. C, 2010, 114, 2573 CrossRef CAS.
- F. He, P. P. Yang, D. Wang, N. Niu, S. L. Gai, X. B. Li and M. L. Zhang, Dalton Trans., 2011, 40, 11023 RSC.
- N. S. Singh, R. S. Ningthoujam, G. Phaomei, S. D. Singh, A. Vinu and R. K. Vatsa, Dalton Trans., 2012, 41, 4404 RSC.
- R. A. Laudise and A. A. Ballman, J. Phys. Chem., 1960, 64, 688 CrossRef CAS.
- R. A. Laudise, E. D. Kolb and A. J. Caporaso, J. Am. Ceram. Soc., 1964, 47, 9 CrossRef.
- C. X. Li, Z.W. Quan, J. Yang, P. P. Yang and J. Lin, Inorg. Chem., 2007, 46, 6329 CrossRef CAS.
- C. X. Li, Z. W. Quan, P. P. Yang, J. Yang, H. Z. Lian and J. Lin, J. Mater. Chem., 2008, 18, 1353 RSC.
- C. X. Li, J. Yang, P. P. Yang, X. M. Zhang, H. Z. Lian and J. Lin, Cryst. Growth Des., 2008, 8, 923 CrossRef CAS.
- Y. Politi, T. Arad, E. Klein, S. Weiner and L. Addadi, Science, 2004, 306, 1161 CrossRef CAS.
- H. Colfen and M. Antonietti, Angew. Chem., Int. Ed., 2005, 44, 5576 CrossRef.
- H. Colfen and S. Mann, Angew. Chem., Int. Ed., 2003, 42, 2350 CrossRef.
- F. He, P. Yang, D. Wang, N. Niu, S. Gai and X. Li, Inorg. Chem., 2011, 50, 4116 CrossRef CAS.
- Y. Liu, D. Tu, H. Zhu, R. Li, W. Luo and X. Chen, Adv. Mater., 2010, 22, 3266 CrossRef CAS.
- M. N. Luwang, R. S. Ningthoujam, S. K. Srivastava and R. K. Vatsa, J. Mater. Chem., 2011, 21, 5326 RSC.
- G. H. Jia, P. A. Tanner and B. M. Cheng, Chem. Phys. Lett., 2009, 474, 97 Search PubMed.
- C. Feldman, Phys. Rev., 1960, 117, 455 CrossRef CAS.
|
| This journal is © The Royal Society of Chemistry 2012 |
Click here to see how this site uses Cookies. View our privacy policy here. 

![[thin space (1/6-em)]](https://www.rsc.org/images/entities/char_2009.gif) :
:![[thin space (1/6-em)]](https://www.rsc.org/images/entities/char_2009.gif) V
V![[thin space (1/6-em)]](https://www.rsc.org/images/entities/char_2009.gif) :
:![[thin space (1/6-em)]](https://www.rsc.org/images/entities/char_2009.gif) Lu is 3.97
Lu is 3.97![[thin space (1/6-em)]](https://www.rsc.org/images/entities/char_2009.gif) :
:![[thin space (1/6-em)]](https://www.rsc.org/images/entities/char_2009.gif) 1.06
1.06![[thin space (1/6-em)]](https://www.rsc.org/images/entities/char_2009.gif) :
:![[thin space (1/6-em)]](https://www.rsc.org/images/entities/char_2009.gif) 1, which approximately corresponds to the stoichiometric value of LuVO4 (4
1, which approximately corresponds to the stoichiometric value of LuVO4 (4![[thin space (1/6-em)]](https://www.rsc.org/images/entities/char_2009.gif) :
:![[thin space (1/6-em)]](https://www.rsc.org/images/entities/char_2009.gif) 1
1![[thin space (1/6-em)]](https://www.rsc.org/images/entities/char_2009.gif) :
:![[thin space (1/6-em)]](https://www.rsc.org/images/entities/char_2009.gif) 1).
1).


