Antireflective coatings of ZnO quantum dots and their photocatalytic activity†
T. Jesper
Jacobsson
* and
Tomas
Edvinsson
Dept. of Chemistry-Ångström Laboratry, Uppsala Univerity, Box 538, 75121 Uppsala, Sweden. E-mail: Jesper.jacobsson@kemi.uu.se; Tel: +46 (0)70-5745116
First published on 3rd September 2012
Abstract
Thin films of ZnO quantum dots of different sizes have been deposited on conducting glass substrates. The films are transparent and work as antireflective coatings in the visible region. The negative absorption reaches down to −0.25 which represent a 77% increase in the transmitted light. Over a large part of the visible spectrum the increased transmittance is over 25%, and we demonstrate this to be a thin film effect. Under simulated solar illumination these films show a relatively high photocatalytic activity towards decomposition of methylene blue. The rate of photodecomposition depends on particle size and the smallest particles, which are less than 4 nm in diameter, show the highest quantum efficiency. We find the overall efficiency to be in the same order of magnitude to what's reported for commercial photocatalytic products like Degussa P25 and Pilkinton Active™, and maybe even somewhat better. We also demonstrate an increased hydrophilicity for the films under UV radiation. The photocatalytic oxidation of water into oxygen as a function of applied bias was measured in a three electrode system. The overall efficiency is small due to the high band gap but the internal quantum efficiency reaches over 10%.
1. Introduction
One of the downsides of our industrialized high-tech society is the seemingly inevitable generation of huge amounts of waste chemicals, of which many show some level of toxicity. In one way or another, these need to be taken care of and this can be done in several different ways depending on which chemicals are addressed. When it comes to organic compounds one approach is to utilize the fact that the energy in UV-photons is high enough to break covalent bonds in molecules. For some unstable molecules direct illumination is enough to degrade them, but generally a catalyst is needed to overcome the activation barriers and speed up the degradation.A lot of work has been directed towards photocatalytic degeneration of hazardous compounds from water, air and surfaces, and a review from the American National Renewable Energy Laboratory lists over 1500 references in the field, and approximately the same number of patents.1 Most of the literature are directed towards TiO2 and often utilizing the commercial product Degussa TiO2p − 25, 50 m2 g¬1.2,3 The majority of the research has focused on particles suspended in solution, but some work is also directed towards immobilized catalysts which have the benefit of excluding the problem of separating the catalyst from the solution after degradation of the contaminant.
The general mechanism is based on photogeneration of electron-hole pairs in the semiconductor that are utilized in subsequent redox reactions. For wide band gap semiconductors like TiO2 and ZnO the holes in the valence band are rather low in energy and thus highly oxidizing. While water is present at the semiconductor surface the photo generated hole often tends to oxidize water, generating hydroxyl radicals (•OH)3,4 which acts as strong non-selective oxidants. The end result is often a complete mineralization of the undesired chemicals into CO2 and harmless inorganic ions. The photoexcited electron in the conduction band can be transferred to either dissolved oxygen forming a superoxide anion or directly to an absorbed molecule forming an organic anion. An illustration of the overall concept is given in Fig. 1.c.
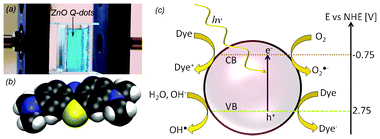 | ||
| Fig. 1 (a) Experimental setup for the photodecomposition experiment. The fiber optic is perpendicular to the cuvette with methylene blue. The cuvette is illuminated from the front and the film is at the backside of the cuvette. (b) Structure of methylene blue. (c) Illustration of the photodecomposition of an organic dye on a semiconductor nanoparticle in a water environment. The dye in the figure represents both the intact molecule and its decomposition products. The indicated energy levels are for a ZnO particle and are from ref. 20. | ||
These principles have also found their way into the commercial domain, where one example is self cleaning windows like Pilkinton Activ™.5 These glasses work by two different mechanisms. A photocatalytic degradation of organic contaminants on the window occurs which is combined by a UV-induced hydrophilicity that in case of rain facilitates a removal of the degradation products.
Even though most of the previous work in the literature are directed towards TiO2, other semiconductors, for example ZnO, have also been studied, both in the form of suspensions and immobilized on substrates.4,6–12 The mechanism for the photo degradation appears to be rather general as several different organic molecules are demonstrated to mineralize on ZnO which is in line with the initial forming of non-selective hydroxyl radicals. One of the motives for investigating ZnO is that several studies indicate that ZnO may show higher photo degradation efficiency than commercial products based on TiO2.13–17
In this work the photocatalytic properties of transparent films of ZnO quantum dots of different sizes have been investigated. An interesting feature is that the films show antireflective properties when deposited on conducting glass, (FTO). The combination of photo degradation and good optical properties are interesting from a technological perspective in for example self cleaning windows. In this work we have investigated the photo degradation of methylene blue (C16H18N3SCl), which can be seen as a model substance, under simulated sunlight on the deposited films. This work can be seen as part of a larger study concerning size dependent properties of ZnO quantum dots,18–20 which here extend into how the photocatalytic properties depend on the particle size in the quantum confined regime of wurtzite ZnO.
In the last part of the article we also investigate the photo-oxidation efficiency with respect to water, which is one of the two half-reactions in solar water splitting for hydrogen generation. ZnO will, just like TiO2, never be the material of choice in its pure form for direct solar water splitting due to the high band gap and resultant low light harvesting of the solar spectra. The results for pure ZnO are however of interest as it gives an idea of what may be expected for doped systems that also absorb light in the visible region, given that the high photocatalytic activities can be retained in the whole light absorbing region.
2. Methods
2.1 Synthesis
ZnO nanoparticles were synthesized by a wet chemical method based on hydrolysis in alkaline zinc acetate solution. The details have been described in a previous publication.18 The synthesis is based on the earlier work of Meulekamp21 and L. Spanhel et al.22 In the synthesis 2.5 mmol Zn(OAc)2·2 H2O is dissolved in 25 ml boiling ethanol under vigorous stirring for approximately one minute. The solution is subsequently cooled to room temperature and mixed with 3.5 mmol LiOH·H2O dissolved in 25 ml ethanol. When the two solutions are mixed, ZnO quantum dots begin to nucleate and grow which can be monitored by measuring the band gap shift with UV-vis spectroscopy.18,20At certain times, a small volume of solution is extracted in order to make films of particles with distinct sizes. 2.5 ml of reaction solution are then mixed with approximately 5 ml hexane which induces particle agglomeration and precipitation. In order to increase the speed of the sedimentation the solution is centrifuged at 5000 rpm for five minutes. The particles were then redispersed in one drop of methanol and ultrasonicated for 3 min. The concentrated solution was then doctor bladed on substrates of conductive glass whereupon smooth and transparent films were formed. The substrates used for film deposition were fluorine doped SnO2 (FTO) Pilkinton TEC 8, which were used in order to enable combined electrochemical and transient absorption measurements.
2.2 Measurements and characterization
The UV-vis absorption measurements were performed on an Ocean Optics spectrophotometer HR-2000 γ with deuterium and halogen lamps. In all measurements, a full spectrum from 190 to 1100 nm with 2048 evenly distributed points was sampled. In order to obtain good statistics an average of over 100 consecutive spectra were done.The photo degradations of methylene blue were performed in a 5 ml glass cuvette by simulated AM 1.5 G illumination. An Oriel solar simulator xenon arc lamp equipped with a global AM 1.5 air mass filter was used. This gave a reasonable good approximation to the AM 1.5 global solar spectrum. The intensity at the position of the cuvette was calibrated with a pyranometer to 100 mW cm−2. During the experiment 4.5 ml of 10 μM methylene blue was inserted in the cuvette, together with the particle film. The film was positioned at the back of the cuvette, and the area of the film was 0.8 cm2. The experiment run time was four hours, and the absorption of the solution was measured perpendicular to the illumination direction during the entire experiment. A cover lid was applied on top of the cuvette to prevent evaporation. A photograph of the experimental setup is displayed in Fig. 1.a.
The electrochemical measurements were performed with a CH Instrument model 760 C. If not other is stated the potentials are given with respect to the Ag/AgCl reference electrode, which is shifted 0.197 V with respect to the normal hydrogen electrode (NHE). The solar water splitting measurements were measured by sweeping the potential from 1.2 to −0.5 V vs. Ag/AgCl with a sweep rate of 10 mV s−1. The illumination was chopped in 5 s intervals in order to measure the light and dark current in the same sweep. The electrolyte consisted of 0.5 M Na2SO4 and a Pt-wire was used as counter electrode.
XRD measurements were performed with a Siemens D5000 Diffractometer using parallel beam geometry with X-ray mirror and a parallel plate collimator of 0.4°. Cukα with a wavelength of 1.54 Å was used as X-ray source. The angle of incidence was 0.5° and 2Θ scans were performed between 10° and 90° with a step size of 0.1°.
Photographs were taken by a Canon EOS 450 D using a EFS 60 macro lens.
3. Results
3.1 Antireflective properties
The optical absorption of the produced particle films is less than for the bare substrate, as seen in Fig. 2. The particle film thus works as an antireflective coating on the conductive glass, and the effect is substantial. This effect is quantized by measuring the absorption spectra as in Fig. 3. The negative absorption reaches down to −0.25 which represent a 77% increase in the transmitted light. This is the peak value but over a rather large part of the visible spectrum the increased transmittance is over 25%. Of course a prerequisite for this to be possible is that the substrate absorbs some of the light, and for a more transparent substrate like soda lime glass with only 8% absorption the effect is less pronounced. Conductive glasses are despite the higher absorption commonly used in application where increased transmission would be highly beneficial as in solar cells, smartphones and tablets. The effect does not seem to depend on particle size as seen in Fig. 3b. | ||
| Fig. 2 (a) Transmission spectra for the substrate and the film. The dotted line represents the wavelength corresponding to the band gap energy. (b) To the right is bare ITO. On the left is ITO covered by a film of ZnO nanoparticles. The film covered side is clearly more transparent in the visible. The dimension of the glass is 0.8 × 2 cm. | ||
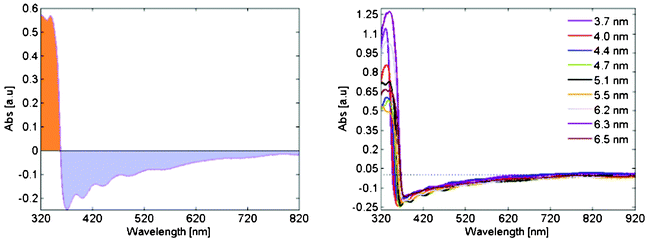 | ||
| Fig. 3 (a) Absorption spectrum for a typical film. The light blue shaded region represents negative absorption compared to the bare conductive substrate. (b) The absorption spectra for the entire set of samples. | ||
There are different possible mechanisms that can make a coating antireflective. These are generally categorized as thick film and thin film effects. Thick film effects are based on matching the reflective index between the coating and the underlying material, and ideally the coating should have a refractive index that is the square root of the refractive index of the underlying material. ZnO have a higher refractive index (2.1) than both the FTO (2.0) and the underlying glass (1.5), wherefore the observed phenomenon instead is a thin film effect. The deposited films are thinner than the wavelength of the visible light, which causes partial destructive interference for light reflected in the ZnO/FTO interface. This also leads to a wavelength dependence of the reflection represented as the wave pattern in the absorption seen for wavelengths longer than ∼340 nm in Fig. 3. In line with this the films get a slight colored taint when viewed at oblique angles.
3.2 Absorption and XRD
Measurements were performed on thin films made from quantum dots of different sizes ranging from 3.7 to 6.5 nm in diameter. XRD measurements verified that the only crystalline phase present in the samples where wurtzite zinc oxide. A representative diffractogram for some of the larger particles are given in Fig. 4 together with literature values of the ZnO diffraction peaks.23 In a previous study we showed that particles synthesized in this way are fairly isotropic in shape, and that the particle diameter, d, can be related to the band gap, Eg, by eqn (1).18 The direct band gaps are readily given from absorption measurements by plotting the square of the absorption and extrapolate the linear region seen for photon energies slightly above the band gap energy down to zero absorption. The ZnO particles made in this way have previously also been characterized by Raman spectroscopy.19 | (1) |
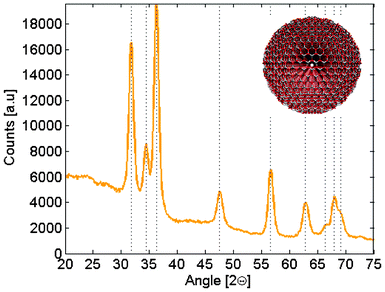 | ||
| Fig. 4 (a) XRD diffractogram for a representative sample of slightly larger particles. The vertical lines represent literature data for wurtzite ZnO.23 The inset shows a model of a wurtzite ZnO nanoparticle with 6 nm in diameter. | ||
UV-vis absorption was measured on all samples and is given in Fig. 5.a. From these measurements the band gaps are extracted as in Fig. 5.b from which the corresponding particle diameters are determined viaeqn (1). The particle sizes are given in Fig. 5.c.
 | ||
| Fig. 5 (a) Absorption as a function of wavelength for the quantum dot films which were used for photo degradation of methylene blue. (b) Determination of the corresponding band gaps by plotting the square of the absorption against photon energy. (c) Particle diameter determined from Eg and eqn (1). | ||
3.3 Photocatalytic decomposition of methylene blue
Four hours of solar illumination have the capacity to almost completely degrade the methylene blue in the reaction vessel when films on the smallest particles were used. A quantitative measure on this degradation is given in Fig. 6.a were absorption for the solution is plotted as a function of wavelength and reaction time. All the information is within the 3D surface, but may be somewhat hard to interpret in that form. Data is therefore projected down to 2D as in Fig. 6.b, and from both of these figures is it evident how the concentration of methylene blue decreases with time. The entire set of figures for all the samples are found in the supporting information. According to Lambert-Beers law the concentration is proportional to absorption, and a measure of how the concentration change during the experiment is given in Fig. 6.c where the maximum of the absorption in Fig. 6.a are plotted as a function of time. A photograph of this is given in the inset of Fig. 6.c | ||
| Fig. 6 (a) Absorption of the methylene blue solution as a function of wavelength and time under AM 1.5 illumination. (b) The same data as in (a) but projected down to two dimensions. (c) The maximum of absorption as a function of illumination time. In the inset of (c) to the right is a cuvette with 10 μM methylene blue solution. To the left is the same solution but after four hours of illumination and containing a particle film with particles of 3.7 nm in diameter. The film is still in the cuvette. | ||
The photodegradation for the different samples are compared in Fig. 7, were the absorption maximum normalized with initial absorption is given as a function of time. Several interesting features are directly apparent in the figure. A certain degradation of methylene blue occurs also in the blank sample but to a considerable smaller extend than when aided by nanoparticles. There is also a large difference between the different samples, and there seems to be a general trend that films with smaller particles are more efficient than films with larger particles, with the exception of the largest particles. The shapes of the lines are also different. For the smallest and largest particles the absorption relation is distinctly curved while it is more linear with a lower slope for the blank sample.
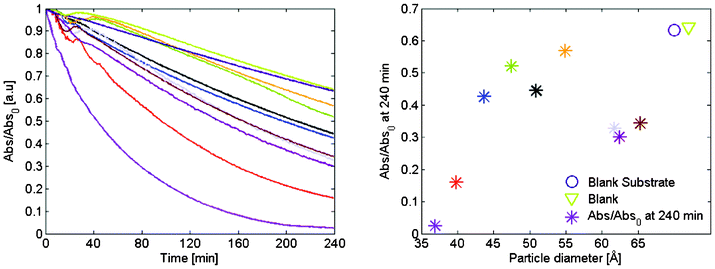 | ||
| Fig. 7 (a) Maximum absorption as a function of illumination time for the entire set of samples. The absorption is normalized with respect to the absorption at zero time. (b) Percent of methylene blue left in the cuvette after 4 h of illumination as a function of particle size. | ||
We have also performed experiments with degradation of other dyes as methylene orange and methyl red. They appear to degrade under illumination in a similar way as methylene blue and we have therefore focused on methylene blue as our model substance.
The temperature of the solution was measured both before and after the experiment and increases by approximately 5 °C under the experiment. This is a rather small difference wherefore we do not consider it in our analysis.
A measure of the photo-degradation efficiency is the formal quantum efficiency (FQE) defined as the quotient between the number of molecules that react and the number of incident photons. Particles of different size have different band gaps and will thus absorb a different amount in the solar spectrum. The absorption also depends on the film thickness which is slightly different for the different samples. The photon flux was given by measuring the spectrum from the solar simulator lamp (details are found in the supporting information). What is relevant is the number of photons that actually is absorbed in the films, which is given by integrating the photon flux down to the band gap energy and correcting for the absorption in the film. An illustration of this is given in Fig. 8.a. The concentration of methylene blue in the reaction vessel was 10 μM and the volume 4.5 ml which gives 2.7 × 10¹⁶ molecules. The concentration at the end of the experiment is given by multiplying the start concentration with the quotient of the initial and final absorption maximum in Fig. 7.b.
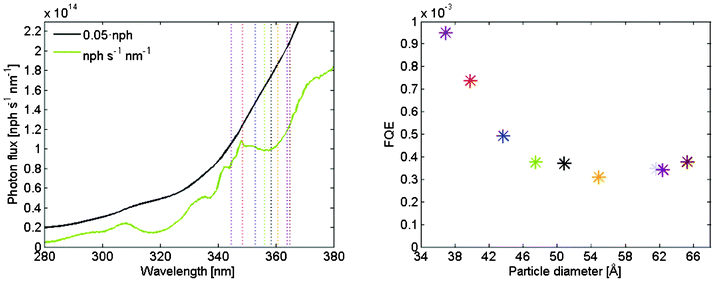 | ||
| Fig. 8 (a) The green line is photon flux per second and nm as a function of wavelength at the 0.8 cm2 substrate. The black line is the integrated photon flux and the band gaps for the different particles are indicated by the vertical dotted lines. The scale of the integrated photon flux is different from the photon flux by a factor 0.05. (b) Formal quantum efficiency as a function of particle size. | ||
The resultant overall FQE during the four hour of simulated solar illumination is given in Fig. 8.b. It is evident from the figure that the smaller particles are the most reactive ones. In Fig. 7.b the larger particles in the measured set performed better than the middle sized one, which here can be attributed not to an increase of the reactivity but to an increased absorption.
The FQE is a lower limit to the overall efficiency as it assumes that the degradation is a one- step and one-electron reaction. That is certainly not the case and approximately 70 steps are needed for a complete mineralization of methylene blue into carbon dioxide and water. We have not measured to which extend the degradation occurs and which rest products that form, wherefore the FQE is reported as an honest lower limit. For the smallest particles, which are the most reactive ones, the data states that approximately 1000 photons needs to be absorbed for one reaction to occur. This may not sound impressive, but is actually better than what a first glance may indicate. The reaction occurs at the solid, liquid interface and as no external convection is applied there will be inherent mass transport limitation. This is manifested as a time-dependent reaction rate which is evident from Fig. 6.a where the initial reaction rate for the 3.7 nm sample is a factor 4.5 higher than the overall rate given in Fig. 8.b. The initial rate thus give an lower estimate of the quantum efficiency of 0.5% and a upper, somewhat unrealistic limit in the case of complete mineralization of approximately 30%.
In an article by Mills et al.5 the photo catalytic degradation of stearic acid in solid form deposited on photocatalyst were investigated for the commercial products Degussa P25 and the self cleaning glass Pilkinton Activ™. For illumination with 254 nm light they report an initial FQE of 2.5 × 10⁻³ for the Degussa P25 and 1 × 10⁻⁴ for the Pilkinton Activ™. This is comparable with and maybe even somewhat less than what we report here. It is however hard to directly compare the numbers due to differences in the experimental approaches.
Even thought the smallest particles appear to be most reactive there is a concern over their stability. Visible inspection and optical absorption indicates that the film containing the smaller particles degraded somewhat during the measurement, while the middle sized and larger ones show no sign of degradation.
Self cleaning windows with photoactive semiconductor films works by two different mechanisms. Absorbed organic molecules are oxidized by photogenerated holes and hydroxyl radicals. Under UV light the surface also become more hydrophilic. This spread out the water film on the surface, which decreases the adhesion of the organic decomposition products that then more easily are washed away in case of rain. In a simple experiment we tested if the deposited ZnO quantum dot films also show this UV induced hydrophilicity. In Fig. 9 a drop of water on a particle film before and after half an hour of UV illumination is displayed. The contact angle clearly deceases as a consequence of the UV illumination indicating an increased hydrophilicity also for the ZnO particle films.
 | ||
| Fig. 9 One drop of water on a particle film before and after half an hour of illumination with UV light. The contact angle decreases markedly after UV-illumination. | ||
3.4 Photocatalytic solar water splitting
As evident from the section above the ZnO nanoparticles are photocatalytic towards degradation of organic dyes. Probably one of the most exiting photocatalytic reactions discussed in the literature is solar water splitting were sunlight is used to divide water into molecular hydrogen and oxygen, which if made efficiently enough could have a huge impact on society and how we deal with its energy demand. ZnO will in itself newer be a material that could drive this reaction in an economical feasible rate, simply because the large band gap only allows for absorption of a rather small part of the solar spectrum. This has however not been reasons enough to prevent studies to be made of intrinsic ZnO in different geometries.24–27 The motivation behind these studies is generally that if the process could be made to work for ZnO, the system may be modified by for example doping, in order to increase the optical absorption, and thus potentially increase the rate of water splitting to more technological interesting levels.28–32With the same motivation we measured the water splitting of the particles in this work. These measurements were not done on the same samples as the degradation of methylene blue but on samples prepared in the same way at the same occasions. Absorption data corresponding to Fig. 5 for these samples are given in the supporting information. The results of these measurements under chopped illumination are given in Fig. 10.
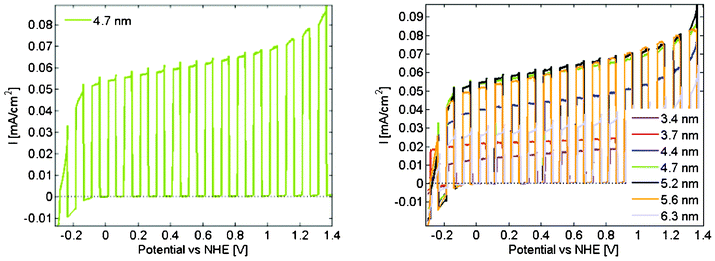 | ||
| Fig. 10 (a). Current density as a function of potential under chopped simulated AM 1.5 solar illumination for the samples with 4.7 nm particles. (b) Corresponding data for all the measured samples. | ||
The data clearly demonstrate the presence of a photo driven reaction that we can ascribe to water oxidation and production of oxygen gas. The other half reaction of water reduction and hydrogen gas production occurs at the platinum counter electrode. The dark current is very close to zero which indicates that the films are stable under the conditions used. This in addition to that the films are rather unaffected by the experiment make it clear that what we see really is water oxidation and not simply photo-degradation of the electrode.
The magnitude of the current is not very high as may be expected due to the high band gap. What is investigated here is only one of the half-reactions in the water splitting reaction which is done in a three electrode system. During such a measurement it is hard to get an unambiguous measure on the overall efficiency. One such measure is to notice that the photocurrent only vary moderately in a rather large potential interval corresponding to a Fermi level below the flat band potential20 and to read of the current below that level. This has been done at 0.6 V vs. NHE. This would then contribute to an overall solar-to- hydrogen efficiency (STH) of 0.075% with respect to the oxidation half reaction. This is a low number but compare to the maximum efficiency of a system with such a high band gap which is 0.6%, it is reasonable good. A measure of the cell performance is the internal quantum efficiency, QE, here defined as the quotient between the current expressed as electron flow at 0.6 V vs. NHE and the number of absorbed photons per second in the film. The result of this analysis is displayed in Fig. 11. The trend with particle size is less clear than for the photo degradation of methylene blue. The data is more scattered but centered around 10% efficiency. If the band gap of the particles could be decreased by doping without diminishing the demonstrated photocatalysis, the system may actually be worth studying further with respect to solar water splitting.
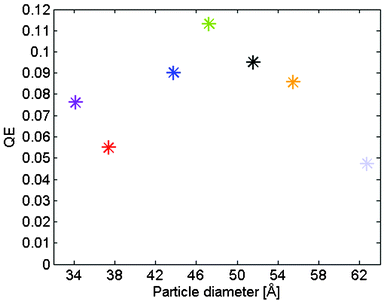 | ||
| Fig. 11 Internal quantum efficiency for water oxidation as a function of particle size. | ||
The photocurrent was measured for illumination on both the front and the back side (see supporting information) for some of the samples. The photocurrent is somewhat lower for back side illumination. This is because a part of the spectrum that can be absorbed in the film already is absorbed in the glass. Also the limited diffusion length of the charge carriers comes into consideration. If the absorption in the glass is taken into account the diffusion of charge carriers does not seem to be a limiting factor in the process for these film thicknesses.
4. Conclusions
We have synthesized thin transparent films of ZnO quantum dots with particle sizes ranging from 3.5 to 6.5 nm. The transmittance for light in the visible range for these films is larger than for the bare substrate demonstrating that they function as antireflective coatings on the FTO. The negative absorption reaches down to −0.25 which represent a 77% increase in the transmitted light. Over a large part of the visible spectrum the increased transmittance is over 25%, and we demonstrate this to be a thin film effect.We have shown that these films show a relatively high photocatalytic activity towards decomposition of our model substance methylene blue while illuminated with simulated AM 1.5 G solar light. The photocatalytic activity is largest for the smallest particles, but the larger ones also perform reasonable well due to increased absorption. A lower limit on the initial formal quantum efficiency for the smallest particles is in the order of 0.5%. Taking into consideration that the complete mineralization of an organic contaminant, like methylene blue, is a many electron process this turns out to be a competitive result. It is in the same order of magnitude as what's reported for commercial photocatalytic products like Degussa P25 and Pilkiton Active™. We also demonstrated an increased hydrophilicity for the films under UV radiation.
Finally we measured the photocatalytic oxidation of water into oxygen as a function of applied bias in a three electrode system. ZnO in its pure form will never be the material of choice for solar water splitting as a consequence of its high band gap and resultant low light harvesting in the solar spectrum. Results for pure ZnO is however interesting as it give guidance into what may be expected for doped systems that have the potential of absorbing light also in the visible region. The overall efficiency showed a modest 0.01% but the internal quantum efficiency reached over 10%.
Acknowledgements
We are grateful for financial support from the Carl Tryggers foundation, the Royal Swedish Academy of Science and Ångpanneföreningens Forskningsstiftelse.References
- D. M. Blake, National Renewable Energy Laboratory, 2001 Search PubMed , NREL TP-510-31319.
- D. S. Bhatkhande, V. G. Pangarkar and A. Beenackers, J. Chem. Technol. Biotechnol., 2002, 77, 102–116 CrossRef CAS.
- J. M. Herrmann, Top. Catal., 2005, 34, 49–65 CrossRef CAS.
- C. C. Chen, J. Mol. Catal. A: Chem., 2007, 264, 82–92 CrossRef CAS.
- A. Mills, A. Lepre, N. Elliott, S. Bhopal, I. P. Parkin and S. A. O'Neill, J. Photochem. Photobiol., A, 2003, 160, 213–224 CrossRef CAS.
- S. Chakrabarti and B. K. Dutta, J. Hazard. Mater., 2004, 112, 269–278 CrossRef CAS.
- M. A. Behnajady, N. Modirshahla, N. Daneshvar and M. Rabbani, J. Hazard. Mater., 2007, 140, 257–263 CrossRef CAS.
- N. Daneshvar, D. Salari and A. R. Khataee, J. Photochem. Photobiol., A, 2004, 162, 317–322 CrossRef CAS.
- D. Li and H. Haneda, Chemosphere, 2003, 51, 129–137 CrossRef CAS.
- M. A. Behnajady, N. Modirshahla and R. Hamzavi, J. Hazard. Mater., 2006, 133, 226–232 CrossRef CAS.
- B. Pal and M. Sharon, Mater. Chem. Phys., 2002, 76, 82–87 CrossRef CAS.
- R. Ullah and J. Dutta, J. Hazard. Mater., 2008, 156, 194–200 CrossRef CAS.
- A. Akyol, H. C. Yatmaz and M. Bayramoglu, Appl. Catal., B, 2004, 54, 19–24 CrossRef CAS.
- C. A. K. Gouvea, F. Wypych, S. G. Moraes, N. Duran, N. Nagata and P. Peralta-Zamora, Chemosphere, 2000, 40, 433–440 CrossRef CAS.
- C. Hariharan, Appl. Catal., A, 2006, 304, 55–61 CrossRef CAS.
- C. Lizama, J. Freer, J. Baeza and H. D. Mansilla, Catal. Today, 2002, 76, 235–246 CrossRef CAS.
- S. Sakthivel, B. Neppolian, M. V. Shankar, B. Arabindoo, M. Palanichamy and V. Murugesan, Sol. Energy Mater. Sol. Cells, 2003, 77, 65–82 CrossRef CAS.
- T. J. Jacobsson and T. Edvinsson, Inorg. Chem., 2011, 50, 9578–9586 CrossRef CAS.
- D. Raymand, T. J. Jacobsson, K. Hermansson and T. Edvinsson, J. Phys. Chem. C, 2012, 116, 6893–6901 CAS.
- T. J. Jacobsson and T. Edvinsson, J. Phys. Chem. C, 2012, 116, 15692–15701 CAS.
- E. A. Meulenkamp, J. Phys. Chem. B, 1998, 102, 5566–5572 CrossRef CAS.
- L. Spanhel and M. A. Anderson, J. Am. Chem. Soc., 1991, 113, 2826–2833 CrossRef CAS.
- H. F. McMurdie, M. C. Morris, E. H. Evans, B. Paretzkin and W. Wong-Ng, Powder Diffr., 1986, 1, 40–43 CAS.
- T. F. Jaramillo, S. H. Baeck, A. Kleiman-Shwarsctein and E. W. McFarland, Macromol. Rapid Commun., 2004, 25, 297–301 CrossRef CAS.
- A. Wolcott, W. A. Smith, T. R. Kuykendall, Y. P. Zhao and J. Z. Zhang, Adv. Funct. Mater., 2009, 19, 1849–1856 CrossRef CAS.
- K. S. Ahn, S. Shet, T. Deutsch, C. S. Jiang, Y. F. Yan, M. Al-Jassim and J. Turner, J. Power Sources, 2008, 176, 387–392 CrossRef CAS.
- C. M. Janet, S. Navaladian, B. Viswanathan, T. K. Varadarajan and R. P. Viswanath, J. Phys. Chem. C, 2010, 114, 2622–2632 CAS.
- Y. Li and J. Z. Zhang, Laser Photonics Rev., 2010, 4, 517–528 CrossRef CAS.
- Y. Yan, K. S. Ahn, S. Shet, T. Deutsch, M. Huda, S. H. Wei, J. Turner and M. M. Al-Jassim, in Solar Hydrogen and Nanotechnology II, ed. J. Guo, Bellingham, USA, 2007, vol. 6650, pp. H6500–H6500 Search PubMed.
- M. A. Mayer, D. T. Speaks, K. M. Yu, S. S. Mao, E. E. Haller and W. Walukiewicz, Appl. Phys. Lett., 2010, 97 Search PubMed.
- K. Maeda, T. Takata, M. Hara, N. Saito, Y. Inoue, H. Kobayashi and K. Domen, J. Am. Chem. Soc., 2005, 127, 8286–8287 CrossRef CAS.
- X. Y. Yang, A. Wolcott, G. M. Wang, A. Sobo, R. C. Fitzmorris, F. Qian, J. Z. Zhang and Y. Li, Nano Lett., 2009, 9, 2331–2336 CrossRef CAS.
Footnote |
| † Electronic supplementary information (ESI) available: summary of key data concerning the photodegradation of methylene blue; the entire set of figures corresponding to Fig. 6.a, 6.b, 6.c; a description of how the solar simulator lamp was calibrated and how the photon flux was determined; summary of key data concerning the water splitting experiments; the entire set of figures corresponding to Fig. 10.a; figures for current against potential under chopped illumination while illuminated from the back side for some of the samples. See DOI: 10.1039/c2ra21566g |
| This journal is © The Royal Society of Chemistry 2012 |
