Beet juice utilization: Expeditious green synthesis of noble metal nanoparticles (Ag, Au, Pt, and Pd) using microwaves†
Jiahui
Kou
and
Rajender S.
Varma
*
Sustainable Technology Division, National Risk Management Research Laboratory, U.S. Environmental Protection Agency, 26 West Martin Luther King Drive, MS 443, Cincinnati, Ohio 45268, USA. E-mail: Varma.Rajender@epa.gov
First published on 31st August 2012
Abstract
Metal nanoparticles of Ag, Au, Pt, and Pd were prepared in aqueous solutions via a rapid microwave-assisted green method using beet juice, an abundant sugar-rich agricultural product, which served as both a reducing and a capping reagent. The Ag nanoparticles with capping prepared using beet juice exhibit higher catalytic activity and durability than those prepared using NaBH4 for the transformation of 4-nitrophenol to 4-aminophenol.
1. Introduction
Noble metal nanoparticles always attract significant interest due to their unique optical, electronic, mechanical, magnetic, and chemical properties, which result in numerous applications in different technological areas.1–6 Although various methods have been employed for the synthesis of metal nanoparticles, most of them proceed via the use of highly reactive reducing agents, such as sodium borohydride (NaBH4) and hydrazine, which are not environmentally friendly. The use of toxic chemicals in these synthetic procedures limits their practical applications taking into account the environmental security.Green technology is a set of principles or rather a chemical philosophy that encourages the design of products and processes that reduce or eliminate the use and generation of hazardous substances.7 Following these principles, the use of organisms in this area, including microbes, fungi, and plants, is rapidly increasing due to several advantages, namely being thermally and chemically stable, inexpensive, biocompatible, and most importantly, environmentally friendly.8–12 The ability of plants in the production of metal nanoparticles has opened a new and exciting approach toward the development of these natural nano-factories. Plants which can capture almost 75% of the light energy from sun and convert it into chemical energy have more advantages as sustainable and renewable resources than microbes and enzymes that need expensive methodologies for production.8,13,14 Furthermore, the chemicals in the plants, such as antioxidants and sugars, play significant roles in the fabrication of nanoparticles. Consequently, plants with reducing compounds are the preferred choice for noble metal synthesis, because metal ions could be reduced to the corresponding metals in the absence of any other chemical.11,13–16
In the synthesis of noble metal nanoparticles by the reduction of the corresponding metal ion salt solutions, the reducing agent is an important factor. As a result, plants with various reducing agents are favourable candidates for the fabrication of noble metal nanoparticles. Beet is an abundant agricultural product in the Chenopodiaceae family, whose purple root is very important in the production of table sugar and mangelwurzel. Because of the sugar-rich content, it has great reductive capability, which can be utilized in the synthesis of nanomaterials, but it has not been investigated in detail.17,18
In the present investigation, beet juice was used for the synthesis of nano metals such as Ag, Au, Pt, and Pd under microwave (MW) irradiation conditions, in an environmentally benign solvent, water. Further, a comparative investigation was conducted under different conditions. The prepared Ag nanoparticles show excellent catalytic efficiency in transforming 4-nitrophenol to 4-aminophenol with high reusability, which is much higher than those prepared by NaBH4.
2. Experimental
2.1 Preparation of beet juice
50 g beet root (product of Mexico) and 100 mL water was placed in a blender and blended 3 times (10 min for each time). Then the blended mixture of juice and pulp was filtered through a filter paper to obtain beet juice.2.2 Synthesis of metal nanoparticles
In a typical procedure, 0.3 mmol silver nitrate (AgNO3) and 6 mL beet juice were mixed in a 10 mL thick walled glass tube sealed with a cap at room temperature to form a clear solution. The reaction mixture was irradiated in a CEM Discover focused MW synthesis system maintaining a temperature of 100 °C (monitored by a built-in infrared sensor) for 20 min with a maximum pressure of 280 psi. The resulting precipitated Ag nanoparticles were then washed several times with water to remove excess beet juice. Similar experiments were carried out by varying the beet juice content, temperature, and reaction time. A control experiment under conventional heating conditions was also conducted in a stainless steel autoclave with a Teflon liner, and heated in the oven at 100 °C for 60 min, the same temperature reached in the MW system. Comparative experiments were performed using 2 mmol of glucose or NaBH4 as a reducing reagent.2.3 Characterization
The crystal structures of prepared samples were investigated using an X-ray diffractometer (Xpert, Pro, Holland). The morphology was examined by transmission electron microscopy (TEM) (JEOL, JEM-2100, Japan) and field emission scanning electron microscopy (FESEM) (JEOL, JSM-7600F, Japan). The as-prepared Ag nanoparticles and dried beet were detected by Fourier transform infrared spectroscopy (FTIR) (Perkin Elmer, spectrum 2000, USA) and thermogravimetric analysis–gas chromatography–mass spectroscopy (TGA-GC-MS) (Perkin Elmer, Pyris 1 TGA, USA–Perkin Elmer, Clarus 600, USA–Perkin Elmer, Clarus 600T, USA).2.4 Evaluation of catalytic activity of as-prepared Ag nanoparticles
Catalytic reduction experiments of 4-nitrophenol were performed to evaluate the catalytic efficiency and reusability of prepared Ag nanoparticles. In a typical experiment, a mixture of 19.5 mL water, 0.5 mL of 10 mM 4-nitrophenol, and 0.125 mol NaBH4 was first prepared in a 40 mL vial at room temperature, and then 0.075 mmol Ag nanoparticles was added with magnetic stirring. After reaction, the reaction mixture was filtered by a Millipore syringe driven filter to obtain a clear solution for UV/Vis spectroscopy (Agilent Hewlett-Packard, 8453, USA) analysis. For comparison, the control experiment was also carried out under similar conditions without Ag nanoparticles.The durability of the Ag nanoparticle catalytic activity was evaluated using repeated experiments of 4-nitrophenol reduction. In this experiment, the 4-nitrophenol concentration of the reacted solution was measured after 2 min of addition. In the beginning of each experimental cycle, 0.5 mL 10 mM 4-nitrophenol and 0.125 mol NaBH4 were added into the reactor to compensate.
3. Discussion
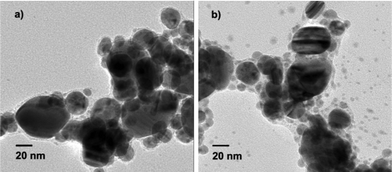
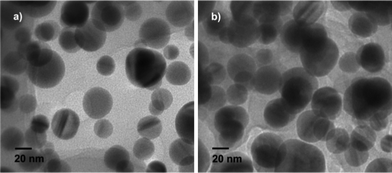
TEM images of Ag particles obtained under different conditions are shown in Fig. 1. When 6 mL of beet juice was used, the Ag nanoparticles obtained are found to be mostly spherical with sizes ranging from 20 to 40 nm (Fig. 1a). With decreasing amounts of beet juice, the obtained Ag nanoparticles become bigger; in addition, the shape and size of the nanoparticles lose uniformity. The sizes of as-prepared Ag nanoparticles range from 10 to 100 nm with 3 mL beet juice, and from 10 to 150 nm with 1 mL beet juice. Moreover, the chemicals in beet juice served as capping agents on the surface of the Ag nanoparticles when the beet juice amounts used were 6 mL and 3 mL, according to the TEM images (Fig. 1a and 1b). However, no obvious capping can be observed when 1 mL beet juice was (Fig. 1c) used. These results imply that beet juice acts as a reducing agent as well as a capping agent for the formation of Ag nanoparticles; the usage of beet juice can also affect their shape and size. In comparison, no Ag nanoparticles are produced without beet juice, which indicates the crucial reductive role of beet juice on the formation of Ag nanoparticles. Temperature also plays a significant role in the synthesis of Ag nanoparticles. Ag nanoparticles prepared at 80 °C (Fig. 2a) and 60 °C (Fig. 2b) are not as uniform as those obtained at 100 °C (Fig. 1a). However, the formation of Ag nanoparticles is not so sensitive to reaction time. The structures of nanoparticles obtained at 10, 20, and 60 min are similar (Fig. 3), and are spherical with sizes of 20–40 nm. Therefore, the Ag crystals do not grow once they are formed under MW irradiation conditions in the presence of beet juice. To compare with beet juice, Ag particles were also prepared using glucose as a reducing agent; the ensuing Ag particles are bigger (500 nm) than those obtained by using beet juice (Fig. S1†(ESI)). | ||
| Fig. 1 TEM images of Ag nanoparticles obtained by using different beet juice content. a) 6 mL; b) 3 mL; c) 1 mL. | ||
 | ||
| Fig. 2 TEM images of Ag nanoparticles obtained at different temperatures. a) 80 °C; b) 60 °C. | ||
 | ||
| Fig. 3 TEM images of Ag nanoparticles obtained at different times. a) 10 min b) 60 min. | ||
It is interesting to note that a lot of microspheres are formed in the products except the aforementioned organic molecule capping on the surface of Ag nanoparticles (Fig. 4). When the use of beet juice was 6 mL (reaction temperature: 100 °C), the diameters of most microspheres are about 0.5–0.6 μm in spite of the different MW irradiation times (10, 20 and 60 min). The consumption of beet juice is significant for the formation of the microspheres. With 1 mL of beet juice, no microspheres were detected in the product. When the use of beet juice was 3 mL, the diameters of the microspheres, 0.35–0.45 μm, are smaller than those prepared using 6 mL. The reaction temperature also can affect the construction of microspheres: those obtained at 60 °C are very big (12 μm of diameter), and they are not as compact as those produced at 100 °C, according to the TEM images (Fig. 4e and 4a, respectively). The microspheres were also studied by SEM (Fig. 4f), and their surfaces are smooth.
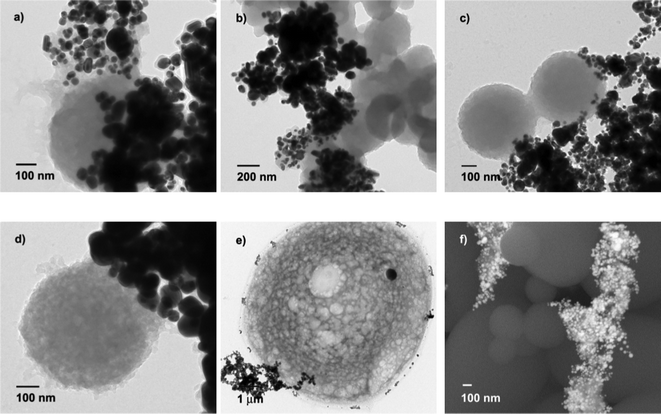 | ||
| Fig. 4 The formation of organic microspheres under different conditions. TEM image of microspheres produced using: a) 6 mL of beet juice, 20 min, 100 °C; b) 3 mL of beet juice, 20 min, 100 °C; c) 6 mL of beet juice, 10 min, 100 °C; d) 6 mL of beet juice, 60 min, 100 °C; e) 6 mL of beet juice, 20 min, 60 °C; SEM image of e) 6 mL of beet juice, 20 min, 100 °C. | ||
In order to clarify the composition of the microspheres and capping in the as-prepared Ag sample, energy dispersive X-ray spectroscopy (EDX) was used to distinguish the elements in different areas (Fig. 5). A TEM grid with carbon film was avoided to determine the carbon element in the samples; a TEM grid with pure silicon monoxide film was used. In the area Edx1 and Edx3, which respectively correspond to formed microspheres and capping, only the elements carbon and copper were found. As is commonly known, copper peaks can be attributed to the copper grid. In addition, the hydrogen element cannot be detected because of the limits of EDX detection. Thus, it can be speculated that the microsphere may be capped with monatomic carbon or organics. According to the aforementioned results, the microsphere and capping should come from the chemical constituents in beet juice, which does not have monatomic carbon according to the U. S. Department of Agriculture (USDA) nutrient database. It is almost impossible for organics to dehydrogenate to give carbon in the reducing aqueous solution, so the composition of the microsphere and the capping agent should be organics. Additionally, no organic microspheres were observed when simply beet juice without AgNO3 was irradiated (Fig. S2†, ESI), implying the important role of AgNO3 on the formation of the organic microsphere. The reason may be that AgNO3 can absorb MW to reach a high temperature, conducive to the aggregation of organics in beet juice around AgNO3. The organic microspheres also were not produced without MW irradiation (Fig. S3†, ESI). All of the results mentioned above suggest that the organic microsphere cannot be obtained in the absence of beet juice and MW irradiation. As shown in Fig. 5c and 5f, the Edx2 and Edx4 areas all have silver, copper, and carbon, and Edx2 also has traces of chlorine elements. Because copper and carbon should be assigned to the copper grid and capping, respectively, the Edx2 and Edx 4 areas should be silver nanoparticles. According to the high angle annular dark field (HAADF) images (Fig. 5b and 5e), Ag nanoparticles are enclosed by capping. However, it is worth noting that Ag nanoparticles seldom deposit on the surface of formed microspheres. Consequently, the organic molecules of the microspheres may be different from those of capping. Fig. 5g is a high resolution transmission electron microscopy (HRTEM) image of Ag nanoparticles. The lattice fringes show a fringe spacing of 0.204 nm, corresponding to the (200) plane of Ag. Fast Fourier transforms (FFT) can be obtained according to the HRTEM image (Fig. 5h), implying that the as-prepared Ag nanoparticles are single crystals.
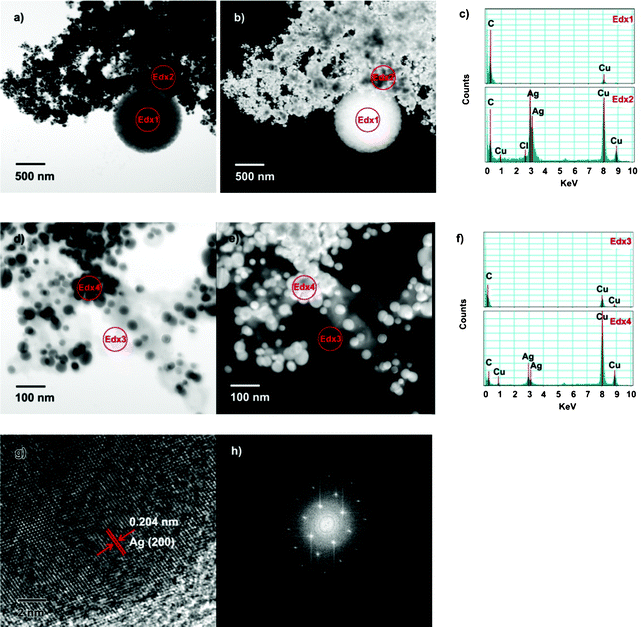 | ||
| Fig. 5 Images of the typical Ag nanoparticles prepared with beet juice. a) TEM image; b) HAADF images; c) EDX spectra of area Edx 1 and Edx 2; d) TEM image; e) HAADF images; f) EDX spectra of area Edx 3 and Edx 4; g) HRTEM image; h) FFT image obtained according to HRTEM. | ||
The FTIR (Fig. 6) and TGA-GC-MS (Fig. 7) were used to analyze the organics in beet before and after MW irradiation. The FTIR spectra were measured within the range from 4000 to 500 cm−1. Before reaction, the broad peak located at 3335 cm−1 may be attributed to O–H stretching modes of vibration in alcoholic hydroxyl functional groups and N–H stretching vibrations in amides and amines. The presence of a peak at 2910 cm−1 indicates the C–H stretching vibrations in the hydrocarbon chains. The frequency observed at 1739 cm−1 is due to the carbonyl functional group of ketones, aldehydes, and carboxylic acid, while that at 1609 cm−1 is assigned to an amide band. The frequencies at 1245–1232 cm−1 are attributed to CH2 and CH3 symmetric bending. In addition, the peaks at 1027 and 657 cm−1 should be due to C–O stretching vibrations and out-of-plane rocking of N–H or aromatic C–H, respectively.17,18 It is worth noting that after MW irradiation, the frequencies of the samples are totally different. All of the aforementioned peaks are lost, and two new peaks appear. The peak at 2328 cm−1 is assigned to CO2, and that at 2103 cm−1 should be attributed to the stretching of –C![[double bond, length as m-dash]](https://www.rsc.org/images/entities/char_e001.gif) C
C![[double bond, length as m-dash]](https://www.rsc.org/images/entities/char_e001.gif) C– or –N
C– or –N![[double bond, length as m-dash]](https://www.rsc.org/images/entities/char_e001.gif) C
C![[double bond, length as m-dash]](https://www.rsc.org/images/entities/char_e001.gif) O–. Therefore, the condensation reaction should occur in a metal salt–beet juice solution under MW irradiation, which promotes the formation of an organic microsphere. The weight loss data and total ion chromatogram detected by TGA-GC-MS are shown in Fig. 7. TGA experiments were performed at a heating rate of 10 °C min−1. Both TGA and GC-MS results are obviously different between the as-prepared Ag sample and dried beet without MW irradiation. The apparent organic decomposition of the Ag sample and dried beet occurs between 200–445 °C with a mass loss of 14.7%, and 200–400 °C with a mass loss of 62.4%, respectively. Accordingly, the obtained chromatogram peaks of the Ag sample and dried beet are also different. The highest peak of the Ag sample is located at 13.09 min (mass 41, 57, 70, 83, 98, 112) which may be organics with ethyl fragments, while that peak was not detected in the dried beet. There are more peaks obtained in the dried beet; the two highest peaks are located at 12.52 (mass 52, 66, 99) and 14.23 min (mass 53, 81, 109, 124), which could possibly be assigned to phenol and methoxy phenol, respectively. The TGA-GC-MS experiments were repeated 3 times for each sample, and similar results were obtained. These facts further prove the changes of the chemicals in beet before and after MW irradiation.
O–. Therefore, the condensation reaction should occur in a metal salt–beet juice solution under MW irradiation, which promotes the formation of an organic microsphere. The weight loss data and total ion chromatogram detected by TGA-GC-MS are shown in Fig. 7. TGA experiments were performed at a heating rate of 10 °C min−1. Both TGA and GC-MS results are obviously different between the as-prepared Ag sample and dried beet without MW irradiation. The apparent organic decomposition of the Ag sample and dried beet occurs between 200–445 °C with a mass loss of 14.7%, and 200–400 °C with a mass loss of 62.4%, respectively. Accordingly, the obtained chromatogram peaks of the Ag sample and dried beet are also different. The highest peak of the Ag sample is located at 13.09 min (mass 41, 57, 70, 83, 98, 112) which may be organics with ethyl fragments, while that peak was not detected in the dried beet. There are more peaks obtained in the dried beet; the two highest peaks are located at 12.52 (mass 52, 66, 99) and 14.23 min (mass 53, 81, 109, 124), which could possibly be assigned to phenol and methoxy phenol, respectively. The TGA-GC-MS experiments were repeated 3 times for each sample, and similar results were obtained. These facts further prove the changes of the chemicals in beet before and after MW irradiation.
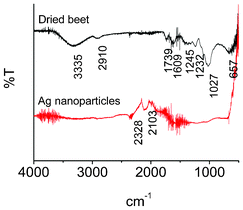 | ||
| Fig. 6 FTIR spectra of dried beet and as-prepared Ag nanoparticles. | ||
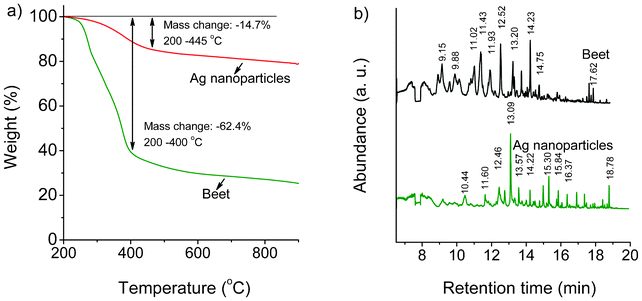 | ||
| Fig. 7 TGA-GC-MS image of as-prepared Ag nanoparticles and dried beet. a) Weight loss data from TGA; b) total ion chromatogram detected by GC-MS. | ||
The XRD patterns of the as-prepared samples prove the phase of the Ag nanoparticles (Fig. 8a and 8b). The peaks at 37.9, 44.1, 64.7, and 77.5 can be assigned to (111), (200), (220), and (311) planes of the cubic Ag. However, AgCl peaks were also detected in addition to the Ag peaks, because of the Cl element present in beet juice. In the elemental analysis, chlorine does exist in beet juice (Fig. 5c). XRD patterns obtained at different reaction times are shown in Fig. 8a. The AgCl peaks are higher when the irradiation time was shorter. Hence, AgCl can be reduced to form Ag by beet juice under MW irradiation conditions. The effect of temperature was also investigated. When the reaction temperature was 60 °C, the Ag peaks are weak. With the increase of reaction time, the Ag peaks increase while those of AgCl decrease. Consequently, the peaks of Ag nanoparticles obtained at 100 °C are the highest among 60, 80, and 100 °C, thus indicating that a high temperature is helpful for the formation of Ag nanoparticles. Comparative experiments were carried out under conventional heating conditions, as shown in Fig. S4† (ESI). Even after 60 min, the Ag peaks obtained by conventional heating are still very weak, and no peaks can be found in the pure beet juice. The beet juice method is general and can be extended to other noble metals such as Au, Pt, and Pd; XRD analysis clearly confirms their metallic state, as Fig. 8c shows. The peaks at 2θ = 38.3, 44.6, 64.7, and 77.5 for Au nanoparticles are easily indexed respectively, to the diffraction of the (111), (200), (220), (311) planes (PDF#01-1174); the Pt peaks at 2θ = 39.7, 46.3, 67.3 correspond to (111), (200), and (220) (PDF#01-1190); the peaks at 40.4, 46.8, and 68.4 can be assigned to (111), (200), and (220) planes of the Pd crystal (PDF#01-1201). Fig. 9 displays the TEM images of typical Au, Pt, and Pd samples. The sizes of all of these samples are below 100 nm; the average diameters of Au, Pt, and Pd nanoparticles are 70, 3, 5 nm, respectively, and all of them are capped with organics. In addition, organic microspheres are formed in these samples as well, as shown in Fig. 9d, 9e, and 9f. Similar to the Ag samples, the obtained Au and Pd nanoparticles cannot deposit on the surface of the formed organic microspheres. However, Pt nanoparticles can cover the surface of microspheres. These results mean that Pt nanoparticles have better interaction with the microspheres than other metals.
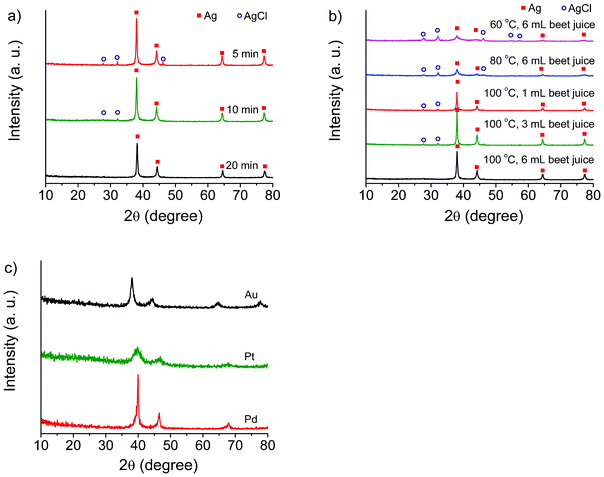 | ||
| Fig. 8 XRD patterns of as-prepared samples. a) Ag samples obtained at different times; b) Ag samples obtained by using different temperatures and beet juice amounts; c) Au, Pt, and Pd samples. | ||
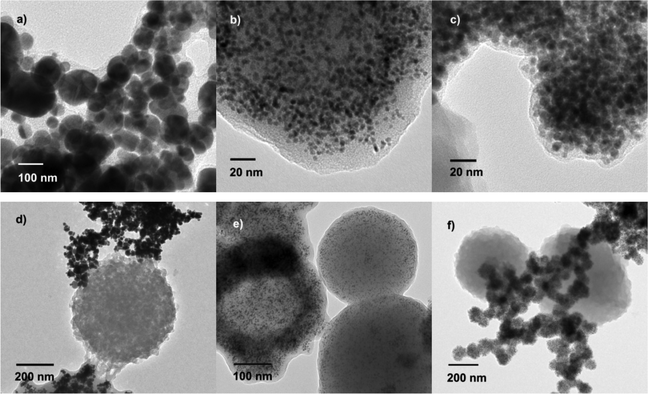 | ||
| Fig. 9 TEM images of typical Au, Pt, and Pd samples. a) Au with capping; b) Pt with capping; c) Pd with capping; d) Au with organic microspheres; e) Pt with organic microspheres; f) Pd with organic microspheres. | ||
The reduction of 4-nitrophenol to 4-aminophenol was used as a model to investigate the potential catalytic properties of as-prepared Ag nanoparticles. Before reaction, only the peak at 400 nm is observed, which can be assigned to 4-nitrophenol (Fig. 10). After the addition of Ag nanoparticles, the peak of 4-nitrophenol disappears, and a new peak appears at 290 nm, which is ascribed to the product, 4-aminophenol.19,20 The catalytic reduction efficiency of as-prepared Ag nanoparticles could quickly reach 100% within 2 min. The yellow color of the 4-nitrophenol solution faded and the solution became colorless. The catalytic durability of Ag nanoparticles was found to be very encouraging; 4-nitrophenol could be completely reduced within 2 min after every addition even after five runs, thus implying the excellent stable catalytic performance of Ag nanoparticles. After 5 runs, the Ag nanoparticles were recovered for XRD analysis and as Fig. S5† (ESI) shows, all of the XRD diffraction peaks correspond to Ag peaks and no impurity was produced in the reaction, further confirming the stability of the Ag nanoparticles. In contrast, the solutions in the absence of a catalyst did not show any change in the intensity of absorption peak of 4-nitrophenol even after 30 min (Fig. 10c). In addition, the catalytic activity of Ag nanoparticles prepared by NaBH4 was investigated to compare with those prepared by beet juice. Under the same conditions, the reaction rate of the Ag sample prepared by NaBH4 is much lower than that prepared by beet juice. The complete conversion of 4-nitrophenol needs 20 min on the former catalyst, but only 2 min on the latter, as Fig. 10d displays. Moreover, the catalytic activity decreased after every run of reaction; the complete conversion of 4-nitrophenol needs 40 min in the third run. These facts mean the Ag catalyst prepared by beet juice is more efficient and displays more durable catalytic activity than that prepared by NaBH4. The good dispersion of Ag nanoparticles in the reaction mixture could be one of the reasons. Additionally, the organic capping formed may be helpful in enhancing the contact between reactant and catalyst, as well as in protecting the Ag nanoparticles from inactivation.
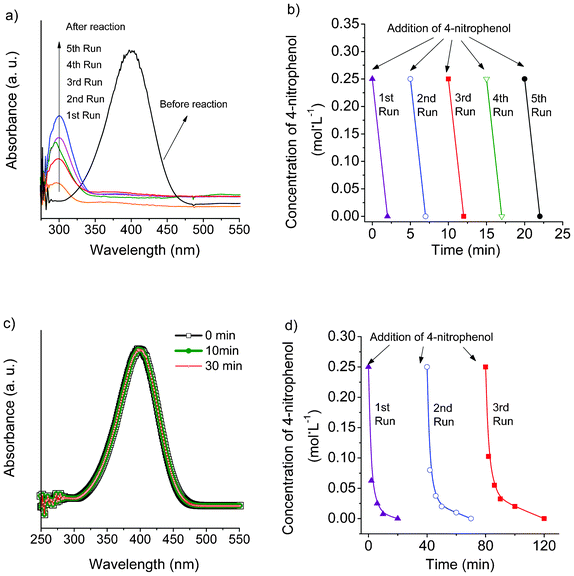 | ||
| Fig. 10 Catalytic reduction of 4-nitrophenol. a) UV-vis spectra of solutions of reaction mixture in the presence of Ag nanoparticles prepared by beet juice; b) catalytic activity and recyclability of Ag nanoparticles prepared by beet juice; c) UV-vis spectra of solutions without catalyst; d) catalytic activity and recyclability of Ag nanoparticles prepared by NaBH4. | ||
4. Conclusion
In summary, a rapid microwave-assisted green method has been developed for the facile synthesis of metal nanoparticles. The method uses no additional surfactants or reducing agents and is green in nature. Beet juice acted as both a reducing and a capping agent. The sizes of obtained Ag, Au, Pt, and Pd nanoparticles are all below 100 nm, and capped with organics. The Ag nanoparticles prepared by beet juice exhibit higher catalytic activity and durability than those prepared by NaBH4 for the reduction of 4-nitrophenol to 4-aminophenol, possibly because of the organic capping and better dispersion.Acknowledgements
Dr Jiahui Kou is a postdoc research participant at the National Risk Management Research Laboratory, Environmental Protection Agency, administered by the Oak Ridge Institute for Science and Education (ORISE). Support from colleagues, A. Zhao and Y. Shan, is appreciated.References
- S. Guo and E. Wang, Nano Today, 2011, 6, 240 CrossRef CAS.
- T. K. Sau and A. L. Rogach, Adv. Mater., 2010, 22, 1781 CrossRef CAS.
- X. Wen, S. An, Z. Hou and Z. Jiao, Prog. Chem., 2009, 21, 1644 CrossRef CAS.
- J. Oijerholm, S. Forsberg, H. P. Hermansson and M. Ullberg, J. Electrochem. Soc., 2009, 156, P56 CrossRef.
- B. Lim, M. Jiang, P. H. C. Camargo, E. C. Cho, J. Tao, X. Lu, Y. Zhu and Y. Xia, Science, 2009, 324, 1302 CrossRef CAS.
- M. Schrinner, M. Ballauff, Y. Talmon, Y. Kauffmann, J. Thun, M. Moeller and J. Breu, Science, 2009, 323, 617 CrossRef CAS.
- P. T. Anastas and J. C. Warner, Green Chemistry: Theory and Practice, Oxford University Press, New York, 1998 Search PubMed.
- S. Iravani, Green Chem., 2011, 13, 2638 RSC.
- W. J. Crookes-Goodson, J. M. Slocik and R. R. Naik, Chem. Soc. Rev., 2008, 37, 2403 RSC.
- P. Raveendran, J. Fu and S. L. Wallen, J. Am. Chem. Soc., 2003, 125, 13940 CrossRef CAS.
- J. Virkutyte and R. S. Varma, Chem. Sci., 2011, 2, 837 RSC.
- K. B. Narayanan and N. Sakthivel, Adv. Colloid Interface Sci., 2010, 156, 1 CrossRef CAS.
- M. N. Nadagouda and R. S. Varma, Green Chem., 2008, 10, 859 RSC.
- B. Baruwati and R. S. Varma, ChemSusChem, 2009, 2, 1041 CrossRef CAS.
- M. C. Moulton, L. K. Braydich-Stolle, M. N. Nadagouda, S. Kunzelman, S. M. Hussain and R. S. Varma, Nanoscale, 2010, 2, 763 RSC.
- M. N. Nadagouda, G. Hoag, J. Collins and R. S. Varma, Cryst. Growth Des., 2009, 9, 4979 CAS.
- L. Castro, M. Luisa Blazquez, F. Gonzalez, J. A. Munoz and A. Ballester, Chem. Eng. J., 2010, 164, 92 CrossRef CAS.
- L. Castro, M. Luisa Blazquez, J. A. Munoz, F. Gonzalez, C. Garcia-Balboa and A. Ballester, Process Biochem., 2011, 46, 1076 CrossRef CAS.
- A. A. Antipov, G. B. Sukhorukov, Y. A. Fedutik, J. Hartmann, M. Giersig and H. Mohwald, Langmuir, 2002, 18, 6687 CrossRef CAS.
- S. Xiao, W. Xu, H. Ma and X. Fang, RSC Adv., 2012, 2, 319 RSC.
Footnote |
| † Electronic Supplementary Information (ESI) available. See DOI: 10.1039/c2ra21908e |
| This journal is © The Royal Society of Chemistry 2012 |
