DOI:
10.1039/C2CE25671A
(Paper)
CrystEngComm, 2013,
15, 168-174
Structure, thermal and spectroscopic properties of Tm3+-doped Li3Ba2Y3(MoO4)8 crystal as a promising candidate for 2 μm lasers†
Received
2nd May 2012
, Accepted 18th October 2012
First published on 22nd October 2012
Abstract
Tm3+:Li3Ba2Y3(MoO4)8 crystal has been grown by the top seeded solution growth (TSSG) method from a flux of Li2MoO4. The crystal crystallizes in the monoclinic system with the space group C2/c, and the unit cell parameters are a = 5.2052(6), b = 12.6763(17), c = 19.107(3), β = 91.293(12)°, V = 1260.4(3). The thermal expansion, polarized absorption and fluorescence spectra of the crystal were measured and the main spectroscopic parameters were calculated. The broad absorption bands and the large absorption cross sections around 800 nm of Tm3+:Li3Ba2Y3(MoO4)8 crystal indicate that the crystal is very suitable for diode-laser pumping. On the other hand, the broad emission bands around 2 μm show that the crystal is a potential medium for tunable and short pulse lasers.
1 Introduction
In recent years, solid-state lasers operating in the eye-safe spectral region around 2 μm have been intensively investigated because of their potential in medicine, frequency metrology, gas detection and remote sensing applications, etc. Among optically active ions exhibiting laser transitions around 2 μm, the trivalent thulium (Tm3+) ions have attracted particular interest since they possess a broad absorption band around 800 nm and can be pumped directly by the well-developed AlGaAs diode lasers. The interest in Tm3+ based hosts is also motivated by many other advantages of Tm3+ ions, such as a long lifetime of the 3F4 state, a high quantum efficiency of the 3F4 state due to the cross-relaxation process between Tm3+ ions and the wide emission bands in the range of 1800–2000 nm, which provide the opportunity for a wide tunable laser around 2 μm. Moreover, Tm3+ shows an additional infrared emission band at about 1.5 μm, which is also of great interest for optical communication, medicine, detecting and ranging applications. As a consequence, the spectral properties of Tm3+ ions in a number of solid-state hosts have been widely studied and efficient laser operation has been successfully realized.1–6
Recently, a new series of disordered molybdate compounds Li3Ba2RE3(MoO4)8 (RE = La–Lu, Y), which belong to the monoclinic system with space group C2/c, have emerged as promising laser host materials owing to the excellent physical and optical properties such as excellent chemical durability, high quantum efficiency, large absorption and emission cross-sections as well as moderate growth conditions.7–10 Until now, efficient laser operation has already been realized in Nd3+ and Yb3+-doped Li3Ba2Gd3(MoO4)8 crystals.10,11 Another attractive character of these compounds is the disordered crystal structure induced by a random distribution of RE3+ and Li+ ions at a single 8f site. When the active ions are doped into the crystal replacing the RE3+ ions, the disordered structure would induce a differentiated crystal field around them and lead to inhomogeneously broadened spectral bands. As we know, broad absorption bands reduce the sensitivity to thermal drifts of the pump wavelength, while broad emission bands are indeed very favorable for the generation of tunable and mode-locked subpicosecond lasers. Not long ago, Zaldo et al. demonstrated the great potential of Tm-Li3Ba2RE3(MoO4)8 crystal in tunable and ultrashort pulse lasers around 2 μm, i.e., with a Ti:laser as pump source, a tunable laser in the range of 1853–2009 nm with a slope efficiency up to 71%, higher than those obtained in disordered crystals to date, has been obtained in a Tm3+:Li3Ba2Lu3(MoO4)8 crystal.12 Furthermore, the large free running laser bandwidth indicated that the Tm3+:Li3Ba2Lu3(MoO4)8 crystal is definitely promising for the generation of ultrafast lasers (below 200 fs) in a mode-locked regime.
The Li3Ba2Y3(MoO4)8 is another member of the Li3Ba2RE3(MoO4)8 (RE = La–Lu, Y) family. In our previous papers, we have reported the growth and spectral properties of Nd3+, Yb3+, and Er3+-doped Li3Ba2Y3(MoO4)8 crystals.7–9 Since the radius of Y3+ ions (0.89 Å) is similar to that of Tm3+ ions (0.87 Å), it is easier to incorporate Tm3+ ions into the Li3Ba2Y3(MoO4)8 crystal with fewer lattice distortions. This makes it possible to improve the quality of the crystal and increase the crystal growth rate. Therefore, here we present the structure, thermal and spectroscopic properties of the Tm3+:Li3Ba2Y3(MoO4)8 crystal.
2 Experimental
2.1 Crystal growth
Since the incongruent melting behavior of the Li3Ba2Y3(MoO4)8 crystal prevented the use of the Czochralski method,7 the crystal growth was performed by the conventional top seeded solution growth method (TSSG) from a flux of Li2MoO4. The starting materials 2at% Tm3+-doped Li3Ba2Y3(MoO4)8 and Li2MoO4 were weighed and placed into a Pt crucible, with a molar ratio of TmLi3Ba2Y3(MoO4)8![[thin space (1/6-em)]](https://www.rsc.org/images/entities/char_2009.gif) :
:![[thin space (1/6-em)]](https://www.rsc.org/images/entities/char_2009.gif) Li2MoO4 = 1
Li2MoO4 = 1![[thin space (1/6-em)]](https://www.rsc.org/images/entities/char_2009.gif) :
:![[thin space (1/6-em)]](https://www.rsc.org/images/entities/char_2009.gif) 5. A single-crystalline bar cut along the main crystallographic axis b was used as seed. The main and hardly soluble problem in growth of Li3Ba2Y3(MoO4)8 crystals appeared to be their cracking along the cleavage plane (0 0 1). Such a cracking has been observed also for the isostructural Li3Ba2Gd3(MoO4)8 crystals,10 and it is mainly caused by the layered structure and the large anisotropy of thermal expansion coefficients of the crystals. As a result, a small thermal gradient and a slow cooling rate after growth were adopted. Detailed growth and orientation procedures can be found in ref. 9.
5. A single-crystalline bar cut along the main crystallographic axis b was used as seed. The main and hardly soluble problem in growth of Li3Ba2Y3(MoO4)8 crystals appeared to be their cracking along the cleavage plane (0 0 1). Such a cracking has been observed also for the isostructural Li3Ba2Gd3(MoO4)8 crystals,10 and it is mainly caused by the layered structure and the large anisotropy of thermal expansion coefficients of the crystals. As a result, a small thermal gradient and a slow cooling rate after growth were adopted. Detailed growth and orientation procedures can be found in ref. 9.
2.2 Characterizations
A crystal with dimensions of 0.05 × 0.09 × 0.15 mm3 was selected for single-crystal X-ray diffraction analysis. The diffraction data were collected on a Rigaku Mercury CCD diffractometer with graphite monochromated Mo Kα radiation at room temperature. A total of 1177 independent reflections were collected in the range of 2.13 < θ < 25.46, of which 1111 with I ≥ 2σ (I) were independent. The absorption correction based on the empirical PSI-scan technique was applied. The structure was solved by the direct method and refined by the full-matrix least-squares technique. The final R1 = 0.043 and wR2 = 0.112 with parameters w = 1/[σ2(Fo2) + (0.0736P)2 + 15.4672P] where P = (Fo2 + 2Fc2)/3, Δρmax = 2.17 e Å−1, Δ ρmin = −1.89 e Å−1, (Δ/σ)max < 0.0001 and S = 1.19. All calculations were carried out with the SHELXTL program package. The fractional atomic coordinates and isotropic thermal parameters are listed in Table 1, and the selected bond distances are listed in Table 2.
Table 1 Atomic coordinates (×104) and equivalent isotropic displacement parameters (Å2 × 10³) for Li3Ba2Y3(MoO4)8 crystal
| Atom |
Site |
x
|
y
|
z
|
U(eq)a |
Occupation |
|
U(eq) is defined as one third of the trace of the orthogonalized Uij tensor.
|
| Y(1) |
8f |
10![[thin space (1/6-em)]](https://www.rsc.org/images/entities/char_2009.gif) 023(2) 023(2) |
1475(1) |
−316(1) |
4(1) |
0.75 |
| Li(1) |
8f |
10![[thin space (1/6-em)]](https://www.rsc.org/images/entities/char_2009.gif) 023(2) 023(2) |
1475(1) |
−316(1) |
4(1) |
0.25 |
| Li(2) |
4e |
5000 |
1850(30) |
2500 |
51(9) |
1 |
| Ba(1) |
4e |
5000 |
4705(1) |
2500 |
9(1) |
1 |
| Mo(1) |
8f |
9995(1) |
2608(1) |
1495(1) |
5(1) |
1 |
| Mo(2) |
8f |
5103(1) |
595(1) |
919(1) |
5(1) |
1 |
| O(1) |
8f |
12![[thin space (1/6-em)]](https://www.rsc.org/images/entities/char_2009.gif) 279(11) 279(11) |
3016(5) |
2129(3) |
12(1) |
1 |
| O(2) |
8f |
8585(11) |
1457(5) |
1793(3) |
11(1) |
1 |
| O(3) |
8f |
7470(11) |
3528(4) |
1356(3) |
9(1) |
1 |
| O(4) |
8f |
11![[thin space (1/6-em)]](https://www.rsc.org/images/entities/char_2009.gif) 682(11) 682(11) |
2402(5) |
688(3) |
9(1) |
1 |
| O(5) |
8f |
3772(11) |
853(5) |
1730(3) |
14(1) |
1 |
| O(6) |
8f |
6580(11) |
1687(5) |
464(3) |
10(1) |
1 |
| O(7) |
8f |
2473(12) |
179(5) |
364(3) |
11(1) |
1 |
| O(8) |
8f |
7335(11) |
−443(5) |
1049(3) |
10(1) |
1 |
Table 2 Selected bond lengths (Å) for Li3Ba2Y3(MoO4)8 crystal
| Y(1)–O(3)#1 |
2.349(6) |
Ba(1)–O(2)#11 |
2.694(6) |
| Symmetry transformations used to generate equivalent atoms: (#1) −x + 3/2, −y + 1/2, −z; (#2) −x + 5/2, −y + 1/2, −z; (#3) −x + 2, −y, −z; (#4) x + 1, y, z; (#5) −x + 1, −y, −z; (#6) −x + 1, y, −z + 1/2; (#7) −x + 2, y, −z + 1/2; (#8) x − 1, y, z; (#9) x − 1/2, y − 1/2, z; (#10) x + 1/2, y − 1/2, z; (#11) −x + 3/2, y + 1/2, −z + 1/2; (#12) x − 1/2, y + 1/2, z; (#13) −x + 1/2, y + 1/2, −z + 1/2; (#14) x + 1/2, y + 1/2, z. |
| Y(1)–O(4)#2 |
2.351(6) |
Ba(1)–O(2)#12 |
2.694(6) |
| Y(1)–O(6) |
2.372(6) |
Ba(1)–O(5)#13 |
2.875(6) |
| Y(1)–O(8)#3 |
2.377(6) |
Ba(1)–O(5)#14 |
2.875(6) |
| Y(1)–O(4) |
2.394(6) |
Ba(1)–O(3) |
2.963(6) |
| Y(1)–O(7)#4 |
2.437(6) |
Ba(1)–O(3)#6 |
2.963(6) |
| Y(1)–O(7)#5 |
2.466(6) |
Ba(1)–O(8)#12 |
3.078(6) |
| Y(1)–O(6)#1 |
2.489(6) |
Ba(1)–O(8)#11 |
3.078(6) |
| Li(2)–O(5) |
2.03(2) |
Mo(1)–O(2) |
1.734(6) |
| Li(2)–O(5)#6 |
2.03(2) |
Mo(1)–O(1) |
1.756(6) |
| Li(2)–O(1)#7 |
2.16(2) |
Mo(1)–O(3) |
1.773(6) |
| Li(2)–O(1)#8 |
2.16(2) |
Mo(1)–O(4) |
1.811(6) |
| Li(2)–O(2) |
2.381(9) |
Mo(2)–O(5) |
1.742(6) |
| Li(2)–O(2)#6 |
2.381(9) |
Mo(2)–O(8) |
1.770(6) |
| Ba(1)–O(1)#8 |
2.654(6) |
Mo(2)–O(7) |
1.792(6) |
| Ba(1)–O(1)#7 |
2.654(6) |
Mo(2)–O(6) |
1.815(6) |
The concentration of Tm3+ ions in the grown crystal was measured to be 1.83at% (8.72 × 1019 cm−3) by the inductively coupled plasma atomic emission spectroscopy (ICP-AES) technique. The absorption spectra in a range of 300–2000 nm were measured using a Perkin-Elmer UV-VIS-NIR spectrometer (Lambda-900) with polarization of incident light parallel to the X, Y and Z axes. The polarized emission spectra and the fluorescence decay curves were recorded using an Edinburgh Instruments FL920 spectrophotometer. All the measurements were carried out at room temperature.
3. Results and discussion
3.1 Crystal appearance and structure
The as-grown Tm3+:Li3Ba2Y3(MoO4)8 crystal with a square cross section shape and well-developed faces is shown in Fig. 1 (a). The initial dimension of the grown crystal is 10 × 8 × 45 mm3 along a, b, and c-direction, respectively. However, because of the cleavable nature of the crystal, the grown crystal has split in the middle during the annealing process. As a result, only part of the grown crystal is shown in Fig. 1 (a). Fig. 1 (b) shows the morphological scheme of the Tm3+:Li3Ba2Y3(MoO4)8 crystal drawn using the Software WinXMorph. It can be found that both the appearance and structure of the Tm3+:Li3Ba2Y3(MoO4)8 crystal are consistent with those of Er3+:Li3Ba2Y3(MoO4)8 crystals reported in our previous paper.9
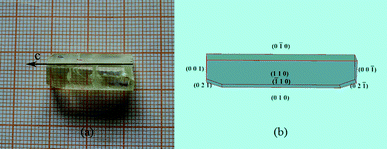 |
| | Fig. 1 Grown crystal and morphology of Tm3+:Li3Ba2Y3(MoO4)8. | |
The structure of Li3Ba2Y3(MoO4)8 crystal is illustrated in Fig. 2. The crystal crystallizes in the monoclinic system with the space group C2/c, and the unit cell parameters are: a = 5.2052(6), b = 12.6763(17), c = 19.107(3), β = 91.293(12)°, V = 1260.4(3). The magnitude of the temperature factors and valence charge equilibrium after least-squares refinement have yielded an existence of a statistical distribution of Y and Li(1) atoms with the ratio of occupancy Y![[thin space (1/6-em)]](https://www.rsc.org/images/entities/char_2009.gif) :
:![[thin space (1/6-em)]](https://www.rsc.org/images/entities/char_2009.gif) Li(1) = 0.75
Li(1) = 0.75![[thin space (1/6-em)]](https://www.rsc.org/images/entities/char_2009.gif) :
:![[thin space (1/6-em)]](https://www.rsc.org/images/entities/char_2009.gif) 0.25. Each Y
0.25. Each Y![[thin space (1/6-em)]](https://www.rsc.org/images/entities/char_2009.gif) :
:![[thin space (1/6-em)]](https://www.rsc.org/images/entities/char_2009.gif) Li(1) atom is coordinated by eight O atoms to form a distorted Y
Li(1) atom is coordinated by eight O atoms to form a distorted Y![[thin space (1/6-em)]](https://www.rsc.org/images/entities/char_2009.gif) :
:![[thin space (1/6-em)]](https://www.rsc.org/images/entities/char_2009.gif) Li(1)O8 polyhedron. Adjacent Y
Li(1)O8 polyhedron. Adjacent Y![[thin space (1/6-em)]](https://www.rsc.org/images/entities/char_2009.gif) :
:![[thin space (1/6-em)]](https://www.rsc.org/images/entities/char_2009.gif) Li(1)O8 polyhedra are connected together through common edges to give a two-dimensional Y
Li(1)O8 polyhedra are connected together through common edges to give a two-dimensional Y![[thin space (1/6-em)]](https://www.rsc.org/images/entities/char_2009.gif) :
:![[thin space (1/6-em)]](https://www.rsc.org/images/entities/char_2009.gif) Li(1) layer composed of 6-rings. The Ba atom is coordinated by ten O atoms forming a distorted polyhedron with the Ba–O bond distances in the range of 2.654–2.963 Å, while the Li(2) is six-coordinated by O atoms to form a distorted octahedron with the Li(2)–O bond distances in the range of 2.03–2.381 Å The Mo(1) and Mo(2) atoms are best described in terms of their positions at centers of slightly distorted tetrahedra; the Mo(1) connects with O(1), O(2), O(3), and O(4) atoms with the bond distances ranging from 1.766(6) to 1.831(5); the Mo(2) connects with O(5), O(6), O(7), and O(8) atoms with the bond distances ranging from 1.751(5) to 1.828(6).
Li(1) layer composed of 6-rings. The Ba atom is coordinated by ten O atoms forming a distorted polyhedron with the Ba–O bond distances in the range of 2.654–2.963 Å, while the Li(2) is six-coordinated by O atoms to form a distorted octahedron with the Li(2)–O bond distances in the range of 2.03–2.381 Å The Mo(1) and Mo(2) atoms are best described in terms of their positions at centers of slightly distorted tetrahedra; the Mo(1) connects with O(1), O(2), O(3), and O(4) atoms with the bond distances ranging from 1.766(6) to 1.831(5); the Mo(2) connects with O(5), O(6), O(7), and O(8) atoms with the bond distances ranging from 1.751(5) to 1.828(6).
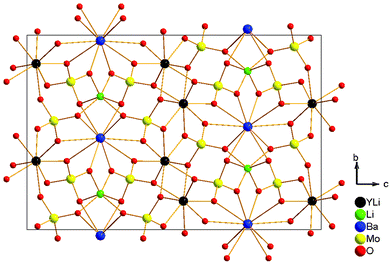 |
| | Fig. 2 View of the structural unit of the Li3Ba2Y3(MoO4)8 crystal. | |
The crystal structure can be viewed as being formed by Y-Mo layers perpendicular to the c-axis. As shown in Fig. 3 (a), the Y–LiO8 polyhedra are linked together though edge- and corner-sharing to give a two-dimensional Y layer parallel to the ab plane. The isolated MoO4 tetrahedra are then linked to both sides of each layer and form a new Y-Mo layer through common vertices. Finally, adjacent Y-Mo layers are held together though BaO10 and LiO6 polyhedra to construct a three-dimensional framework, as shown in Fig. 3 (b). Such a layered arrangement leads to perfect cleavage in the (0 0 1) plane as mentioned above.
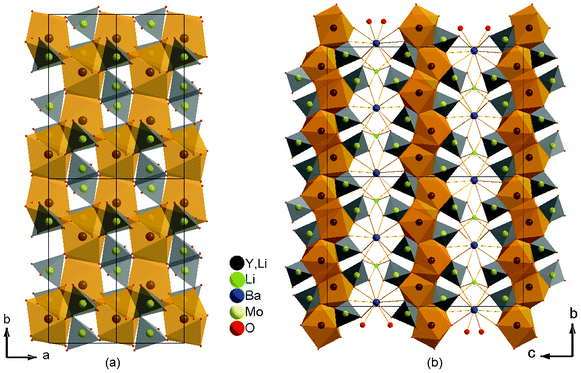 |
| | Fig. 3 Crystal structure of Li3Ba2Y3(MoO4)8: (a) view of the ab plane showing the layers constructed by Y–LiO8 polyhedrons and MoO4 tetrahedrons; (b) view of the bc plane showing the layered structure. | |
3.2 Thermal expansion coefficients
The thermal expansion of crystal is an important thermal factor for crystal growth and laser applications. As a significant part of the power pump is converted into heat inside the material during laser operation, it is important to know its linear thermal expansion coefficients to predict how the material behaves when the temperature increases. The figure of linear expansions versus temperature was shown in Fig. 4. The linear thermal expansion coefficient is defined as:| |  | (1) |
where L0 is the initial length of the sample at room temperature and ΔL is the change in length when the temperature changes ΔT. We can calculate the thermal expansion coefficient from the slope of the linear fitting of the linear relationship between ΔL/L0 and the temperature. In this case, the thermal expansion coefficients along a, b and c-axes are 1.63 × 10⁻⁵, 1.73 × 10⁻⁵ and 2.20 × 10⁻⁵ K−1, respectively. As we can see from Fig. 4, the thermal expansion coefficient along the c-direction is much higher than those along a- and b-directions, which is also responsible for the cleavable nature of the crystal and probably derives from the distinctive layered structure of the crystal. As is discussed in the previous section, the Y-Mo layers along the ab plane are composed of Y–LiO8 polyhedra and MoO4 tetrahedra. The MoO4 tetrahedron is generally considered to be a rigid unit because of the strong covalent Mo–O bonds, and it almost remains unchanged with temperature. The stable MoO4 tetrahedron, alternating with Y–LiO8 polyhedra along a and b-axes, may restrain the thermal expansion in these two directions. On the other hand, the BaO10 and LiO6 polyhedra linking adjacent Y-Mo layers along the c-direction are much more sensitive to temperature due to the large distance of Ba–O and Li–O bonds, and result in a large thermal expansion coefficient in this direction.
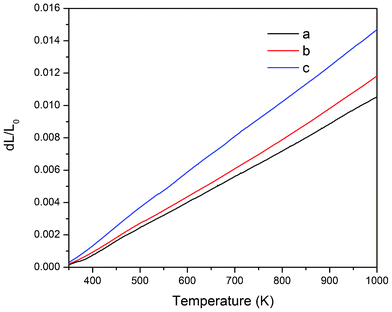 |
| | Fig. 4 Thermal expansions of Tm3+:Li3Ba2Y3(MoO4)8 crystal along the a-, b- and c-axes. | |
3.3 Spectral properties
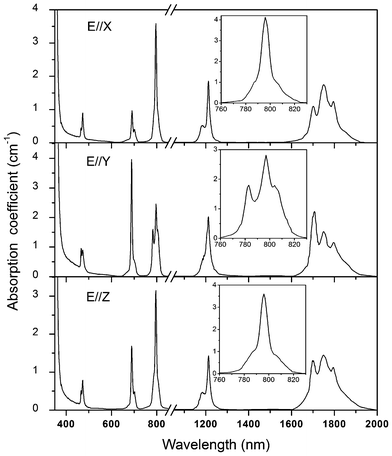
Fig. 5 shows the polarized absorption spectra of Tm3+:Li3Ba2Y3(MoO4)8 crystal measured at room temperature. For all polarizations, five absorption bands around 475, 690, 800, 1200 and 1750 nm can be observed, which belong to the transitions of Tm3+ ions from the ground state 3H6 to the excited states 1G4, 3F2,33H4, 3H5 and 3F4, respectively. The most attractive feature of the absorption spectra is the broad absorption bands around 800 nm, which coincide with the wavelength of radiation of the AlGaAs diode laser and are the main pumping channel for Tm3+ ions. The inset of Fig. 5 shows the absorption cross sections σabs of this band for clarity. For all polarizations, the peak absorption cross sections are located at 796 nm and the values are 4.12, 2.81 and 3.60 × 10⁻²⁰ cm2 for E∥X, E∥Y, and E∥Z, respectively. The full width at half the maximum (FWHM) of the ∼800 nm absorption band are 9, 18 and 8 nm for E∥X, E∥Y, and E∥Z respectively, which are comparable to those of other disordered molybdate crystals, such as Tm3+:LiGd(MoO4)2 (8 nm for σ polarization),4 Tm3+:NaGd(MoO4)2 (7 nm for σ polarization)2 and Tm3+:Ba2Gd4(MoO4)4 (7 nm for E∥X and 8 nm for E∥Y).3 Such a broad bandwidth indicates an inhomogeneous broadening behavior of the Tm3+:Li3Ba2Y3(MoO4)8 crystal and makes the crystal very suitable for diode pumping, since the thermal stabilization of pumping source is not so critical in this case. Furthermore, it can be found that both the profile and the intensity of the absorption bands of Tm3+:Li3Ba2Y3(MoO4)8 are very close to those of the isostructural Tm3+:Li3Ba2Lu3(MoO4)8 crystal.12
Fig. 6 (a) shows the polarized emission spectra of Tm3+:Li3Ba2Y3(MoO4)8 crystal in a range of 600–1600 nm when the samples were excited into the 1G4 state with 473 nm radiation. There are four main emission bands around 650, 800, 1175, and 1450 nm for each polarization. The emission bands around 650, 1175, and 1450 nm can be assigned to the 1G4 → 3F4, 1G4 → 3H4, and 3H4 → 3F4 transitions, respectively. The emission band around 800 nm may be the superposition of two resonant transitions, namely 1G4 → 3H5 and 3H4 → 3H6, with peaks at 785 and 800 nm, respectively. The emission bands of these two transitions were severely overlapped due to the very close barycentric wavelengths. To confirm the conclusion, the polarized emission spectra were also measured under 688 nm excitation, i.e., the Tm3+ ions were excited to the 3F2,3 states. In this case, the 3H4 state was populated through non-radiative relaxation from the 3F2,3 states and later on depopulated directly to the 3H6 ground state, giving rise to the emissions at 800 nm as shown in Fig. 6 (b). Then, it can be concluded that the weaker emission at 785 nm in Fig. 6 (a) belongs to the 1G4 → 3H5 transition.
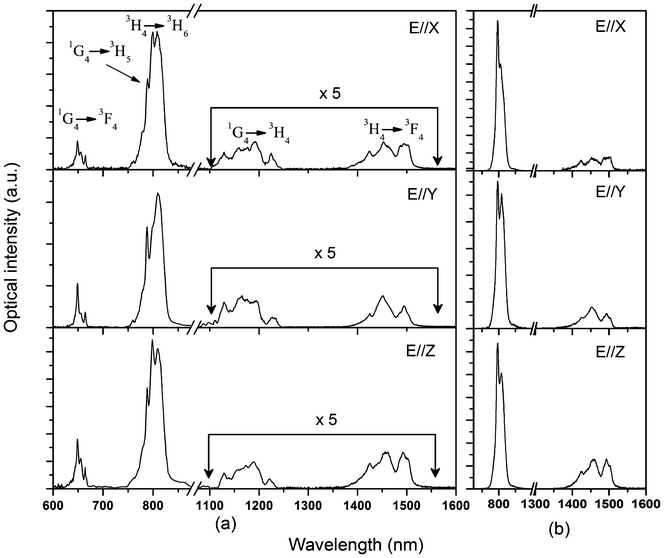 |
| | Fig. 6 Polarized fluorescence spectra of Tm3+:Li3Ba2Y3(MoO4)8 crystal: (a) excited with 473 nm radiation; (b) excited with 688 nm radiation. | |
Due to the restriction of the test conditions, the emission spectra of the 3F4 → 3H6 transition around 2 μm were not obtained. So, the emission cross sections σem of this transition were calculated from the absorption spectra according to the reciprocity method:13
| |  | (2) |
where
k is the Boltzmann’s constant,
Zl and
Zu are the partition functions of lower and upper states, respectively,
Ezl is the zero-line energy defined as the energy separation between the lowest Stark levels of the upper and lower multiplets. However, the precise energy level diagram of Tm
3+ ions in Li
3Ba
2Y
3(MoO
4)
8 crystal is not available now. Therefore the values of
Zl/
Zu and
Ezl were roughly taken as
Zl/
Zu = 1.42 and
Ezl = 5600 cm
−1 (0.694 eV) respectively, in agreement with those of the Tm
3+:Li
3Ba
2Lu
3(MoO
4)
8 crystal.
12 Then, the emission cross sections are obtained and listed in
Fig. 7 combining with the corresponding absorption cross sections. For all polarizations, the peak emission cross sections are located at 1800 nm and the values are 2.57, 2.38 and 2.19 × 10
−20 cm
2 for
E∥
X,
E∥
Y, and
E∥
Z, respectively. Similarly, we can find that the profile and the values of the emission cross sections of Tm
3+:Li
3Ba
2Y
3(MoO
4)
8 are very close to those of the isostructural Tm
3+:Li
3Ba
2Lu
3(MoO
4)
8 crystal.
12
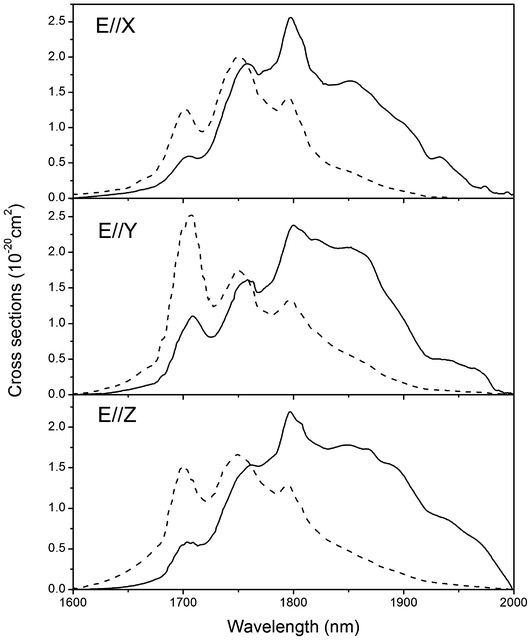 |
| | Fig. 7 Polarized absorption (dot line) and stimulated emission (solid line) cross sections of Tm3+:Li3Ba2Y3(MoO4)8 crystal for the 3F4 → 3H6 transition. | |
As we know, the 3F4 → 3H6 transition of Tm3+ operates in a quasi-three-level laser scheme and its efficiency critically depends on the population of the ground state. Therefore, the gain cross section was usually calculated to estimate the possible tuning range of laser output according to the following equation:
| | | σgain = βσabs − (1 − β)σem | (3) |
where
β represents the inversion population of Tm
3+ ions. The calculated gain cross section for different
β values is plotted in
Fig. 8 as a function of wavelength. It can be seen that, the population inversion rate needed to achieve application is higher than 0.1. For a population inversion level of 0.3, it is possible to obtain smooth tuning in a rather wide spectral region: 1.815–2.0 μm.
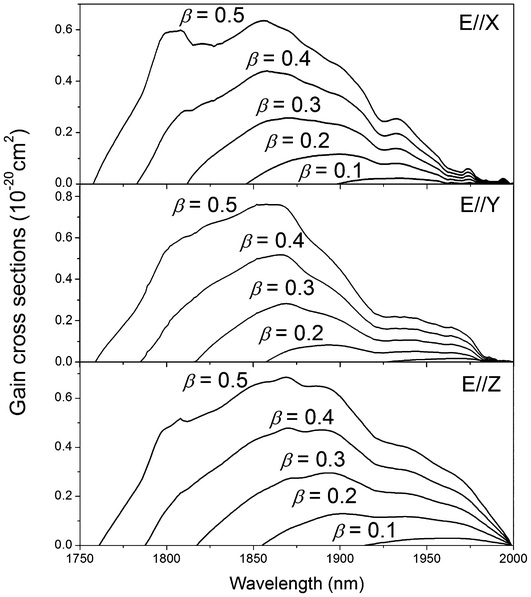 |
| | Fig. 8 Gain cross section of Tm3+:Li3Ba2Y3(MoO4)8 crystal for different values of inversion population β (β = 0.1, 0.2, 0.3, 0.4, 0.5). | |
4 Conclusions
Tm3+:Li3Ba2Y3(MoO4)8 crystals have been grown by the top seeded solution growth (TSSG) method from a flux of Li2MoO4 and its structure, thermal and spectral properties were investigated. The principal coefficients of thermal expansion along a, b and c-axes were precisely measured to be 1.63 × 10⁻⁵, 1.73 × 10⁻⁵ and 2.22 × 10⁻⁵ K−1, respectively. In addition, the large anisotropy of thermal expansion coefficients was discussed based on the structure of this crystal. The maximum absorption cross sections around 800 nm are 4.12, 2.81 and 3.60 × 10⁻²⁰ cm2 for E∥X, E∥/Y, and E∥Z respectively, while the maximum emission cross sections around 2 μm are 2.57, 2.38 and 2.19 × 10⁻²⁰ cm2 for E∥X, E∥Y, and E∥Z, respectively. On a whole, the main spectroscopic parameters of the Tm3+:Li3Ba2Y3(MoO4)8 crystal are close to those of the isostructural Tm3+:Li3Ba2Lu3(MoO4)8. So, in view of the excellent laser performance of Tm3+:Li3Ba2Lu3(MoO4)8 crystal, we may expect the Tm3+:Li3Ba2Y3(MoO4)8 crystal be a potential solid-state laser material.
Acknowledgements
This work was supported by the Natural Science Foundation of Shandong Province (ZR2010EQ007).
References
- X. M. Han, J. M. Cano-Torres, M. Rico, C. Cascales, C. Zaldo, X. Mateos, S. Rivier, U. Griebner and V. Petrov, J. Appl. Phys., 2008, 103, 083110 CrossRef.
- W. J. Guo, Y. J. Chen, Y. F. Lin, X. H. Gong, Z. D. Luo and Y. D. Huang, J. Phys. D: Appl. Phys., 2008, 41, 115409 CrossRef.
- H. M. Zhu, Y. J. Chen, Y. F. Lin, X. H. Gong, Z. D. Luo and Y. D. Huang, J. Opt. Soc. Am. B, 2008, 25, 801 CrossRef CAS.
- J. F. Tang, Y. J. Chen, Y. F. Lin, X. H. Gong, J. H. Huang, Z. D. Luo and Y. D. Huang, J. Opt. Soc. Am. B, 2010, 27, 1769 CrossRef CAS.
- L. H. Zheng, J. Xu, L. B. Su, H. J. Li, W. Ryba-Romanowski, R. Lisiecki and P. Solarz, Appl. Phys. Lett., 2010, 96, 121908 CrossRef.
- A. A. Lagatsky, S. Calvez, J. A. Gupta, V. E. Kisel, N. V. Kuleshov, C. T. A. Brown, M. D. Dawson and W. Sibbett, Opt. Express, 2011, 19, 9995 CrossRef CAS.
- M. J. Song, G. J. Wang, Z. B. Lin, L. Z. Zhang and G. F. Wang, J. Cryst. Growth, 2007, 308, 208 CrossRef CAS.
- M. J. Song, L. Z. Zhang and G. F. Wang, J. Alloys Compd., 2009, 478, 423 CrossRef CAS.
- M. J. Song, L. T. Wang, W. Zhao, G. F. Wang, M. L. Zhao and Q. G. Meng, Mater. Sci. Eng., B, 2011, 176, 810 CrossRef CAS.
- A. García-Cortés, C. Zaldo, C. Cascales, X. Mateos and V. Petrov, Opt. Express, 2007, 15, 18162 CrossRef.
- L. E. Batay, A. A. Demidovich, A. N. Kuzmin, G. I. Ryabtsev, W. Strek and A. N. Titov, Spectrochim. Acta, Part A, 1998, 54, 2117 CrossRef.
- M. Rico, X. M. Han, C. Cascales, F. Esteban-Betegón and C. Zaldo, Opt. Express, 2011, 19, 7640 CrossRef CAS.
- D. E. McCumber, Phys. Rev., 1964, 136, A954 CrossRef.
|
| This journal is © The Royal Society of Chemistry 2013 |
Click here to see how this site uses Cookies. View our privacy policy here. ![[thin space (1/6-em)]](https://www.rsc.org/images/entities/char_2009.gif) :
:![[thin space (1/6-em)]](https://www.rsc.org/images/entities/char_2009.gif) Li2MoO4 = 1
Li2MoO4 = 1![[thin space (1/6-em)]](https://www.rsc.org/images/entities/char_2009.gif) :
:![[thin space (1/6-em)]](https://www.rsc.org/images/entities/char_2009.gif) 5. A single-crystalline bar cut along the main crystallographic axis b was used as seed. The main and hardly soluble problem in growth of Li3Ba2Y3(MoO4)8 crystals appeared to be their cracking along the cleavage plane (0 0 1). Such a cracking has been observed also for the isostructural Li3Ba2Gd3(MoO4)8 crystals,10 and it is mainly caused by the layered structure and the large anisotropy of thermal expansion coefficients of the crystals. As a result, a small thermal gradient and a slow cooling rate after growth were adopted. Detailed growth and orientation procedures can be found in ref. 9.
5. A single-crystalline bar cut along the main crystallographic axis b was used as seed. The main and hardly soluble problem in growth of Li3Ba2Y3(MoO4)8 crystals appeared to be their cracking along the cleavage plane (0 0 1). Such a cracking has been observed also for the isostructural Li3Ba2Gd3(MoO4)8 crystals,10 and it is mainly caused by the layered structure and the large anisotropy of thermal expansion coefficients of the crystals. As a result, a small thermal gradient and a slow cooling rate after growth were adopted. Detailed growth and orientation procedures can be found in ref. 9.
![[thin space (1/6-em)]](https://www.rsc.org/images/entities/char_2009.gif) 023(2)
023(2)![[thin space (1/6-em)]](https://www.rsc.org/images/entities/char_2009.gif) 023(2)
023(2)![[thin space (1/6-em)]](https://www.rsc.org/images/entities/char_2009.gif) 279(11)
279(11)![[thin space (1/6-em)]](https://www.rsc.org/images/entities/char_2009.gif) 682(11)
682(11)
![[thin space (1/6-em)]](https://www.rsc.org/images/entities/char_2009.gif) :
:![[thin space (1/6-em)]](https://www.rsc.org/images/entities/char_2009.gif) Li(1) = 0.75
Li(1) = 0.75![[thin space (1/6-em)]](https://www.rsc.org/images/entities/char_2009.gif) :
:![[thin space (1/6-em)]](https://www.rsc.org/images/entities/char_2009.gif) 0.25. Each Y
0.25. Each Y![[thin space (1/6-em)]](https://www.rsc.org/images/entities/char_2009.gif) :
:![[thin space (1/6-em)]](https://www.rsc.org/images/entities/char_2009.gif) Li(1) atom is coordinated by eight O atoms to form a distorted Y
Li(1) atom is coordinated by eight O atoms to form a distorted Y![[thin space (1/6-em)]](https://www.rsc.org/images/entities/char_2009.gif) :
:![[thin space (1/6-em)]](https://www.rsc.org/images/entities/char_2009.gif) Li(1)O8 polyhedron. Adjacent Y
Li(1)O8 polyhedron. Adjacent Y![[thin space (1/6-em)]](https://www.rsc.org/images/entities/char_2009.gif) :
:![[thin space (1/6-em)]](https://www.rsc.org/images/entities/char_2009.gif) Li(1)O8 polyhedra are connected together through common edges to give a two-dimensional Y
Li(1)O8 polyhedra are connected together through common edges to give a two-dimensional Y![[thin space (1/6-em)]](https://www.rsc.org/images/entities/char_2009.gif) :
:![[thin space (1/6-em)]](https://www.rsc.org/images/entities/char_2009.gif) Li(1) layer composed of 6-rings. The Ba atom is coordinated by ten O atoms forming a distorted polyhedron with the Ba–O bond distances in the range of 2.654–2.963 Å, while the Li(2) is six-coordinated by O atoms to form a distorted octahedron with the Li(2)–O bond distances in the range of 2.03–2.381 Å The Mo(1) and Mo(2) atoms are best described in terms of their positions at centers of slightly distorted tetrahedra; the Mo(1) connects with O(1), O(2), O(3), and O(4) atoms with the bond distances ranging from 1.766(6) to 1.831(5); the Mo(2) connects with O(5), O(6), O(7), and O(8) atoms with the bond distances ranging from 1.751(5) to 1.828(6).
Li(1) layer composed of 6-rings. The Ba atom is coordinated by ten O atoms forming a distorted polyhedron with the Ba–O bond distances in the range of 2.654–2.963 Å, while the Li(2) is six-coordinated by O atoms to form a distorted octahedron with the Li(2)–O bond distances in the range of 2.03–2.381 Å The Mo(1) and Mo(2) atoms are best described in terms of their positions at centers of slightly distorted tetrahedra; the Mo(1) connects with O(1), O(2), O(3), and O(4) atoms with the bond distances ranging from 1.766(6) to 1.831(5); the Mo(2) connects with O(5), O(6), O(7), and O(8) atoms with the bond distances ranging from 1.751(5) to 1.828(6).


