Chiral and chemical oscillations in a simple dimerization model
Michael
Stich
*,
Celia
Blanco
and
David
Hochberg
Centro de Astrobiología (CSIC-INTA), Ctra de Ajalvir km 4, 28850 Torrejón de Ardoz (Madrid), Spain. E-mail: stich@cab.inta-csic.es; Fax: +34 91 520-1074; Tel: +34 91 520-6409
First published on 19th September 2012
Abstract
We consider the APED model (activation-polymerization–epimerization-depolymerization) for describing the emergence of chiral solutions within a non-catalytic framework for chiral polymerization. The minimal APED model for dimerization can lead to the spontaneous appearance of chiral oscillations and we describe in detail the nature of these oscillations in the enantiomeric excess, which are the consequence of oscillations of the concentrations of the associated chemical species.
1 Introduction
Chemical oscillations are a paradigmatic example of temporal self-organization in non-equilibrium systems and have been at the center of intense experimental and theoretical research for decades,1–3 with theoretical work going back at least to the time of Lotka.4 At the heart of these spontaneous oscillations are a positive feedback loop, often an autocatalytic step, and a negative control loop, responsible for the saturation of the growth process and which operates often on a slower time scale.The mathematical description of chemical oscillations usually relies on ordinary differential equations readily derived from the chemical rate laws. The number of reacting species determines the number of variables. Chemical reaction kinetics imply that the differential equations are nonlinear. The number, nature, and stability of the solutions of the system are studied through standard methods including dynamical systems theory and bifurcation theory, among others.5,6 One simple possibility to obtain stable oscillations is the Hopf bifurcation scenario, discussed in more detail below.
Instabilities observed in chemical systems are nowadays well-established in theory and experiment, and in the tradition of the famous Belousov–Zhabotinsky reaction,7 most experiments refer to chemical reactions in solution. Nevertheless, surface chemical reactions and an increasing number of biochemical reactions have also been studied extensively.8,9
In this article, we study a model purporting to describe general chiral polymerization processes in a prebiotically relevant chemical system, devised for explaining the appearance of homochirality.10 Although there are many different theoretical (and experimental) models tackling the open question of the origin of biological homochirality, i.e., the preference of living matter for only one of the two chiral states of an otherwise chemically identical molecule, at the heart of many of these approaches lies a mechanism responsible for spontaneous mirror symmetry breaking. The initially small chiral fluctuation must then be amplified to a state that is useful for biotic evolution. A precondition for this to happen is that the chirality must be preserved and transmitted to the rest of the system.
In this context, the implications of chiral oscillations for chirality transmission are far-reaching: indeed, the memory of the sign of the initial primordial chiral fluctuation is erased and diluted as it were by whatever subsequent oscillations that are present in the enantiomeric excess. This phenomenon, if and when it occurs in any model purporting to have relevance to prebiotic chemistry, adds a further element of uncertainty and stochasticity to the determination of the sign of the chirality that is finally transmitted to the system (say, within a closed reacting system with necessarily damped chiral oscillations). Recently in fact, numerical evidence for such damped oscillations was found in a chiral polymerization model closed to matter and energy flow, where the amplitude of the oscillation depends on the length of the homochiral chain formed.11 While such models are successful in fitting to real chemical data on, e.g., relative abundances of chiral polymers,12 they usually involve dozens or even hundreds of nonlinear coupled differential equations, and they do not lend themselves easily to a systematic controlled mathematical analysis of the kind needed to study rigorously oscillatory phenomena in detail.
For this essentially technical reason, a detailed study of chiral oscillatory phenomena is best carried out in a simple model, ideally not too far removed, if possible, in spirit from a more complex “real” model. Linear stability analysis proves that there is no possibility for oscillations in the original Frank model, nor within any of its minimal extensions.13 On the other hand, the model proposed by Plasson et al.10 is amenable to theoretical analysis, and it exhibits different stable stationary states, together with instabilities and even temporal oscillations. These oscillations refer not only to the concentrations of the different species, and therefore represent chemical oscillations, but also to oscillations in the enantiomeric excess of the system. These chiral oscillations are the focus of this article.
This article is organized as follows: in Section 2 we introduce the minimal APED model and perform a basic bifurcation analysis. In Section 3, we discuss in more detail the basic bifurcations observed in the model and display bifurcation diagrams for other parameters. One of the interesting results is that chiral oscillations can be expected for parameter values that are chemically more realistic, at least within simple models based on Frank's scheme, when these are proposed as the fundamental candidate reaction network for explaining the salient features of the Soai reaction.14 Finally, we close the article with a discussion of the results in Section 4.
2 The APED model
We consider the so-called APED (activation–polymerization–epimerization–depolymerization) model, introduced by Plasson et al.,10 used to describe the spontaneous onset of homochiral states in a symmetric system of interacting polymerization products. The reaction scheme for the minimal APED dimerization model is represented by the following chemical transformations: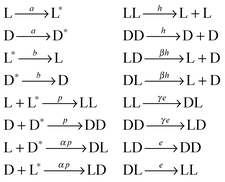 | (1) |
The chemical reactions transcribe into the following set of ordinary differential equations:
[![[L with combining dot above]](https://www.rsc.org/images/entities/char_004c_0307.gif) ] = −a[L] − p[L][L*] − αp[L][D*] + 2h[LL] + b[L*] + βh[DL] + βh[LD] ] = −a[L] − p[L][L*] − αp[L][D*] + 2h[LL] + b[L*] + βh[DL] + βh[LD] | (2) |
| [Ḋ] = −a[D] − p[D][D*] − αp[D][L*] + 2h[DD] + b[D*] + βh[DL] + βh[LD] | (3) |
 | (4) |
 | (5) |
 | (6) |
 | (7) |
 | (8) |
| [LD] = (c − [L] − [D] − [L*] − [D*] − 2[LL]− 2[DD] − 2[DL])/2 | (9) |
It is straightforward to search for different stable states within the system. Following the analysis published in ref. 10, we present in Fig. 1a the bifurcation diagram obtained with MatCont15 for the α − c space. The different behaviors of the system depend on the total concentration c and the relative strength of the hetero- vs. homo-dimerization, α. We start our analysis at the point c = 1, α = 10 (other parameters are a = h = e = p = 1 and b = β = γ = 0), where we find a stable racemic state (vanishing enantiomeric excess) characterized by constant and nonvanishing values for all variables (but with [D] = [L], [DD] = [LL] etc.). We keep a = 1, b = 0 for the remainder of this article.
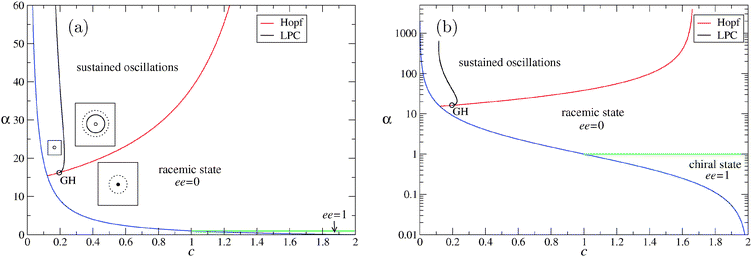 | ||
| Fig. 1 Bifurcation analysis of the APED model in the α − c space for the parameter values a = h = e = p = 1 and b = β = γ = 0. The GH point (open circle) is located at GH = (0.19559, 16.23713). Stable oscillations of the variables (and enantiomeric excess) are found in the region between the supercritical Hopf curve and the LPC (for: Limit Point bifurcation of Cycles) curve. In (a), α is shown on a linear scale from 0 to 60 and the insets qualitatively display the main solutions: open (filled) circle for the unstable (stable) fixed point, i.e., racemic state, and solid (dashed) curves for the stable (unstable) limit cycle, i.e., oscillations. (b) Same curves shown on a logarithmic scale for α, for comparison with Fig. 3 of ref. 10. Note that oscillations cannot be found for any α if c becomes sufficiently large. For more information see text. | ||
If we decrease the total matter in the system (lowering c), the system crosses the blue curve and the only stable state is the “dead state”, characterized by vanishing concentrations for all species except for the activated species L* and D*. This curve is given by the equation c = 2a/(p + pα), see ref. 10. If we decrease α while c > 1, the system undergoes a pitchfork bifurcation at α = 1, at which the racemic state becomes unstable and stable chiral states appear. These chiral states were the focus of the article,10 and therefore we do not discuss them in detail here.
As we increase α for fixed c (which is allowed to have values as small as c ≈ 0.2), we observe the onset of oscillations as the racemic stationary state becomes unstable through a supercritical Hopf bifurcation (red curve). This means that close to the bifurcation, oscillations have small amplitude and finite frequency. These oscillations are exemplified in Fig. 2 for α = 40, c = 1, i.e., already at some distance from the Hopf point located at α = αH = 38.24. All concentrations oscillate (with a period T = 6.52355), with the chiral species oscillating in antiphase, and the enantiomeric excess oscillates with the same period. The range where stable chiral oscillations are observed does not extend to the hyperbola limiting the dead state. As c is decreased for a fixed α, the stable limit cycle undergoes a saddle-node bifurcation of limit cycles (black curve, denoted as LPC, for: Limit Point bifurcation of Cycles). This means that the stable limit cycle collides with an unstable one and both disappear (and hence no limit cycles are present to the left of the black curve). The fixed point describing the racemic state remains unstable in that parameter region and numerical simulations (not shown here) indicate that the system dynamics is governed by irregular oscillations that do not saturate and finally lead to negative values for the concentrations, hence not representing any realistic chemical state.
![Stable oscillations of the concentrations and the enantiomeric excess ee observed in the APED model for the parameter values a = h = e = p = c = 1, b = β = γ = 0, and α = 40. All concentrations oscillate, for simplicity we just display [L] and [D], and have omitted the initial transient. Note that [L] and [D] oscillate out of phase.](/image/article/2013/CP/c2cp42620j/c2cp42620j-f2.gif) | ||
| Fig. 2 Stable oscillations of the concentrations and the enantiomeric excess ee observed in the APED model for the parameter values a = h = e = p = c = 1, b = β = γ = 0, and α = 40. All concentrations oscillate, for simplicity we just display [L] and [D], and have omitted the initial transient. Note that [L] and [D] oscillate out of phase. | ||
The curve of the supercritical Hopf bifurcation and the curve of saddle-node bifurcation of limit cycles meet at a Generalized Hopf (GH) point at GH = (0.19559, 16.23713). This implies that the supercritical Hopf bifurcation converts into a subcritical one. Hence, the red curve between the GH point and the point where the Hopf bifurcation meets the hyperbola c = 2/(1 + α) represents a subcritical Hopf bifurcation where the unstable fixed point (above the curve) becomes stable (below the curve), representing the stable racemic state, while at the same time an unstable limit cycle appears. This unstable limit cycle is the one which disappears at the LPC curve. The insets of Fig. 1(a) show qualitatively the stationary racemic state and the limit cycles as one moves around the GH point in the α − c parameter space. In the parameter regime where stable chiral oscillations are observed, another, unstable, limit cycle is present. For this parameter set, the minimal α-value for oscillations is given by αc = 16.237.
In Fig. 1(b), we show the same bifurcation diagram in a log-linear plot. Contrary to what was displayed in Fig. 3 of ref. 10, the Hopf curve bends upward for c → 2, demonstrating that the oscillations are not possible if the total amount of residues is large. Therefore, the region for c for which stable oscillations are found is bound from below and above.
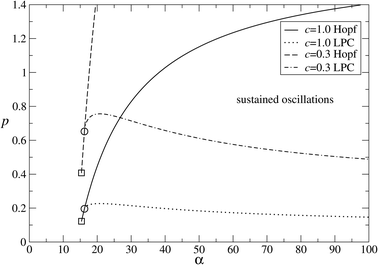 | ||
| Fig. 3 Bifurcation analysis in p − α space for the parameter values c = 1 and c = 0.3. The area with sustained oscillations is found to the right of the Hopf curves and above the LPC curves, respectively. The GH and the intersection with c = 2a/(p + pα) (appearance of the dead state) are denoted by open circles and squares, respectively. For c = 1: GH = (16.23713, 0.19559), intersection at (15.36557, 0.12221). For c = 0.3: GH = (16.23713, 0.65197), intersection at (15.36451, 0.40739). Other parameters are a = h = e = 1 and b = β = γ = 0. | ||
3 Bifurcation analysis
The bifurcation analysis carried out in Section 2 shows that for the parameter values a = h = e = p = 1 and b = β = γ = 0, stable oscillations are only to be found for α > αc = 16.237. Here, we consider other (obviously not all) regions of the overall 9-parameter space (we always keep a = 1, b = 0) to check how general is the appearance of chiral oscillations. Since we focus on the oscillations, we do not show a complete bifurcation diagram.In Fig. 3 we investigate for two different total concentrations c = 1 and c = 0.3, the region of stable oscillations in the p − α space. We hence probe at the same time the absolute influence of the polymerization rate (p) and the relative influence of its stereoselectivity (α). The region of stable oscillations is again limited by a Hopf curve and an LPC curve. The two curves are qualitatively similar for both values of c, so we restrict the description to the case c = 1. If we choose, e.g., p = 1, and increase α, the system undergoes a supercritical Hopf bifurcation at αH = 38.24 as already seen above. Hence, to the right of the Hopf curve, the region of stable oscillations is found, which is limited from below by the LPC curve. This means that if p takes smaller values, smaller α are necessary to induce oscillations, although there is a minimum value for p, below which no oscillations can be found, here, p ≈ 0.2, independently of α. The LPC and Hopf curves merge at the GH point, giving again a minimum value for α = αc, below which no oscillations are observed. For smaller c, larger p has to be chosen to obtain stable oscillations.
To measure how the stereoselectivity of polymerization and depolymerization influence the appearance of oscillations, we perform a bifurcation analysis in the β − α space (Fig. 4(a)). Since c = 1 and other parameters are also as in Fig. 1, for β = 0, stable oscillations are found for α > αH (at least for α < 1500). If 0 < β < 0.020445, i.e., for only weak heterochiral depolymerization, the range of α that allows for stable oscillations shrinks, with a lower bound that increases and an upper bound that decreases. If β > 0.020445, there is no value of α that admits stable oscillations. At the same time, from the figure we deduce that the range of allowed values of β is maximal for α = 102.3. Also in this parameter space, we observe a Generalized Hopf point at GH = (358.033236, 0.011450). To the left of that point, the Hopf bifurcation is supercritial, to the right it is subcritical. There is an LPC curve emerging at the GH point that in this scenario lies above the subcritical Hopf curve. This implies that the local bifurcation scenario is slightly different to the one displayed in Fig. 1. The insets show the main solutions. In particular, we have a stable fixed point coinciding with a stable limit cycle between the subcritical Hopf curve and the LPC curve. This represents a bistability of oscillations with a stationary state. However, this scenario is not complete. As we know from Fig. 1, for β = 0 and α > αH, there exists also another unstable limit cycle that, however, does not undergo any bifurcation in this parameter range (and hence is not added to the insets).
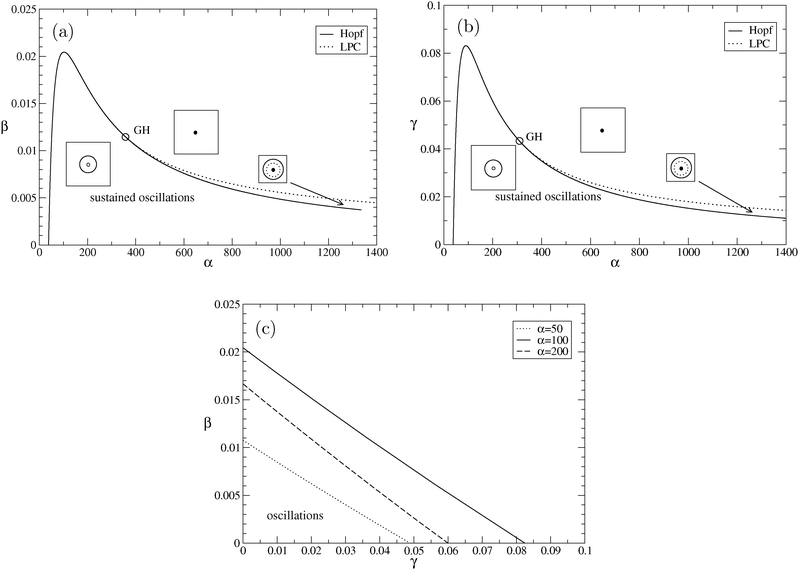 | ||
| Fig. 4 (a) Bifurcation analysis in β − α space. The area with sustained oscillations is found below the supercritical Hopf curve (to the left of GH) and below the LPC curve (to the right of GH). The insets qualitatively display the main solutions: filled (open) circle for the stable (unstable) fixed point, i.e., racemic state, and solid (dashed) curves for the stable (unstable) limit cycle, i.e., oscillations. Note that the bifurcation scenario is slightly different than in Fig. 1, giving rise to a thin parameter region where bistability among the stable fixed point and the stable limit cycle exists. The GH point is located at GH = (358.033236, 0.011450), other parameters are a = c = h = p = e = 1 and b = γ = 0. (b) Bifurcation analysis in γ − α space. The area with sustained oscillations is found below the supercritical Hopf curve (to the left of GH) and below the LPC curve (to the right of GH). The insets qualitatively display the main solutions: filled (open) circle for the stable (unstable) fixed point, and solid (dashed) curves for the stable (unstable) limit cycle. The GH point is located at GH = (309.5748, 0.043262), β = 0, and other parameters are as in (a). (c) Bifurcation analysis in β − γ space. We show three supercritical Hopf curves (α = 50, 100, 200). The area with sustained oscillations is found below the corresponding curve. Other parameters are as in (a). | ||
To check the relative impact of the stereoselectivity of polymerization and epimerization, in Fig. 4(b), we explore the region of stable oscillations in the γ − α space. Again, the other parameters are as in Fig. 1, implying that for γ = 0, stable oscillations are found for α > αH = 38.24. The functional form of the Hopf and LPC curves and the location of GH point are qualitatively similar to the scenario in the β − α space. Therefore, if 0 < γ < 0.083136, i.e., for only weak heterochiral epimerization, the range of α that allows for stable oscillations shrinks, with a lower bound that increases and an upper bound that decreases. If γ > 0.083136, there is no value of α that admits stable oscillations. At the same time, from the figure we deduce that the range of allowed values of γ is maximal for α = 90.05.
To complete the view on relative impact of heterochiral polymerization, depolymerization, and epimerization on oscillations, in Fig. 4(c), we explore the β − γ space for fixed α. As can be already inferred from the above figures, there is a minimum value for α = αH = 38.24, below which no combination of (γ,β) yields stable oscillations. However, if α > αH, small values of γ and β are allowed. As we increase α, this area first increases and decreases later, once the relative maxima of the β − α and γ − α curves are passed.
In an analogous way as our study of p and α, we can compare the influence of the depolymerization rate h vs. its stereoselectivity β (Fig. 5(a)). We choose α = 50 that for β = 0 and h = 1 (and other parameters as above) corresponds to stable oscillations. We find that while for h = 1 the allowed interval of β is small, we see that if we decrease h, the range of β values giving rise to oscillations becomes larger. This means that the depolymerization process needs not to be very inefficient for heterochirals in order to produce oscillations. There exists an optimal value h ≈ 0.2 where the favorable β range becomes largest. Nevertheless, there is a minimum value h = 0.0931 below which no stable limit cycles are found.
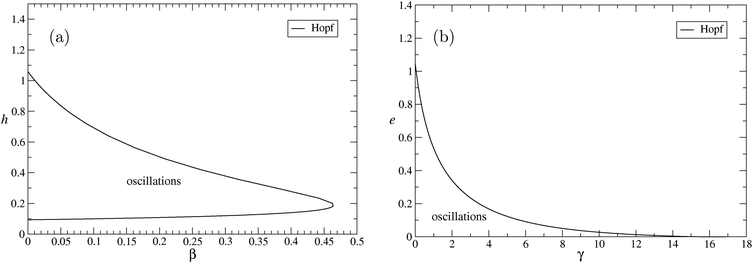 | ||
| Fig. 5 (a) Bifurcation analysis in h − β space. We show a supercritical Hopf curve for the parameters α = 50, a = c = p = e = 1, and b = γ = 0. The area with sustained oscillations is found to the left of the curve. (b) Bifurcation analysis in e − γ space. We show a supercritical Hopf curve for α = 50, a = c = p = h = 1, and b = β = 0. The area with sustained oscillations is found below the curve. | ||
Similarly, we study in Fig. 5(b) the influence of the γ. Interestingly, we do not observe a minimal threshold for e as for h. To the contrary, we find that for e → 0, the range of allowed values of γ becomes maximal, and reaches values close to 14. However, we should have in mind that if e = 0, the value of γ becomes irrelevant since γe = 0. Furthermore, since for e = 0 the Jacobian matrix becomes singular, a more detailed analysis should be performed to investigate the bifurcation scenario in that limit. We remark that stable oscillations are also possible for γ = 1, i.e., the absence of any stereoselectivity.
To complete our study, we revisit the β − α space, but with a parameter set for which γ = 1 (Fig. 6). The motivation is to find stable oscillations in the absence of any stereoselective depolymerization and epimerization. We choose c = 1, e = 0.1, and p = 0.3, and consider three values for h. We see that the region of oscillations increases for smaller h, and in particular, for h = 0.1 and β = 1, we have a critical value for α = 321.447 above which a stable limit cycle is found. This is just an example to demonstrate that β ≪ 1 and γ ≪ 1 are not necessary conditions for the presence of sustained oscillations.
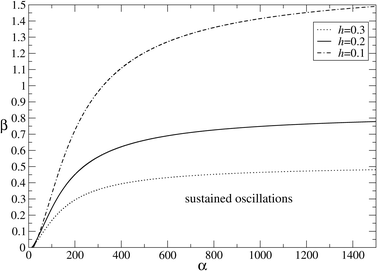 | ||
| Fig. 6 Bifurcation analysis in β − α space. We show three supercritical Hopf curves (h = 0.3,0.2,0.1). The area with sustained oscillations is found below the corresponding curve. Other parameters are a = c = γ = 1, e = 0.1, p = 0.3, and b = 0. | ||
4 Conclusions
In this paper, we have studied a simple polymerization model (actually, dimerization), aimed originally to explain the emergence of chiral states, in the context of the onset of chiral oscillations. These oscillations represent temporal changes in the enantiomeric excess of the underlying system, i.e., the continuous change of a state, where one of the chiral states momentarily dominates, into a subsequent state where the opposite handed state is more abundant.During decades, models for explaining the emergence and amplification homochirality have been focused on the creation of stable stationary states, typically associated with chiral states of maximum enantiomeric excess. The description of temporally oscillatory states in these models and the discussion of what these chiral oscillations mean are rare. Chiral oscillatory states have been reported by Iwamoto in two different systems motivated by traditional models for chemical oscillations16,17 and shortly after for the APED model10 studied here. Nevertheless, chiral oscillations were not studied in detail in the latter paper, and no explanation was given nor relevance is attributed to this effect. Here, we have studied in detail the onset of chiral oscillations, and have demonstrated that they are associated with temporal oscillations of the underlying chemical species, i.e., chemical oscillations. Mathematically speaking, the onset of oscillations is described by a supercritical Hopf bifurcation scenario, implying that oscillations have small amplitude and finite frequency (opposed to other mechanisms where oscillations arise with finite amplitude and vanishing frequency). The Hopf bifurcation is of codimension-1, and oscillations are found in large parameter regions and hence represent a generic solution of the system.
While it has been suggested10 that the reason for observing chiral oscillations is that heterochiral polymerization is favoured over homochiral polymerization, we test this hypothesis and clarify in more detail what are the conditions that enable the stabilization of chiral oscillations within the framework of the rather general APED model. We show continuation results by varying α, β, γ, p, h, e, and c (keeping a = 1, b = 0), demonstrating that oscillations are in fact a typical solution of the model. In particular, for the α − β − γ space, we measure the impact of hetero- vs. homochiral polymerization, hydrolysis, and epimerization, and find that α ≫ 1, β < 1, and γ < 1 are favorable, in particular α > 38.24 for β = 0, and γ = 0, where c = 1 is the total mass of the system and other parameters are also equal to unity. This means that oscillations are favored for heterochiral polymerization and homochiral de-polymerization and epimerization. This is a noteworthy result, especially in light of recent analysis of ref. 14 using the Frank scheme to model the Soai reaction, which argued that an ideal system for kinetically controlled spontaneous mirror symmetry breaking should consist of a fast exergonic mutual inhibition step leading to the formation of the heterodimer LD (i.e., α ≫ 1) and which must be more exergonic that the possible homodimerization leading to LL and DD. The latter condition translates into the constraint α ≫ β in terms of the APED model. In all cases observed, the oscillations arise from an achiral state. Oscillations are not occurring for any amount of total mass in the system. We observe that there is a lower bound (even before the racemic solution reaches the dead state) and also an upper bound.
We show stable sustained oscillations for a wide range of parameter sets. In particular, β and γ can also be chosen to unity, i.e., depolymerization and epimerization need not be stereoselective in order to produce oscillations, although heterodimers must be polymerized preferentially. Recent experimental results demonstrate the stereoselectivity of polymerization reactions and show in detail that the stereoselectivities can be modified experimentally (e.g., by pH) in magnitude and can be found to be both larger or smaller than unity.18,19
The presence of oscillations of chirality adds a further element of uncertainty to the determination of the sign of the chirality that is finally transmitted to the system (say, within a closed reacting system with necessarily damped chiral oscillations). In some parameter regions, even bistability of oscillations with the racemic state are observed, implying that then it is a matter of the initial condition which state is realized.
Until recently, chiral oscillations have not been reported in experiments, and hence the possibility for studying their onset in theoretical models has received sparse attention. However, there is now growing interest in oscillatory phenomena close to the onset of chirality, as chiral oscillations have been reported in different experimental systems consisting of carboxylic acids (profens, amino acids, hydroxy acids).20,21 There, several theoretical models are presented and checked whether they can account for the experimental observations. Among them, the APED model studied here is the only one that was already known to display chiral oscillations, while the other ones22–24 had to be modified or reinterpreted in order to account for chiral, rather than just mere chemical oscillations. Here, we do not aim to discuss any of those models with regard to the experiments (the reader is referred to ref. 20 and 21 directly).
For the Soai reaction, Buhse presented a simplified model25 that was later modified to investigate temporal oscillations in continuous flow and semibatch conditions.26 While there are stable oscillations of the reactants in a continuous flow scenario, they are apparently not associated with oscillations in the enantiomeric excess. This means that chemical oscillations are not related to chiral oscillations, as they are in the APED model. On the other hand, in the case of a semibatch system, oscillations necessarily fade out and give rise to a chiral state, but transient oscillations in the enantiomeric excess can be observed.
Acknowledgements
M.S. acknowledges financial support from MICINN (currently MINECO) through project FIS2011-27569 and from the Comunidad Autónoma de Madrid, project MODELICO (S2009/ESP-1691) and acknowledges very useful help from W. Govaerts and V. De Witte using MatCont and useful discussions with R. Plasson. The research of C.B. and D.H. is supported by the Grant AYA2009-13920-C02-01 from MICINN (currently MINECO) and C.B. has a Calvo-Rodés predoctoral contract from INTA.References
- Y. Kuramoto, Chemical Oscillations, Waves, and Turbulence, Springer, Berlin, 1984 Search PubMed.
- S. K. Scott, Oscillations, Waves, and Chaos in Chemical Kinetics, Oxford University Press, Oxford, 1994 Search PubMed.
- Chemical Waves and Patterns, ed. R. Kapral and K. Showalter, Kluwer Academic, Dordrecht, 1995 Search PubMed.
- A. J. Lotka, J. Phys. Chem., 1910, 14, 271–274 CrossRef CAS.
- J. Guckenheimer and P. J. Holmes, Nonlinear Oscillations, Dynamical Systems and Bifurcations of Vector Fields, Springer, New York, 1983 Search PubMed.
- Yu. A. Kuznetsov, Elements of Applied Bifurcation Theory, Springer, New York, 1995 Search PubMed.
- A. N. Zaikin and A. M. Zhabotinsky, Nature (London), 1970, 255, 535–537 CrossRef.
- J. D. Murray, Mathematical Biology, Springer, Berlin, 1989 Search PubMed.
- D. Walgraef, Spatio-Temporal Pattern Formation, Springer, New York, 1997 Search PubMed.
- R. Plasson, H. Bersini and A. Commeyras, Proc. Natl. Acad. Sci. U. S. A., 2004, 101, 16733–16738 CrossRef CAS.
- C. Blanco and D. Hochberg, Phys. Chem. Chem. Phys., 2011, 13, 839–849 RSC.
- C. Blanco and D. Hochberg, Phys. Chem. Chem. Phys., 2012, 14, 2301–2311 RSC.
- J. M. Ribó and D. Hochberg, Phys. Lett. A, 2008, 373, 111–122 CrossRef.
- J. Crusats, D. Hochberg, A. Moyano and J. M. Ribó, ChemPhysChem, 2009, 10, 2123–2131 CrossRef CAS.
- A. Dhooge, W. Govaerts and Yu. A. Kuznetsov, ACM Trans. Math. Softw., 2003, 29, 141–164 CrossRef.
- K. Iwamoto, Phys. Chem. Chem. Phys., 2002, 4, 3975–3979 RSC.
- K. Iwamoto, Phys. Chem. Chem. Phys., 2003, 5, 3616–3621 RSC.
- G. Danger, R. Plasson and R. Pascal, Astrobiology, 2010, 10, 651–662 CrossRef CAS.
- R. Plasson, M. Tsuji, M. Kamata and K. Asakura, Origins Life Evol. Biospheres, 2011, 41, 413–435 CrossRef CAS.
- M. Sajewicz, M. Matlengiewicz, M. Leda, M. Gontarska, D. Kronenbach, T. Kowalska and I. R. Epstein, J. Phys. Org. Chem., 2010, 23, 1066–1073 CrossRef CAS.
- M. Sajewicz, M. Gontarska, D. Kronenbach, M. Leda, T. Kowalska and I. R. Epstein, J. Syst. Chem., 2010, 1, 7 CrossRef CAS.
- C. Hyver, J. Chem. Phys., 1985, 83, 850–851 CrossRef CAS.
- V. I. Bykov and A. N. Orban, Chem. Eng. Sci., 1987, 42, 1249–1251 CrossRef CAS.
- E. Peacock-López, D. B. Radov and C. S. Flesner, Biophys. Chem., 1997, 65, 171–178 CrossRef.
- T. Buhse, Tetrahedron: Asymmetry, 2003, 14, 1055–1061 CrossRef CAS.
- K. Micskei, G. Rabai, E. Gal, L. Caglioti and G. Palyi, J. Phys. Chem. B, 2008, 112, 9196–9200 CrossRef CAS.
| This journal is © the Owner Societies 2013 |
