Local structure and dynamics of benzene confined in the IRMOF-1 nanocavity as studied by molecular dynamics simulation†
Kohei
Takakura
a,
Takahiro
Ueda
*abc,
Keisuke
Miyakubo
ab and
Taro
Eguchi
ab
aDepartment of Chemistry, Graduate School of Science, Osaka University, Toyonaka, Osaka 560-0043, Japan
bThe Museum of Osaka University, Osaka University, Toyonaka, Osaka 560-0043, Japan. E-mail: ueda@museum.osaka-u.ac.jp; Fax: +81-6-6850-6720; Tel: +81-6-6850-5778
cDepartment of Applied Chemistry, Faculty of Science and Engineering, Toyo University, Kawagoe, Saitama 350-8585, Japan
First published on 31st October 2012
Abstract
The local structure and dynamic behaviour of a benzene molecular assembly confined within the nano-cavities of a zinc-based metal–organic framework, [Zn4O(CO2C6H4CO2)3]n (IRMOF-1), were investigated by means of molecular dynamics (MD) simulations. The local structure of the confined benzene molecules was evaluated using radial distribution functions. The sites for adsorption of benzene in IRMOF-1 were well defined by the simulation. The diffusion coefficients at ambient temperature suggested that the mobility of the confined benzene was high, comparable to the bulk fluid. Decreasing the temperature gave rise to the aggregation of benzene in the IRMOF-1 frameworks. Molecular aggregation was attributed to the localization of benzene in the large and the small cavities of IRMOF-1, respectively. Both the translational diffusion coefficient and the trajectory of benzene provided evidence that the localization of benzene in the large and the small cavities takes place at ca. 200 K. Furthermore, at high benzene loading, the migration of benzene in the small cavities was prevented (frozen) below 135 K. Thus, the translational degree of freedom of the benzene molecules changed drastically, depending on the temperature.
1. Introduction
Isoreticular metal–organic frameworks (IRMOFs) constitute a series of porous compounds with numerous regular and homogeneous pores,1 and have recently gained increasing interest owing to their high and tunable surface areas, which extend their applicability to a wide range of fields such as gas storage, separation, sensing media, catalysis, and so on.2 IRMOFs generally consist of metal oxide clusters linked with organic carboxylate linkers and are comprised of a porous structure with exceptionally high surface area. The pore size and functionality can be judiciously designed by substitution of the linker or by the addition of functional groups for various applications.3 In particular, IRMOFs are noteworthy materials for hydrogen storage; hydrogen is recognized as a clean fuel that can be used as an alternative to those derived from fossil fuels. IRMOFs have potential applicability to fuel cells, hydrogen vehicles, and so on. These compounds are imagined to be prospective candidates for the realization of an ecological society. Understanding of the fundamental properties of the guest molecules confined in IRMOFs is indispensable to the prospective and conventional applications of these molecules. In particular, an understanding of the physicochemical properties at the molecular level is an important imperative. Thus, herein, we present a detailed elucidation of the host–guest and guest–guest interactions in IRMOFs for the systematic design of frameworks appropriate for various applications.IRMOF-1: [Zn4O(BDC)3]n(BDC = benzene-1,4-dicarboxylate) represents the prototype in a series of these compounds, in which zinc oxide clusters (in the corners) and benzene-1,4-dicarboxylate moieties (as linkers) are connected to each other in three dimensions (Scheme 1).1 IRMOF-1 comprises a jungle-gym-like framework with cavities which provide a large free volume that is accessible to various guest molecules. 2H NMR studies revealed that the flip of the phenylene group in the BDC moiety is in the slow exchange regime. Of course, the occurrence of lattice vibrations of the framework plays an important role in the adsorption of the guest molecules,4 the diffusion,5,6 and the negative thermal expansion of the guest-free IRMOF-1.7,8 From the structural viewpoint, it is preferable to regard the framework of IRMOF-1 as static at room temperature.9,10 The orientation of the phenylene groups is frozen in the unit cell, and the cavities are then categorized into two types on the basis of pore size, depending on the orientation of the phenylene ring in the linker. Hereafter, these are referred to as large cavities and small cavities. These two kinds of cavities are alternately connected to each other by the open windows. Assuming that the free volume of each cavity is approximated by a sphere inscribed into the cube cavity, the diameters of the large and small cavities are 1.51 nm and 1.10 nm, respectively. IRMOF-1 crystallizes in the space group Fm![[3 with combining macron]](https://www.rsc.org/images/entities/char_0033_0304.gif) m, with a lattice constant of 25.8320(5) Å at 258(2) K.11 The homogeneous pore structure of IRMOF-1 gives rise to a regular, deep, and periodic potential for guest molecules, and can accommodate many kinds of guest molecules. The adsorption and diffusion properties of IRMOF-1 have been examined for several guest molecules on the basis of experimental12–15 as well as theoretical4–7,16–23 approaches so far.
m, with a lattice constant of 25.8320(5) Å at 258(2) K.11 The homogeneous pore structure of IRMOF-1 gives rise to a regular, deep, and periodic potential for guest molecules, and can accommodate many kinds of guest molecules. The adsorption and diffusion properties of IRMOF-1 have been examined for several guest molecules on the basis of experimental12–15 as well as theoretical4–7,16–23 approaches so far.
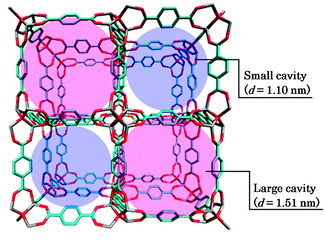 | ||
| Scheme 1 Unit cell of IRMOF-1 showing small and large cavities. Red and grey sticks represent oxygen and zinc atoms located at the corners and blue sticks represent carbon atoms of phenylene groups located at the edge of the cubic lattice. Hydrogen atoms are omitted for clarity. | ||
Recently, from our own focus on the properties of guest molecules confined in IRMOF-1, we found that several guest molecules adsorbed in IRMOF-1 exhibit thermal anomalies contracting with the melt and/or solid–solid phase transitions, and it was also discovered that these correspond to the phase transition derived from the guest molecules.24–26 In the case where benzene is the guest, two thermal anomalies were observed at 216 K and 150 K.25,26 Both of these peaks were detected at lower temperatures than the melting point of liquid benzene at 279 K, implying that the solid–solid transition takes place in benzene within the IRMOF-1 framework; this transition is not observed in the bulk phase. Our previous study revealed the dynamical structures of the guest molecules at various temperatures using solid-state 1H NMR, and elucidated the correlation between the phase transition and the dynamic behaviour of benzene.26 Based on the temperature dependence of 1H T1, the local structure and the dynamic behaviour of benzene in IRMOF-1 could be clarified. Occurrence of the solid–solid phase transition at 150 K leads to acceleration of the isotropic reorientation, accompanying intra-cavity migration of benzene in the small cavities, but there is no modulation of the molecular motion of benzene in the large cavities. Furthermore, at 216 K, self-diffusion of benzene accompanies the phase transition. Consequently, the phase transition at 150 K corresponds to partial melting of the molecular assembly in the small cavities, and the thermal anomaly at 216 K is ascribed to melting of the benzene molecular assembly confined within the IRMOF-1 framework, from the dynamic viewpoint of benzene. Thus, the guest molecular assembly confined in IRMOF-1 exhibited quite unique thermal behaviour. Similar thermal transitions of the guest molecules have also been reported for polyethylene glycol (PEG)27 and methane (CH4)28 confined in metal–organic frameworks. This is quite different from the behaviour of the guest molecules in zeolites with alumina–silicate frameworks. The adsorption structure and the dynamics of the guest molecules have been investigated in the micropores for a great number of zeolites. However, as far as we know, cooperative phenomena such as phase transition for the guest molecules in zeolites have not been reported except for a few frameworks such as Silicalite and ZSM-5.29–33 For example, benzene confined in NaX and NaY, which are some of the typical zeolites with the comparable pore size to IRMOF-1, was strongly bound to the substituted Na+ ion, resulting in the decrease in diffusivity for benzene. In fact, the diffusion coefficient for benzene in NaX and NaY is about two orders of magnitude smaller than that in IRMOF-1.34,35 The phase transition of benzene in NaX and NaY has never been observed, although the possibility of vapour–liquid phase transition of benzene in NaX was pointed out by theoretical study using Monte Carlo simulation.36 Since the host–guest interaction is much dominant than the guest–guest interaction in these zeolites, the cooperative phenomenon for benzene molecular assembly has not appeared. At this point, the guest–guest interaction plays an important role to trigger the phase transition for the molecular assembly confined in IRMOF-1, although the host–guest interaction, of course, controls the adsorption behaviour of the guest molecules into the micropores. However, there has still been plenty of room for garnering further insight into the mechanism underlying the phase transitions of the guest molecules in the metal–organic frameworks such as IRMOF-1.
From the findings of our previous work, the phase transition of benzene in IRMOF-1 is closely related to the molecular motion, especially, molecular jump in a cavity as well as over the cavities. Therefore, in order to understand the mechanism of phase transition, it is necessary to gain the knowledge of molecular motion for benzene in IRMOF-1. Molecular dynamics (MD) simulation is one of the powerful tools used to obtain microscopic insight into cooperative phenomena from the perspective of the dynamical structures of the guest molecules. Because MD simulations enable direct examination of the microscopic behaviour of the guest molecules as well as facilitate visualization of the local structure, a detailed discussion of the correlation between the dynamical structure of the guest molecules and the phase transitions can be presented on this basis.
In fact, the MD study on the guest molecules confined in IRMOF-1 has been conducted by some research groups so far.4–6,17,37,38 Especially, Amirjalayer et al. suggested the importance of the flexibility of the IRMOF-1 frameworks to diffusivity of the guest molecules,5,6 and proposed the expanded MM3 force field tuned for IRMOF-1 frameworks.39 Using this force field, they simulated the temperature and loading dependence of diffusion behaviour for benzene in IRMOF-1, and discussed the diffusion mechanism based on the relative free energy population in IRMOF-1. Their systematic and elaborated studies found the open pore structure for IRMOF-1 and high mobility of benzene at room temperature (Dself is 2.159 ± 0.378 × 10⁻⁹ m2 s−1 for 10 molecules per unit cell), which is comparable to bulk one (Dself = 1.8 × 10⁻⁹ m2 s−1). The free energy analysis identified the adsorption sites for benzene and the favourable pass for benzene diffusion in the IRMOF-1 framework. In addition, it was noticeable that the attractive guest–guest interaction reduced the free energy barrier on the diffusion pathway. Thus, Amirjalayer et al. provided clear and comprehensive features for diffusion behaviour of benzene in IRMOF-1 from the microscopic viewpoint. These results are consistent with our experimental results on solid-state NMR, and are of great help to understand the microscopic feature on phase transition for benzene in IRMOF-1. However, unfortunately, their works did not examine the molecular motion and the local structure of benzene at the temperature where phase transition took place. In order to understand the phase transition phenomenon originated from the benzene assembly in IRMOF-1 at the molecular level, it is necessary to simulate the molecular dynamics for benzene in the lower temperature ranges, covering the transition temperature. However, insofar as we know, the theoretical study using MD and MC simulations has not yet been conducted to elucidate the microscopic insight of the phase transition since our first finding of phase transition due to the guest molecules in IRMOF-1.
In the present study, our objective is to gain a microscopic insight into the relation between the molecular motion and the phase transition for benzene in IRMOF-1. On this account, we have conducted MD simulation on benzene confined in IRMOF-1 over the temperature range including the transition temperatures (150 K and 216 K), referring to the procedures and the conditions of the previous studies by Amirjalayer et al. The dynamic behaviour and the local structure of benzene have been examined in order to probe the thermal transition of benzene guests in IRMOF-1 and to discuss the mechanism underlying the cooperative phenomenon. Especially, we have addressed how the phase transition affects the population and the molecular motion of benzene in IRMOF-1. Local structures have been derived from the loading dependence of the dynamical structure, depending on the intermolecular interactions, which are dominated by host–guest as well as guest–guest interactions. Subsequently, we present a discussion of the phase transition based on the intermolecular interaction between the benzene molecules as well as between benzene and the frameworks.
2. Computational details
Molecular dynamics simulation was carried out in reference to the procedure and the conditions in the literatures.4,14 The TINKER40 program package was used to perform all molecular dynamics simulations. Since the lattice vibration of IRMOF-1 frameworks significantly affects the diffusion behaviour of the guest molecules,5,6 the MM3 force field expanded into the flexible IRMOF-139 was used to describe the IRMOF-1 lattice. This force field was developed by referring the first principles DFT calculations on the non-periodic model system. The other force field, for example, which is developed by Dubbeldam et al.,7 has well described the thermodynamic properties such as negative thermal expansion and the adsorption isotherms for CO2 and CH4, but the verification for the transport properties of the guest molecules has not been enough. The expanded MM3 force field for IRMOF-1 has already been verified to describe the diffusivity of benzene in IRMOF-1, and is suitable for our simulation. For the interaction between the guest molecules, the original MM3 force field41 was used. A visual molecular dynamics (VMD)42 program was used to visualize the results of the simulations and render the pictures.The initial structure of empty IRMOF-1 was modelled by using the crystal structure.11 The unit cell volume and the atomic coordinates were optimized simultaneously by XTALMIN program of the TINKER package, resulting in a lattice parameter of 25.9743 Å. The optimized lattice parameter is in good agreement with the experimental value which is estimated to be 25.8320 Å.6 All MD calculations were conducted on an NVT ensemble using this lattice size.5,6 Of course, the lattice vibration of IRMOF-1 was taken into account, because the flexibility of the lattice caused a noticeable effect on the simulated diffusion coefficients as well as the negative thermal expansion of IRMOF-1.7,8 Especially, a guest-free IRMOF-1 lattice is expected to show a negative thermal expansion of −13.1 × 10⁻⁶ K−1 at 300 K,8 which corresponds to an increase of 0.0748 Å in the lattice constant of 25.9743 Å upon cooling from 300 K to 80 K. (The increment in volume is only less than 1% of lattice volume at room temperature.) A similar expansion was expected for Ar-loaded IRMOF-1.43 It is considered that this increment is much smaller than the volume accessible for benzene. Now, we deal with the canonical (NVT) ensemble of the benzene molecular assembly as the first approximation. A simulation cell consisted of one unit cell including 8 cavities (4 large and 4 small cavities). A periodic boundary condition was applied to build up a three-dimensionally infinite lattice structure and to eliminate boundary effects. In order to discuss the loading dependence of the dynamic structure of the guest benzenes, the loading amounts were varied between 13, 25, 56 and 63 benzene molecules per unit cell, which are respectively equivalent to occupancies of 20, 40, 89, and 100% of the saturation amount at ambient temperature.1 In addition, supplementary simulations for the loading amount of 96 C6H6 per unit cell (152%) were also conducted.
Isothermal MD simulations were conducted using a time-step of 1.5 fs. The temperature was maintained by means of a Berendsen thermostat44 and was varied from 80 K to 300 K. The system was equilibrated for 500 ps in the pre-stage run. After equilibration, the data collection was carried out on the following additional simulation of 1 ns. A supplementary simulation was conducted for 10 ns (see ESI†). The configurations of the guest molecules were saved every 0.1 ps for the duration of 1 ns. Thus, 10![[thin space (1/6-em)]](https://www.rsc.org/images/entities/char_2009.gif) 000 structural data points were stored in respective simulations. The convergence of the total energy of the molecular system was achieved by taking account of the truncation of the intermolecular interaction; 1.20 nm cut-off for van der Waals interaction and a 1.00 nm cut-off for the electrostatic dipole–dipole interaction. The initial configuration was generated from a preliminary simulation at 400 K in each simulation, at which the kinetic energy of the guest molecules is sufficiently high to facilitate random diffusion into a unit cell and the host lattice is quite stable.1,43 Note that the preliminary simulation was only conducted in order to determine the initial configuration of the guest molecules, and the kinetic energy of the system was not carried over to the following calculations. Eight MD simulations were conducted at each temperature and the final analysis was performed on the averaged data of all trajectories.
000 structural data points were stored in respective simulations. The convergence of the total energy of the molecular system was achieved by taking account of the truncation of the intermolecular interaction; 1.20 nm cut-off for van der Waals interaction and a 1.00 nm cut-off for the electrostatic dipole–dipole interaction. The initial configuration was generated from a preliminary simulation at 400 K in each simulation, at which the kinetic energy of the guest molecules is sufficiently high to facilitate random diffusion into a unit cell and the host lattice is quite stable.1,43 Note that the preliminary simulation was only conducted in order to determine the initial configuration of the guest molecules, and the kinetic energy of the system was not carried over to the following calculations. Eight MD simulations were conducted at each temperature and the final analysis was performed on the averaged data of all trajectories.
3. Results and discussion
3.1 Radial distribution function
In order to discuss the local structures of benzene, the radial distribution function (pair correlation function), g(r), has been commonly used for liquid and/or solution. In the present study, the use of g(r) makes it possible to discuss the adsorbed structures as well as the structural changes of the benzene molecular assembly. For benzene confined in IRMOF-1, g(r) for the centre of mass of the benzene molecule is a useful quantity for representing the local structure of the benzene molecules in IRMOF-1, and this parameter is generally evaluated using the following equation for iso-molecules:45 | (1) |
Fig. 1 shows the temperature dependence of g(r) in the case of unit cells containing 25 molecules (a) and 56 molecules (b). The first peak, which corresponds to the nearest neighbours, appears at 0.55 nm at 280 K, and is in good agreement with the rotational diameter of benzene. The g(r) profile is similar for (a) and (b), and the intensity of the observed peaks decays with increasing intermolecular distance. This behaviour of g(r) is commonly observed for fluids with short-range ordering of the molecules, suggesting that benzene assumes a liquid-like structure in IRMOF-1 at 280 K. The g(r) profiles depend remarkably on temperature, but the nature of this dependence was quite different for (a) and (b), especially, below 200 K. At a loading of 25 benzene molecules per unit cell, the intensity of the first peak corresponds to a nearest neighbour coordination number below 150 K (the nearest neighbours account for the first minimum of g(r) at 0.74 nm). With increasing temperature, the intensity of the first peak increases. Fig. 1(c) shows the temperature dependence of the average number of nearest neighbours (n1). The n1 value increases step-wise from 1.4 to 1.7 at 150 K. Furthermore, the higher peaks exceed the value of 1, implying that the adsorbed benzene molecules maintain the ordered structure over the long range. These tendencies were also observed in the case of the model including 13 molecules per unit cell (see Fig. S1, ESI† and Fig. 1(c)).
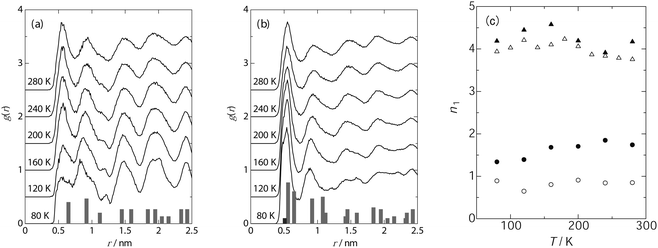 | ||
| Fig. 1 Temperature dependence of radial distribution function of benzene in IRMOF-1; 25 molecules (a) and 56 molecules (b) in a unit cell, and the coordination number at the nearest neighbours (c); 13 molecules (○), 25 molecules (●), 56 molecules (△) and 63 molecules (▲). The histograms in (a) and (b) represent the frequency of the intermolecular distance between benzene molecules in IRMOF-1. | ||
In contrast, in the model employing a loading of 56 molecules, the peaks of the first and the second nearest neighbours gained intensity whereas the others collapsed with decreasing temperature, implying the development of the short-range order of benzene below 180 K. The average number of nearest neighbours increased from 3.9 at 80 K to 4.2 at 180 K, whereas this number decreases to 3.7 at 280 K as shown in Fig. 1(c). Similar behaviour was also observed for a loading of 63 molecules (see Fig. S1, ESI† and Fig. 1(c)). The temperatures at which the rapid decrease in g(r) takes place correspond strongly to the phase transition points observed using DTA,25,26 implying that a change in the local density of benzene at the first coordination sphere accompanies the phase transition of the guest molecules. In addition, it is found that the structure of benzene localized in the IRMOF-1 nanocavity changes depending on the benzene loading.
Four feasibilities for benzene localization in IRMOF-1 were found using the simulation, as illustrated in Scheme 2; the corner sites (A site) in a large cavity, the centre site (B site) in a large cavity, the sites on the window (C site), and the corner sites of the small cavity (D site). These occupation sites are consistent with the result of the previous MD simulation of benzene diffusion in IRMOF-1.6 A corner site (A site) in a large cavity is surrounded by three planes of the phenylene rings in the bridging moieties, where a benzene molecule is close to three phenylene carbons and interacts most effectively with them. As a result, this site is the most stable site for benzene adsorption in IRMOF-1. The second most stable site is on the window (C site), where the benzene molecules can interact with the surrounding four bridging phenylene rings. At the centre site (B site) in a large cavity, the benzene molecule occupying this site will be surrounded by other benzene molecules occupying the A site in the same cavity, that is, the benzene molecules at the B site can be stabilized by guest–guest interactions rather than by guest–wall interactions. Given that the B site is far from the walls of the cavity, the benzene molecule occupying this site interacts effectively with the surrounding benzene molecules occupying the A sites. Although the corner of the small cavity (D site) is also surrounded by three phenylene groups, the benzene molecules interact directly with the protons of the phenylene group. The van der Waals interaction with protons is much smaller than that with carbons, and the D site then provides potential walls that are shallower than the other sites.
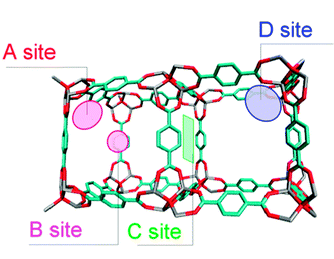 | ||
| Scheme 2 Preferred adsorption sites for the guest molecules found in the simulations: the corner sites (A site) in a large cavity, the centre site (B site) in a large cavity, the sites on window (C site), and the corner sites of the small cavity (D site). | ||
In the case where the benzene molecules occupy the A sites, the intermolecular distances between the benzene molecules were measured and the number of times that the same intermolecular distance was obtained for various pairs of benzenes in a unit cell was counted; these data are summarized in the histograms shown in Fig. 1(a). The position and the intensity of the histograms are highly consistent with those in the g(r) data, strongly suggesting the dominant occupation of the A sites at low benzene loading (25 molecules in a unit cell). On the other hand, the histograms shown in Fig. 1(b) represent the frequencies of the intermolecular distances when the benzene molecules occupy the B (4 sites in a unit cell), C (24 sites in a unit cell), and D (32 sites in a unit cell) sites in addition to the A sites. The position of each peak is also suitably explained by the occupation of the B, C, and D sites, but the peak intensity is dependent on the population of each site. In the case of g(r), the population of the first and the second nearest neighbours increases with decreasing temperature due to the increase in the peak intensity. Therefore, it is surmised that the benzene molecules occupy the B, C, and D sites, respectively, giving rise to the intermolecular distances of 0.55 nm and 0.9 nm. Consequently, it is expected that occupation of these multi-sites causes the local condensation of benzene molecules in the IRMOF-1 nanocavity, where a dense structure of the benzene molecular assembly will be achieved.
3.2 Occupancy of benzene in the IRMOF-1 nanocavity
The occupation of benzene within the stable adsorption sites of IRMOF-1 takes place inhomogeneously at temperatures lower than 180 K. Fig. 2(a) and (b) show the occupancy of the centres of mass on benzene molecules integrated during a 1 ns simulation in a large and small cavity, respectively. Open circles and triangles represent the average population of the guest molecules, which represents the probability of finding benzene molecules per unit cavity for the respective cavities.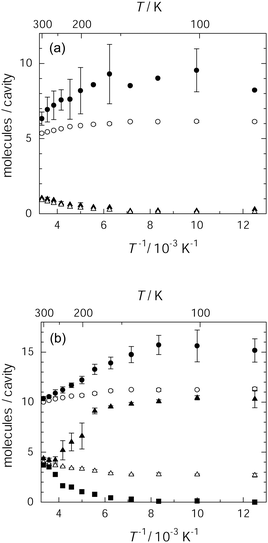 | ||
| Fig. 2 Occupancy of the centres of benzene molecules in IRMOF-1 for 25 molecules (a) and 56 molecules (b) in a unit cell: average occupancy in a large cavity (○) and in a small cavity (△), and the most populated occupancy in the large cavity (●) and the small cavity (▲). For 56 molecules, the less populated occupancy in the small cavity is also presented (■). | ||
In each loading, the benzene molecules were distributed within 4 large cavities as well as 4 small cavities, but the average population of benzene molecules per cavity was dependent on the benzene loading. In the low loading, the average population of benzene fell within 5.3–6.2 molecules per large cavity and less than 1 molecule per small cavity. In the high loading, the relative population of benzene increased for the small cavities up to 2.8–3.9 molecules per cavity and that in the large cavities was 10.1–11.8 molecules per cavity. These average populations show little temperature dependence. This behaviour was similar to that observed for the other loading levels such as 13 and 63 benzene molecules per unit cell (see Fig. S2, ESI†). The population in each cavity and the temperature dependence of the population are reflective of the population of two components of 1H T1 for benzene confined in IRMOF-1.26
However, each cavity accommodates benzene molecules inhomogeneously. The occupancies of the benzene molecules in the most populated large and small cavities in a unit cell are respectively represented by closed circles and triangles in Fig. 2. In the high loading, the less populated occupancy is also represented by closed squares. The maximum occupation in each of the large and small cavities and the minimum occupation in the small cavities depend on temperature as shown in Fig. 2(a) and (b). In particular, the maximum and minimum occupation in the small cavities at high benzene loading was remarkably temperature dependent. Here, the maximum occupation increased from 4 to 9 molecules per cavity and the minimum occupation decreased from 4 to almost zero, as the temperature decreased from 250 K to 200 K. This result suggests jump of benzene from the less to the most populated cavities as temperature decreases. Furthermore, the occupancy in the most populated large cavity also tended to increase as the temperature decreased. These features indicate that the guest molecules exhibit a tendency to concentrate into one of the small cavities below 180 K, which indicates that the guest–guest interactions become dominant relative to interactions between the host framework and the guest molecules below 180 K. The aggregation of benzene molecules over several unit cells gives rise to the condensed benzene molecular assembly in IRMOF-1. In fact, similar results were reported in 1-D nanochannels of PCPs, where clustering of the guest polymers was observed in the low temperature region using Monte Carlo simulations.27 Thus, the present results also suggest that the phase transition at 216 K detected during thermal analysis should accompany the formation of the benzene aggregates. It appears that the guest molecules within small cavities play an important role in the condensation.
Next, in order to present the structure of the aggregated benzene molecular assembly in a cavity, attempts were made to simulate the dynamic structure of benzene under the higher loading conditions (96 C6H6 molecules per unit cell). At this loading level, benzene should be equivalently distributed into 15 molecules confined in a large cavity and 9 in a small cavity, which corresponds to the most populated cavities between 80 K and 180 K for the 89% loading specimen. The snapshots for a 1 ns run at 100 K are shown in Fig. 3, in which the typical structures of the guest molecules within a large and small cavity are depicted. A large cavity accommodates 17 benzene molecules and a smaller one accommodates 8 benzene molecules. Although there are many more adsorption sites in the clustering structure than in a unit cell, each of these can be categorized as an A, B, C or D site. The benzene molecules are arranged into an ordered motif in both the large and small cavities as an average structure obtained during a 1 ns simulation run. Fig. 3(b) indicates that half of the A sites in a large cavity are diagonally occupied, plausibly to avoid steric hindrance by the benzene molecules occupying the window sites (C site), although the total number of guest molecules is quite large. Benzene molecules occupying A sites typically orient their molecular plane to face the nodal corner of the framework as shown in Fig. 3(c). In contrast, a C site is occupied simultaneously by two benzene molecules which are located diagonally on the window in a manner that minimizes the repulsion between the A and C sites. Benzene molecules also occupy the B site located at the centre of a large cavity, but the orientation of the benzene molecules in the B site seems to fluctuate during a simulation. In addition, the D sites are found at the corners of a small cavity. The guest molecules in the C and D sites typically display a herringbone-like orientation as shown in Fig. 3(d) and (e). This implies that eight benzene molecules within a small cavity, as well as benzenes on the window, are stabilized by mutual guest–guest interactions. However, the structure reflecting the π-stacking guest–guest as well as host–guest interactions was not found in this simulation. Thus, the template effect of the regular and periodic porous structure of IRMOF-1 gives rise to the ordered structure of the confined benzene molecules, but the structure is considerably different from the crystal structure of benzene in the bulk solid, in which the centre of mass of benzene forms a face-centred orthorhombic lattice structure.46 A similar result has been reported by another research group using the Monte Carlo simulation, in which freezing phenomena of a Lennard-Jones fluid confined in jungle-gym like porous structures with various pore sizes were examined.47 The structure, referred to as N17 in their work, is very similar to the ordered structure observed in the large cavities in the current simulations. The configuration of the fluid within a smaller pore in that study is also highly consistent with the feature of the D sites detected in the present simulation. Furthermore, the ordered structures of the confined molecules in IRMOF-1 have also been observed for ferrocene48 and methane.27 The aggregated van der Waals molecules should exhibit a phase change from solid to fluid, similar to the present system.
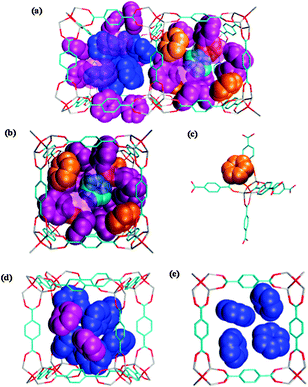 | ||
| Fig. 3 Snapshots of the typical structure of benzene assemblies (a) within both large and small cavities, (b) within a large cavity, (c) at A sites, (d) at C and D sites and (e) within a small cavity. Benzenes located at A, B, C and D sites are respectively represented by orange-, cyan-, purple-, and blue-colour spheres. In (a) and (b), benzenes on the near side are translucently represented. In (e), the guest molecules on the far side are omitted for clarity. Also, hydrogen atoms are omitted for clarity in all figures. | ||
3.3 Molecular motion of benzene molecules
 | (2) |
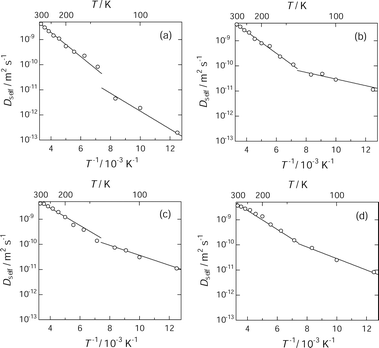 | ||
| Fig. 4 Arrhenius plot of diffusion coefficient of benzene in IRMOF-1: 13 molecules (a), 25 molecules (b), 56 molecules (c) and 63 molecules (d) per unit cell. An inflection point appears at ca. 135 K, suggesting that there are two thermal activation processes for translational diffusion of benzene in IRMOF-1. | ||
For the loading including more than 25 benzene molecules per unit cell, it appears that the temperature dependence of Dself was consistent for various loadings, whereas at the loading level of 20% saturation, Dself at temperatures below 135 K was 10−2 orders smaller than the corresponding value for other loading levels. According to Amirjalayer et al., the attractive guest–guest interaction lowers effectively the potential barrier along the diffusion pathway.6 Both of the low benzene loading and the low temperature weaken the guest–guest interaction efficiently, resulting in substantial stabilization of benzene at the adsorption site (probably A-site) due to the host–guest interaction. The activation energies were determined from the slope of the Arrhenius plot for each process, and the results are summarized in Table 1.
| Population of C6H6 (%) | Number of molecules | E a/kJ mol−1 | |
|---|---|---|---|
| Molecules per unit cell | High temp. | Low temp. | |
| 20 | 13 | 9.2 | 6.8 |
| 40 | 25 | 8.3 | 2.5 |
| 89 | 56 | 6.7 | 3.8 |
| 100 | 63 | 7.2 | 4.4 |
The activation energy at the loading levels above 40% is 7.4 ± 0.7 kJ mol−1 above 135 K and 3.6 ± 1.0 kJ mol−1 below 135 K. The Ea value above 135 K is smaller than the experimental temperature dependence of the Dself value (26.5 ± 3.0 kJ mol−1) determined from PFG-NMR,13 whereas it is in good agreement with the experimental value (7 kJ mol−1) determined from the temperature dependence of 1H T1 in our previous NMR study.26 At the loading level of 20%, the Ea value is 9.2 kJ mol−1 at temperatures above 135 K and 6.8 kJ mol−1 below 135 K; these values are larger than those obtained at other loading levels. These features suggest that at 20% loading, the benzene molecules interact with the IRMOF-1 frameworks more effectively than at the higher loading levels. The strong and effective interaction between benzene and IRMOF-1 keeps benzene at the stable adsorption sites in the large cavities, and lowers the mobility of the guest molecules quite effectively at low temperature.
The two thermal activation processes may be related to the spaces accessible for benzene in IRMOF-1. In the high temperature region, Dself ranges from 10−9 to 10−8 m2 s−1. This corresponds to root mean square distances (d) ranging from 2.4 nm to 7.7 nm for a time interval of 1 ns, using the relation d = (6DΔt)1/2. These d values indicate that the benzene molecules diffuse over several cavities, because the lattice constant of IRMOF-1 is 2.58320(5) nm at 258(2) K and the diameters of the cavities are 1.51 nm and 1.10 nm, respectively.10 That is, inter-cavity diffusion takes place in this temperature region. On the other hand, Dself values in the range of 10−13 to 10−10 m2 s−1 obtained below 135 K give corresponding root mean square distances ranging from 0.024 nm to 0.77 nm, which are much smaller than the diameter of both the large and small cavities. Especially, the root mean square distance (0.024 nm) for the order of 10−13 m2 s−1 in Dself is less than 2% of the pore diameter (1.51 nm). This motion will be regarded as the local vibration of benzene at the adsorption site rather than diffusion. This feature also implies that benzene molecules at this loading level are trapped by deep potentials at the stable adsorption site. Thus, these diffusion distances suggest the diffusion of benzene within a cavity. The inflection point on the Arrhenius plot is therefore attributed to the transition of the diffusion mode from intra-cavity diffusion below 135 K to inter-cavity diffusion above 135 K. This consideration leads to the important discussion of the difference between the activation energy in the low and the high temperature regions. At each loading, the difference between the activation energy in the two regions is 2.4–2.9 kJ mol−1, except for the value of 5.8 kJ mol−1 obtained at 40% loading. These differences correspond to the energy barrier between the large and the small cavities. These energy gaps are somewhat smaller than the potential barrier determined by free energy mapping along the diffusion path of a benzene molecule (6.3–11.5 kJ mol−1).6 In fact, the previous work pointed out that the substantial guest–guest interaction lowers the potential barriers.6 Slowing of the molecular motion reduces the fluctuation of the orientation, resulting in the more efficient guest–guest interaction. As a result, it is expected to show further reduction in the potential barriers. In addition, cooperative motions of benzene molecules may also reduce the potential barrier between the large and the small cavities. Benzene requires the kinetic energy corresponding to these energy differences in order to pass through the window between the large and the small cavities. Assuming that the kinetic energy required to the rotating benzene for diffusion is given by (3/2)RT, the energy of 2.4–2.9 kJ mol−1 corresponds to the thermal energy at 192–232 K. That is, it is expected that the transition from intra-cavity diffusion to inter-cavity diffusion takes place in these temperature regions, which is consistent with the experimental transition point at 216 K. Thus, the change in the dynamic features of benzene molecules will be closely related to the phase transition behaviour of the guest molecular assembly in IRMOF-1.
In the case of benzene, the molecular reorientation is characterized by rotation around C6 and C2 symmetry axes. These two types of reorientational correlation functions are described by the following definition:50
| CR(Δt) = 〈u(0)·u(Δt)〉 | (3) |
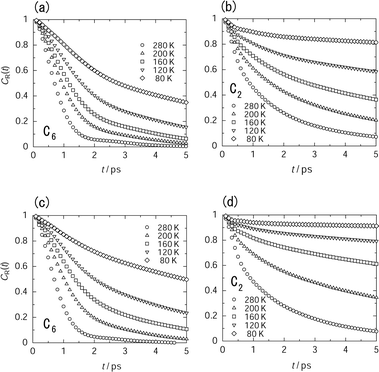 | ||
| Fig. 5 Temperature dependence of reorientational correlation function (CR(t)) of the guest molecules in a large cavity ((a) and (b)) and in a small cavity ((c) and (d)) at the loading level of 56 molecules in a unit cell. The decay of CR(t) around the C6-axis ((a) and (c)) is much faster than decay around the C2-axis ((b) and (d)). | ||
The difference in the decay curves is remarkable for the motional mode rather than the kinds of cavity. The decay of the C6 axial reorientation is faster than that of the C2 axial reorientation at lower temperature, indicating that the guest molecules undergo anisotropic reorientation. With an increase in temperature, the decay rates of correlation functions approach each other. Because of the non-exponential decay, it is difficult to evaluate the correlation time precisely. Thus, we used the time constant which is determined from the slope obeying the exponential decay as a conventional index for the decay rate. In the case of the C6 axial reorientation, the initial slope obeys the exponential decay, whereas in the case of the C2 axial reorientation, the decay curve at t > 1 ps is approximated by the exponential decay. The correlation time showed the Arrhenius type temperature dependence as depicted in Fig. 6.
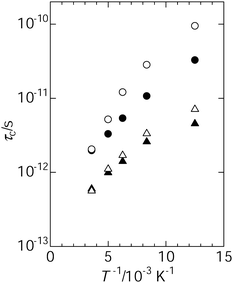 | ||
| Fig. 6 Temperature dependence of correlation time for benzene reorientation; C2 axial reorientation in the large cavity (●), C2 axial reorientation in the small cavity (○), C6 axial reorientation in the large cavity (▲) and C6 axial reorientation in the small cavity (△). | ||
The correlation time for the C6 reorientation is shorter than that for the C2 axial reorientation, suggesting that the C6 reorientation is faster than the C2 reorientation. Furthermore, the apparent activation energy for the C6 axial reorientation (1.9 kJ mol−1 in a large cavity and 2.3 kJ mol−1 in a small cavity) is smaller than that for the C2 axial reorientation (2.6 kJ mol−1 in a large cavity and 3.5 kJ mol−1 in a small cavity). That is, it is found that the C6 axial reorientation will be excited easier than the C2 axial reorientation, because of the low energy barrier. In our previous work, we reported the activation energy for the C6 axial reorientation (4.5 kJ mol−1) in the small cavities and for the isotropic reorientation (3.5 kJ mol−1) in the large cavities. The activation energy evaluated by MD simulation is consistent with the experimental ones, although they are somewhat smaller than the experimental one. The remarkable feature from the MD study is the anisotropic aspects of the reorientation of benzene, although the isotropic reorientation of benzene was experimentally observed in the large cavities. The difference between τc, C6 and τc, C2 in the large cavities is smaller than that in the small cavities. This feature implies that the anisotropy of the reorientation of benzene in the large cavities is smaller than that in the small cavities. Actually, it is difficult to discuss the difference in the reorientation of benzene between the experimental (∼5 ns) and the simulation (1 ps), because the time scale is quite different in both cases. However, the present MD simulation reproduced the tendency that the large cavities facilitate the molecular reorientation of benzene in comparison with the small cavities. This feature is consistent with the molecular motion of benzene depicted on the basis of our previous NMR study.26
3.4 Diffusion trajectory for benzene molecules
In order to visualize the structural changes occurring in the benzene molecular assembly, the diffusion pathways of a benzene molecule are shown in Fig. 7.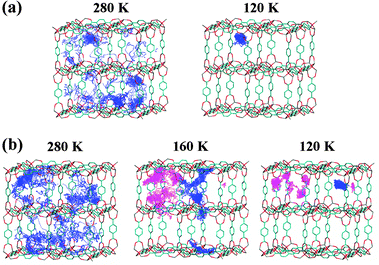 | ||
| Fig. 7 Trajectory of the centres of mass for benzene molecules within IRMOF-1: 25 molecules (a) and 56 molecules (b) per unit cell. Diffusion pathway of a benzene molecule over 1 ns. For 56 molecules (b) per unit cell, two benzene molecules are traced at 160 K and 120 K to distinguish the molecules in a large and small cavity respectively. | ||
Fig. 7(a) shows the diffusion pathway of a benzene molecule at a loading of 25 benzene molecules (40% saturation at room temperature) per unit cell. The state of the guest molecules can be classified into two temperature regions; the temperature region above 140 K is denoted as “region I” and the region below 120 K as “region II.” At 280 K (region I), a benzene molecule migrates the A sites in the unit cell, whereas the trajectory of the benzene molecule is short on the other sites (B, C and D sites). This indicates that the A site is the primary adsorption site and is occupied prior to the others. The B, C and D sites appear to be stabilized due to the guest–guest interactions rather than the guest–host interactions. Similar results have been reported in the previous work and the Monte Carlo method.16,40 From the dynamic view point, a benzene molecule undergoes inter-cavity diffusion through the minor sites in the small cavities and the windows. This picture corroborates the diffusive dynamic features of benzene proposed by Amirjalayer et al.5,6 In contrast, the benzene molecule was localized at the A sites at 120 K (region II). Similar behaviour was also reproduced at the lower loading level of 13 benzene molecules in the unit cell (see Fig. S3, ESI†). Thus, it is concluded that the inflection in the Arrhenius plot of Dself corresponds to slowing of the benzene migration due to the localization of benzene molecules at the A sites. That is, freezing lowers the degree of freedom for translation upon cooling.
Fig. 7(b) shows the diffusion pathway of a benzene molecule at a benzene loading of 56 molecules (89% saturation at room temperature) per unit cell. In this case, the aggregation of the guest molecules and the dynamic features of benzene can be classified into three temperature regions based on the results presented above: the temperature region above 200 K, from 180 K to 160 K, and below 140 K. These temperature regions are denoted “region I,” “region II,” and “region III,” respectively. Two benzene molecules were traced at 160 K and 120 K to distinguish the molecules in a large and small cavity, respectively, although one molecule was taken up at 280 K. At 280 K (region I), the diffusion pathway exhibits migration over the entire unit cell, suggesting the preferable occupation of the A sites (corner sites), the B sites (centre site) in a large cavity, and the C sites (sites on the window). The benzene molecules undergo inter-cavity diffusion, whereby they move from a site in a large cavity to another in an adjacent large cavity through the window and a small cavity, as mentioned by Amirjalayer et al.5,6 At 160 K (region II), on the other hand, the diffusion pathway demonstrates the localization of benzene molecules in both the large and small cavities. That is, benzene molecules mainly undergo intra-cavity diffusion, in which benzene migrates from a site to another site in the same cavity by grazing the window sites. At 120 K (region III), the benzene molecules confined in a large cavity still undergo intra-cavity diffusion, but those within a small cavity are localized at the corner sites. For the simulation time of 10 ns, the localization of benzene in each cavity was confirmed as described in ESI.† This result means that the resident time of benzene in each cavity is at least longer than 10 ns and more. As mentioned, it appears that the inflection point in the Arrhenius plot of Dself corresponds to slowing of the benzene migration due to the localization of benzene molecules within a small cavity. This slowing of benzene precedes the localization of benzene in the cavity. The aggregation of benzene takes place subsequent to localization of benzene within the cavity. In the case of the simulation, note that the number of the guest molecules was fixed. However, in the specimens used in the experiments, the number of guest molecules in a unit cell might fluctuate due to entrance and exit of the molecules between neighbouring unit cells (fluctuation of the local density). Decreasing the temperature suppresses the fluctuation of the local density, assisting the formation and growth of the aggregated structure of benzene in IRMOF-1. This effect will be particularly remarkable in the intermediate and low temperature regions. Similar behaviour was observed at the higher loading level of 63 benzene molecules per unit cell (see Fig. S4, ESI†). Thus, the benzene molecules form a larger molecular assembly which will extend to the mesoscopic-sized region.
Conclusive schemes of the dynamic behaviour and the local structure of benzene in IRMOF-1 are summarized in Scheme 3 for the 40% and 89% loading levels. These dynamic behaviours are in good agreement with the molecular motion of benzene evaluated using 1H spin–lattice relaxation time (T1) in our previous work.26 The simulation in this study well reproduces the distinguishable occupation of benzene within the large and small cavities, i.e., the intra-cavity and inter-cavity diffusion of benzene molecules. The further insight provided by the present study is the description of the aggregated structure of benzene, which has not been observed using NMR. In the case of the high loading levels, the guest–guest intermolecular interactions compete with the host–guest interactions. With decreasing temperature, the kinetic energy of the guest molecules is lowered and the intermolecular interaction becomes effective. Consequently, predominance of the intermolecular (guest–guest) interaction leads to the aggregated structure of the benzene molecular assembly, where the benzene molecules associate with each other in the neighbouring cavities. The structural transition of benzene between regions I and II indicates that the phase transition detected at 215 K using thermal analysis results from the formation and/or destruction of the aggregated structure of the guest molecules. In addition, the phase transition at 150 K, which was detected in the thermal analysis, results from the localization of the guest molecules in the small cavities. That is, this phase transition may be regarded as the partial melting of the benzene molecular assembly confined in the small cavities.
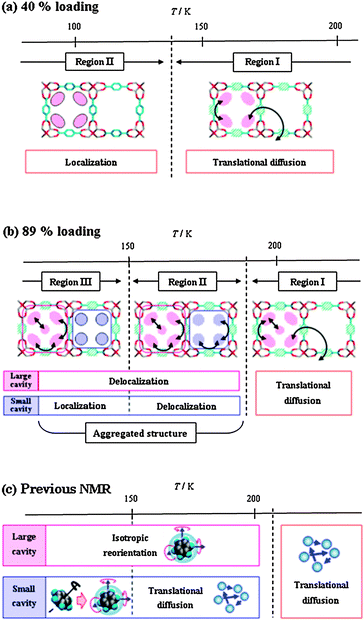 | ||
| Scheme 3 Schematic representation of dynamic behaviour of benzene in IRMOF-1 at 40% loading (a) and 89% loading (b) given by MD simulation, and by our previous NMR study (c). | ||
4. Conclusions
In the present study, molecular dynamics simulations of benzene molecules confined in IRMOF-1 were conducted in order to investigate the correlation between the phase transition phenomena and dynamic behaviour of the guest molecules, from the microscopic viewpoint. The conclusive remarks are summarized below.At 89% benzene loading, the benzene molecules in IRMOF-1 undergo migration over the entire unit cell at high temperatures such as 280 K, where the molecular assembly behaves as a fluid in the IRMOF-1 frameworks. Below 200 K, the benzene molecules are aggregated, accompanying the intra-cavity migration into both the large and small cavities. The aggregation of benzene molecules at 200 K is analogous to solidification of the benzene molecules in the IRMOF-1 frameworks, which corresponds to the phase transition at 215 K observed using DTA. Furthermore, benzene molecules are localized within the small cavities below 160 K, even though the intra-cavity diffusion in the large cavities is maintained. This behaviour is relevant to the phase transition at 150 K, which may be attributable to the partial freezing of the translational motion of benzene. Thus, the dynamic behaviour of benzene modelled by MD simulation is in good agreement with the results of the previous NMR study. At 100% benzene loading, results similar to those obtained at the 89% loading level were observed.
Furthermore, the supplementary simulation of 152% benzene loading implies that the localization of the guest molecules may take place not only in the small cavities but also in the large cavities, where the guest molecules form an ordered structure at low temperatures. The guest–guest interactions contribute to the formation of the ordered structure of the benzene molecules, whereas the confined ordered structure is considerably different from the crystal structure of benzene in the bulk solid due to the template effect exerted by the regular and periodic porous structure of IRMOF-1.
On the other hand, at a loading level of 40%, the benzene molecules migrate over the entire unit cell at high temperatures such as 280 K, where the molecular assembly behaves as a fluid in the IRMOF-1 frameworks in a manner similar to the 89% loading level. At the 40% loading level, the benzene molecules are accommodated strictly in the large cavities and the formation of the aggregated structure was not observed. With decreasing temperature (below 140 K), the benzene molecules become localized at the corners of the large cavities. The dynamic features generated from the simulation are not in agreement with the results of the thermal analysis, in which two thermal anomalies are detected at 215 K and 150 K. This discrepancy may be due to the missing neighbouring unit cells in the simulation. In the specimen used in the experiments, the aggregated structures might be formed by interaction of the guest molecules over several neighbouring unit cells even at low loadings. Thus, the simulated results at the 40% loading level probably reflect the local structure of the much lower loading specimen. Similar results were also observed at 20% loading. At these loading levels, phase transition should accompany the localization of the guest molecules at the corners of the large cavities due to the substantial host–guest interactions. The reorientation of benzene also supports the transition from anisotropic feature to isotropic one at 150 K in 40% loading as well as 89% loading.
Overall, it can be concluded that the loading dependence of the phase transition behaviour can be attributed to whether the host–guest interactions or the guest–guest interactions are dominant in the aggregation of the guest molecules.
Acknowledgements
This study was partially supported by a Grant-in-Aid for Scientific Research (No. 21350012) from the Japanese Ministry of Education, Culture, Sports, Science, and Technology.Notes and references
- H. Li, M. Eddaoudi, M. O'Keeffe and O. M. Yaghi, Nature, 1999, 402, 276–279 CrossRef CAS.
- U. Mueller, M. Schubert, F. Teich, H. Puetter, K. Schierle-Arndt and J. Pastré, J. Mater. Chem., 2006, 16, 626–636 RSC.
- H. Deng, C. J. Doonan, H. Furukawa, R. B. Ferreira, J. Towne, C. B. Knobler, B. Wang and O. M. Yaghi, Science, 2010, 327, 846–850 CrossRef CAS.
- J. A. Greathouse and M. D. Allendorf, J. Am. Chem. Soc., 2006, 128, 10678–10679 CrossRef CAS.
- S. Amirjalayer, M. Tafipolsky and R. Schmid, Angew. Chem., Int. Ed., 2007, 46, 463–466 CrossRef CAS.
- S. Amirjalayer and R. Schmid, Microporous Mesoporous Mater., 2009, 125, 90–96 CrossRef CAS.
- D. Dubbeldam, K. S. Walton, D. E. Ellis and R. Q. Snurr, Angew. Chem., Int. Ed., 2007, 46, 4496–4499 CrossRef CAS.
- N. Lock, Y. Wu, M. Christensen, L. J. Cameron, V. K. Peterson, A. J. Bridgeman, C. J. Kepert and B. B. Iversen, J. Phys. Chem. C, 2010, 114, 16181–16186 CAS.
- J. Gonzalez, R. N. Devi, D. P. Tunstall, P. A. Cox and P. A. Wright, Microporous Mesoporous Mater., 2005, 84, 97–104 CrossRef CAS.
- S. L. Gould, D. Tranchemontagne, O. M. Yaghi and M. A. Garcia-Garibay, J. Am. Chem. Soc., 2008, 130, 3246–3247 CrossRef CAS.
- M. Eddaoudi, J. Kim, N. Rosi, D. Vodak, J. Wachter, M. O'Keeffe and O. M. Yaghi, Science, 2002, 295, 469–472 CrossRef CAS.
- F. Stallmach, S. Gröger, V. Künzel, J. Kärger, O. M. Yaghi, M. Hesse and U. Müller, Angew. Chem., Int. Ed., 2006, 45, 2123–2126 CrossRef CAS.
- S. Hertel, M. Wehring, S. Amirjalayer, M. Gratz, J. Lincke, H. Krautscheid, R. Schmid and F. Stallmach, Eur. Phys. J.: Appl. Phys., 2011, 55, 20702 CrossRef.
- C. Chmelik, D. Freude, H. Bux and J. Haase, Microporous Mesoporous Mater., 2012, 147, 135–141 CrossRef.
- M. Gratz, S. Hertel, M. Wehring, F. Stallmach and P. Galvosas, New J. Phys., 2011, 13, 045016 CrossRef.
- A. I. Skoulidas and D. S. Sholl, J. Phys. Chem. B, 2005, 109, 15760–15768 CrossRef CAS.
- R. Xiong, J. T. Fern, D. J. Keffer, M. Fuentes-Cabrera and D. M. Nicholson, Mol. Simul., 2009, 35, 910–919 CrossRef CAS.
- J. A. Greathouse, T. L. Kinnibrugh and M. D. Allendorf, Ind. Eng. Chem. Res., 2009, 48, 3425–3431 CrossRef CAS.
- T. B. Lee, D. H. Jung, D. Kim, J. Kim, K. Choi and S.-H. Choi, Catal. Today, 2009, 146, 216–222 CrossRef CAS.
- H. Jobic, N. Rosenbach Jr., A. Ghoufi, D. I. Kolokolov, P. G. Yot, T. Devic, C. Serre, G. Ferey and G. Maurin, Chem.–Eur. J., 2010, 16, 10337–10341 CrossRef CAS.
- I. Déroche, S. Rives, T. Trung, Q. Yang, A. Ghoufi, N. A. Ramsahye, P. Trens, F. Fajula, T. Devic, C. Serre, G. Férey, H. Jobic and G. Maurin, J. Phys. Chem. C, 2011, 115, 13868–13876 Search PubMed.
- Z. Zhao, X. Li, S. Huang, Q. Xia and Z. Li, Ind. Eng. Chem. Res., 2011, 50, 2254–2261 CrossRef CAS.
- D. C. Ford, D. Dubbeldam, R. Q. Snurr, V. Künzel, M. Wehring, F. Stallmach, J. Kärger and U. Müller, J. Phys. Chem. Lett., 2012, 3, 930–933 CrossRef CAS.
- T. Ueda, K. Kurokawa, H. Omichi, K. Miyakubo and T. Eguchi, Chem. Phys. Lett., 2007, 443, 293–297 CrossRef CAS.
- T. Ueda, K. Kurokawa, Y. Kawamura, K. Miyakubo and T. Eguchi, in Nanoporous Materials, Proceedings of the 5th International Symposium, ed. A. Sayari and M. Jaroniec, World Scientific, Singapore, 2008, pp. 445–455 Search PubMed.
- T. Ueda, K. Kurokawa, Y. Kawamura, K. Miyakubo and T. Eguchi, J. Phys. Chem. C, 2012, 116, 1012–1019 CAS.
- T. Uemura, N. Yanai, S. Watanabe, H. Tanaka, R. Numaguchi, M. Miyahara, Y. Ohta, M. Nagaoka and S. Kitagawa, Nat. Commun., 2010, 83, 1–8 CrossRef.
- H. Wu, W. Zhou and T. Yildirim, J. Phys. Chem. C, 2009, 113, 3029–3035 CAS.
- C.-J. Guo, O. Talu and D. T. Hayhurst, AIChE J., 1989, 35, 573–578 CrossRef CAS.
- B. Smit and T. L. M. Maesen, Nature, 1995, 374, 42–44 CAS.
- Y. Huang and P. Qiu, Langmuir, 1999, 15, 1591–1593 CrossRef CAS.
- D. Dutta, A. Sachdeva and P. K. Pujari, Chem. Phys. Lett., 2006, 432, 116–121 CrossRef CAS.
- P. Maheshwari, D. Dutta, S. K. Sharma, K. Sudarshan, P. K. Pujari, M. Majumder, B. Pahari, B. Bandyopadhyay, K. Ghoshray and A. Ghoshray, J. Phys. Chem. C, 2010, 114, 4966–4972 CAS.
- B. Geil, O. Isfort, B. Boddenberg, D. E. Favre, B. F. Chmelka and F. Fujara, J. Chem. Phys., 2002, 116, 2184 CrossRef CAS.
- B. Zibrowius, J. Caro and H. Pfeifer, J. Chem. Soc., Faraday Trans. 1, 1988, 84, 2347–2356 RSC.
- I. Dukovski, J. Machta, C. Saravanan and S. M. Auerbach, J. Chem. Phys., 2000, 113, 3697 CrossRef CAS.
- R. Krishna and J. M. van Baten, J. Phys. Chem. C, 2010, 114, 11557–11563 CAS.
- S. S. Han, S.-H. Choi and A. C. T. van Duin, Chem. Commun., 2010, 46, 5713–5715 RSC.
- M. Tafipolsky, S. Amirjalayer and R. Schmid, J. Comput. Chem., 2007, 28, 1169–1176 CrossRef CAS.
- J. W. Ponder and F. M. Richards, J. Comput. Chem., 1987, 8, 1016–1024 CrossRef CAS.
- N. L. Allinger, Y. H. Yuh and J. H. Lii, J. Am. Chem. Soc., 1989, 111, 8551–8566 CrossRef CAS.
- W. Humphrey, A. Dalke and K. Schulten, J. Mol. Graphics, 1996, 14, 33–38 CrossRef CAS.
- J. L. C. Rowsell, E. C. Spencer, J. Eckert, J. A. K. Howard and O. M. Yaghi, Science, 2005, 309, 1350–1354 CrossRef CAS.
- H. J. C. Berendsen, J. P. M. Postma, W. F. Van Gunsteren, A. DiNola and J. R. Haak, J. Chem. Phys., 1984, 81, 3684–3690 CrossRef CAS.
- F. H. Stillinger and T. A. Weber, Phys. Rev. A, 1982, 25, 978–989 CrossRef CAS.
- E. G. Cox, Rev. Mod. Phys., 1958, 30, 159–162 CrossRef CAS.
- S. Watanabe, H. Sugiyama and M. Miyahara, Langmuir, 2008, 24, 802–809 CrossRef CAS.
- H. Kim, H. Chun, G.-H. Kim, H.-S. Lee and K. Kim, Chem. Commun., 2006, 2759–2761 RSC.
- J. Karger and H. Pfeifer, Zeolites, 1987, 7, 90–107 CrossRef.
- T. Nakagawa, S. Yamanaka, H. Urakawa, K. Kajiwara and S. Hayashi, THEOCHEM, 1999, 458, 275–283 CrossRef.
Footnote |
| † Electronic supplementary information (ESI) available: Temperature dependence of radial distribution function, maximum occupation of benzene, iso-density surface map and the diffusion pathway for loading of 13 and 63 molecules per unit cell, and the diffusion pathway of centre of mass for the benzene molecule during 10 ns. See DOI: 10.1039/c2cp42947k |
| This journal is © the Owner Societies 2013 |
