The pyrolysis chemistry of a β-O-4 type oligomeric lignin model compound
Sheng
Chu
,
Ayyagari V.
Subrahmanyam
and
George W.
Huber†
*
Department of Chemical Engineering, University of Massachusetts, Amherst, 686 North Pleasant Street, 159 Goessmann Lab, Amherst, MA 01003, USA. E-mail: huber@engr.wisc.edu; Tel: +1 608-283-0346
First published on 22nd October 2012
Abstract
The pyrolysis behavior of a β-O-4 type oligomeric lignin model compound is studied at a temperature range from 250 °C to 550 °C. Thermogravimetric analysis (TGA) indicates the model compound has three distinct thermal decompositions peaks when a slow temperature ramp is applied while only one decomposition peak is observed when a higher temperature ramp is used. The pyrolysis behavior of this model compound is similar to that of lignin prepared by enzymatic hydrolysis of Maplewood. 1H-NMR shows that the β-O-4 linkage thermally decomposes at a temperature between 250 °C and 350 °C with the formation of solid products at 350 °C. This solid product undergoes transformation to a polyaromatic from 350 °C to 550 °C. Around twenty five volatile compounds are quantified by pyroprobe-GC-MS with vanillin and 2-methoxy-4-methyl phenol being the most abundant monomeric products. A free radical reaction pathway is proposed to explain the product chemistry for pyrolysis of the lignin model compound. Char is most likely formed by random repolymerization of the radicals.
Introduction
The pyrolysis of biomass is receiving tremendous interest as a potential method for converting solid biomass into liquid transportation fuels.1–9 Lignocellulosic biomass is one of the most promising renewable resources because it is cheap and abundant.10–12 Lignin is the second most abundant component of biomass and occupies about 15%–30% in biomass by dry weight.13,14 Lignin is a three dimensional amorphous polymer containing methoxylated phenyl propane structure which is polymerized by monolignols (p-coumaryl, coniferyl and sinapyl alcohols).15 Over eight types of linkages have been identified in lignin structure.16 The β-O-4 bond is the major type of linkage which occupies 46%–60% of the total linkages depending on the type of wood.17Pyrolysis of lignin has been studied by a handful of people over the decades. In 1970s, Iatridis et al. pyrolyzed lignin in a “captive sample” reactor at temperature of 400 °C–700 °C and only identified a few compounds by gas chromatography including hydrocarbons, methanol, acetone, phenol and guaiacol due to the limited analytical technology.18 Recently, Guozhan Jiang et al. identified about 50 compounds from lignin pyrolysis at a temperature range of 400 °C–800 °C.19 The phenolic compounds yield was 17.2 wt% for Alcell lignin and individual yield of most of the compounds were less than 1 wt%. The thermal decomposition and weight loss of various lignin sources were studied by D. J. Nowakowski.20 He found the major decomposition of lignin occurred at a temperature range of 350 °C to 450 °C and that the heating rate affected the amount of volatile products. Most research on lignin pyrolysis has focused on the product identification. However, to further gain the insight into the behaviour of pyrolyzing lignin, it is imperative that we study its kinetic parameters. Unlike understanding the chemistry and kinetics of the pyrolysis of cellulose and hemicelluloses,21–28 the complexity of the lignin structure and its high molecular weight present make the study of lignin pyrolysis more complex. Lumped kinetic parameters and apparent activation energies for lignin pyrolysis have been estimated by others.9–31 However the detailed mechanism and kinetics are unknown.
Several so called “lignin model compounds” have been studied. These lignin model compounds have simple structures and product distributions compared to real lignin. Guaiacol is the simplest monomeric model compound and its pyrolysis behaviour was studied by Bredenberg in 1987. Catechol and phenol were the dominant products at 400 °C. A free radical reaction and a concerted reaction mechanism were suggested to explain guaiacol pyrolysis.32 Other substituted monomeric phenolic compounds such as syringol, isoeugenol, vanillin, anisole and dimethoxy-phenols were tested by Klein in 1981 to study the effects of functional groups on reactivity.33 A free radical mechanism has been proposed by Schlosberg34 and Masuku35 to explain the pyrolyzing monomeric lignin model compound. Since β-O-4 is the most common linkage existing in lignin, the pyrolysis behavior of β-O-4 type dimers has been widely studied. Britt et al.36 studied the fast vacuum pyrolysis of phenethyl phenyl ether (PPE) and proposed a complex reaction pathway which was dominated by free-radical reactions, molecular rearrangements, and concerted elimination reactions. A comprehensive computational study of PPE including oxygen–carbon bond dissociation enthalpies, phenyl-shift, hydrogen abstraction and substituent effects have been done by Beste et al.37–39 Kawamoto and co-workers have proposed that β-ether bond homolysis initiated the radical reaction. However, with different side chain or substituted groups, the mechanism may change.40 The products distribution of pyrolyzing dimer is more complex than that of monomers because secondary reactions occur.41 Recently, Jarvis et al. studied the pyrolysis of PPE in a wide temperature range of 300 °C to 1350 °C. They suggest that concerted reactions dominate over free radical reaction under typical pyrolytic condition.42 Clearly more research is needed to understand the complicated pyrolysis chemistry. Although pyrolysis of monomers and dimmers has provided us insight into the lignin pyrolysis chemistry, the polymeric linkages in lignin bring much complexity to pyrolysis chemistry. Oligomeric lignin model compounds are more similar to lignin than monomeric and dimeric model compounds. However, little research has been done on the pyrolysis of oligomeric lignin model compounds.43
The objective of this paper is to study the pyrolysis chemistry of an oligomeric lignin model compound that contains β-O-4 linkage by using both TGA and pyroprobe at a relative slow heating ramp. We propose a free radical pathway to explain the products we observe. This paper strives to provide a scientific basis to understand the chemistry of the pyrolysis of lignin.
Experimental
Oligomeric lignin model compound
The oligomeric lignin model compound was synthesized according to the method of Katahira et al.44 as shown in Fig. 1. The first step was synthesizing t-butoxycarbonlymethyl vanillin by reacting vanillin with t-butyl-2-bromoacetate and K2CO3/KI (Step 1 in Fig. 1). Polymerization of t-butoxycarbonlymethyl vanillin was conducted in the presence of lithium diisopropylamide solution by the nucleophilic addition of carbanion to an aldehyde group (Step 2 in Fig. 1). In the third step, the t-butyl group was reduced to a hydroxyl group by lithium aluminium hydride. The oligomeric lignin model compound synthesis was completed after acetylation.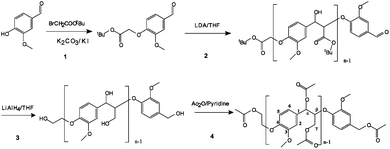 | ||
| Fig. 1 Synthesis of the oligomeric lignin model compound. | ||
Lignin residue from maple wood
Pyrolysis of lignin residue from maple wood was used to compare with lignin model compound. Maple wood was treated with hot water to extract hemicelluloses. Solid residues containing lignin and cellulose were separated by filtration. After washing several times, the solid was hydrolysed by enzymes (Spezyme and Novozyme) at pH 4.8 and 50 °C. Lignin residue was obtained after extracting cellulose. The detailed preparation method and analysis are described by Jae et al.14 The major impurities in the lignin residue sample were cellulose (11.6 wt%) and hemicellulose (3.3 wt%).Thermogravimetric analysis
Pyrolysis experiments were conducted using TA instruments SDT Q600 system attached to a quadrupole mass spectrometer (Extorr XT 300 with an electron ionization voltage at 27 eV). A flow rate of 100 ml min−1 high purity helium was used as carrier gas in the chamber to sweep gas and volatile products. The behavior of pyrolyzing lignin model compounds was tested using different temperature ramps. Before the temperature program started, samples were put into the alumina pan to dry for one hour at 110 °C in the TGA chamber. In order to analyze the solid char at different temperatures, the samples were heated at a temperature ramp of 150 °C min−1, the desired temperature was maintained for three minutes before cooling down to room temperature.Pyroprobe-GC-MS system
Pyrolysis experiments were also conducted in a model 2000 pyroprobe analytical pyrolizer (CDS Analytical Inc.). The pyroprobe was connected to a 5890 model GC attached to a Hewlett Packard model 5972A mass spectrometer to measure the product composition. A capillary column (Restek Rtx-5sil MS) was used with helium as the sweep gas to perform the separation.1H-NMR and 13C-NMR
Samples were dissolved in CDCl3 and scanned by nuclear magnetic resonance spectrometer (Bruker 400, AV400). 1H scan was carried out with a transmitter frequency at 400 MHz with a receiver gain at 362 and dwell time at 60 μs. 13C signal was collected at a frequency of 100 MHz with a receiver gain at 32![[thin space (1/6-em)]](https://www.rsc.org/images/entities/char_2009.gif) 768 and dwell time at 20 μs.
768 and dwell time at 20 μs.
Gel permeation chromatography
Gel permeation chromatography was used to measure the molecular weight distribution. Samples were dissolved in THF and injected into Shimadzu HPLC system (SIL-20ACHT Auto sampler, LC-20AD Solvent Delivery Module, DGU-20A5 Degasser, CTO-20A Column Oven, SPD-M20A UV-Vis detector) with mesopore column from Agilent at a flow rate of 0.5 ml min−1. Polystyrene was used as calibration standard and the signal wave length for UV-Vis was 254 nm.Fourier transform infrared spectroscopy (FTIR)
Bruker Equinox 55 infrared spectrometer was used to characterize the structure change of the solid products during the lignin model compound pyrolysis. The number of scans was set at 256 with a resolution of 4 cm−1 over the range 4000–400 cm−1. KBr was mixed with the model compound in the FTIR measurement to lower the viscosity, while solid char powder was measured without KBr.Total organic carbon analysis (TOC)
The carbon content of the solid products from pyrolysis was quantified using TOC analyzer. Solids were combusted at 900 °C in an oxygen stream in a Shimadzu Solid Sample Module SSM-5000 A. Carbon dioxide was quantified with a Shimadzu TOC-V CPH. Potassium hydrogen phthalate was used as calibration standard.Results and discussion
Characterization of oligomeric lignin model compound
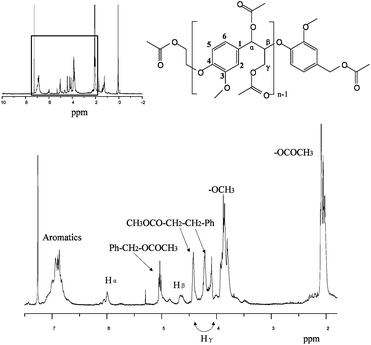
Fig. 2 shows the 1H-NMR spectrum of the lignin model compound. The acetyl group peak is at 2.0 ppm. The methoxyl group peak is around 3.8 ppm which shows the same chemical shift as in lignin.45 The peaks at 4.6 ppm and 6.0 ppm demonstrate the existence of Hβ and Hα, which proves the presence of β-O-4 linkage in the model compound. The chemical shift of side chain protons are seen from 4.0 ppm to 5.0 ppm and aromatic peaks seen around 7.0 ppm.The peak of each carbon from 13C-NMR in lignin model compound is labeled in Fig. 3. The peaks at 80 ppm and 74 ppm indicate a β-O-4 structure in the compound. All the peaks have the same chemical shift as the work of Katahira et al. with the exception of an extra peak at 1.3 ppm44 in Fig. 2 indicative of tert-butyl group which was not reduced to a hydroxyl group probably due to steric hindrance effects.
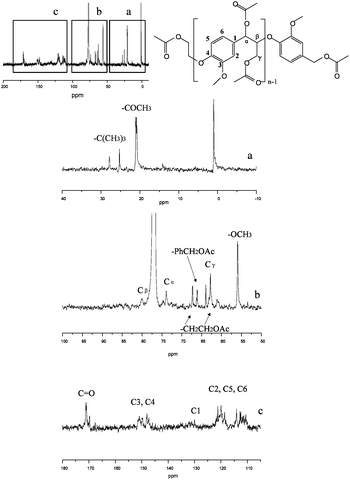 | ||
| Fig. 3 13C-NMR of lignin model compound. | ||
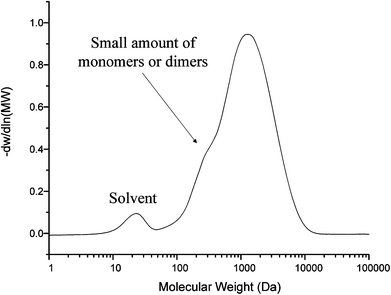
Fig. 4 shows the GPC data of the lignin model compound. The peak has a molecular weight range from 200 Da to 10![[thin space (1/6-em)]](https://www.rsc.org/images/entities/char_2009.gif) 000 Da. The average number molecular weight (Mn) is 1264 Da and the average weight molecular weight (Mw) is 1755 Da. The polydispersity is 1.38 and the degree of polymerization is 4.51. The lignin model compound has a lower molecular weight than pyrolytic lignin produced by D. Meier et al. from pyrolysis of beech wood which ranges from 162 to 50
000 Da. The average number molecular weight (Mn) is 1264 Da and the average weight molecular weight (Mw) is 1755 Da. The polydispersity is 1.38 and the degree of polymerization is 4.51. The lignin model compound has a lower molecular weight than pyrolytic lignin produced by D. Meier et al. from pyrolysis of beech wood which ranges from 162 to 50![[thin space (1/6-em)]](https://www.rsc.org/images/entities/char_2009.gif) 000 Da.45 From our previous study, the soluble part of lignin residue from Maplewood has a similar molecular weight to the lignin model compound.46 There is a small peak from 200 to 300 Da which indicates that a small part of the vanillin-based monomer did not polymerize correctly.
000 Da.45 From our previous study, the soluble part of lignin residue from Maplewood has a similar molecular weight to the lignin model compound.46 There is a small peak from 200 to 300 Da which indicates that a small part of the vanillin-based monomer did not polymerize correctly.
Thermogravimetric analysis
The lignin model compound and the lignin residues from enzymatic hydrolysis of maple wood were pyrolyzed in a TGA at various heating ramps as shown in Fig. 5. The pyrolysis of the lignin residue has previously been characterized in detail by Cho et al.46 At a temperature ramp of 1 °C min−1 both the lignin model compound and the lignin residue show several decomposition peaks (Fig. 5(a) and (b)). The lignin model compound decomposes at a lower temperature than the lignin residue. Three major weight losses for the lignin model compound are at temperatures of 190 °C, 260 °C and 550 °C whereas lignin residue has two major weight losses at peaks of 260 °C and 470 °C, respectively. However, the peak at 260 °C from lignin residue is believed to be the decomposition of impurities (cellulose and hemicelluloses).At the temperature ramp of 15 °C min−1, the weight loss peaks shift to higher temperature (Fig. 5(c) and (d)).The lignin model compound starts to decompose at 230 °C followed by the decomposition at 300 °C and 650 °C. The lignin residue only has one major weight loss peak at 320 °C and a very slow decomposition above 400 °C. In the case of a higher temperature ramp (150 °C min−1), the major decomposition peak for the lignin model compound shifts to 350 °C–380 °C with a shoulder around 300 °C (Fig. 5(e) and (f)). The major weight loss for the lignin residue is around 400 °C. Compared with lignin residue, the lignin model compound decomposes at a lower temperature and faster than lignin residue (Fig. 5(a), (c) and (e)). Less char forms in the pyrolysis of the model compound than the actual lignin residue. This is due the relatively simpler structure and smaller molecular weight of the model compound. However, the lignin model compound displays similar pyrolysis behavior to that of the lignin residue (Fig. 5(d) and (f)) with the major decomposition occurring in the same temperature region when applying a temperature ramp of 150 °C min−1.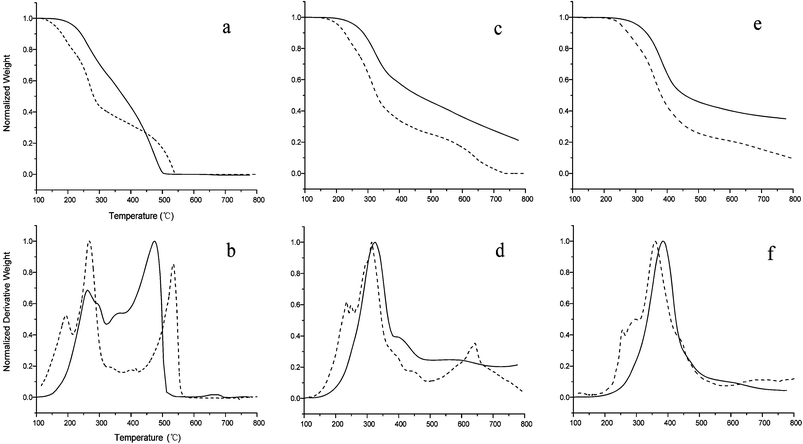 | ||
| Fig. 5 Thermogravimetric (a, c and e) and differential thermal (b, d, and f) curves for the pyrolysis of lignin model compound (dash line) and lignin residue after enzymatic hydrolysis (solid line) at temperature ramps of 1 (a and b) 15 (c and d) and 150 °C min−1 (e and f). | ||
The temperature programming in the TGA was set to four different final temperatures (250 °C, 350 °C, 450 °C and 550 °C) with a temperature ramp of 150 °C min−1, after which the final temperature was maintained for three minutes followed by cooling down to room temperature. All the products in TGA alumina pan were transferred into an organic solvent such as THF or chloroform for separation and analysis. The products which can be extracted by the organic solvent are hereby referred to as soluble products. The soluble products were analyzed by GPC and 1H-NMR. A black solid was left after organic solvent extraction and we claim it to be solid char. All pyrolysis products at a final temperature of 250 °C were completely soluble in the organic solvent. Char formation was first observed at the temperature of 350 °C. The products obtained from 450 °C and 550 °C were not soluble in organic solvents.
Fig. 6 shows the GPC results for the soluble products. The black line is the unpyrolyzed model compound. The peak around 200 Da to 300 Da in the model compound disappears in the products produced at 250 °C and 350 °C. This indicates unpolymerized monomers are volatile below 250 °C. Based on this observation, we can conclude that the peaks at 190 °C, 230 °C and 300 °C in Fig. 5(b), (d) and (f) respectively are caused by the volatilization of monomers. Since all the products produced from 250 °C were soluble in organic solvent, this indicates the lignin oligomeric compound does not decompose under 250 °C.
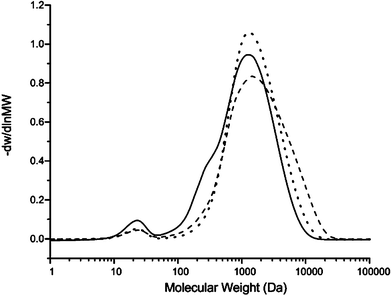 | ||
| Fig. 6 GPC data of lignin model compound (solid) and samples taken at different temperatures in TGA at a temperature ramp of 150 °C min−1: 250 °C (dash), 350 °C (dot). | ||
The soluble products produced at 250 °C and 350 °C were dissolved in d-chloroform and analyzed by 1H-NMR as shown in Fig. 7. The original lignin model compound and the soluble products obtained at 250 °C have a very similar structure based on the 1H-NMR spectra. The peak of Hβ at 4.6 ppm and Hα at 6 ppm are still observed. This indicates the existence of Cα–Cβ bond and β-O-4 linkage in the products formed at 250 °C. These results are in an agreement with GPC results which confirm the lignin model compound does not decompose below 250 °C. The changes at lower chemical shifts can be explained by the reaction of unreduced tert-butyl group or monomeric volatilization. The spectrum of sample obtained at 350 °C is shown in Fig. 7(c). We do not observe the peak at 4.6 ppm or 6.0 ppm which means β-O-4 linkage was cleaved and lignin model compound begins to decompose before 350 °C. This is consistent with the major weight loss observed in thermal curve at 350 °C (Fig. 5(f)), which is the major reaction stage after the monomer volatilization. Since the breaking of β-O-4 linkage occurs between 250 °C and 350 °C, we can surmise that the structure of the lignin model compound changes as well in this temperature range. However we observe the products at 350 °C have similar molecular weight distribution as both the products at 250 °C and the lignin model compound as shown in Fig. 6. This indicates the repolymerization of the small species which are formed via bond cleavage. The soluble products at 350 °C still contains aromatic based structure containing the methoxyl group (3.8 ppm) and aliphatic side chains.
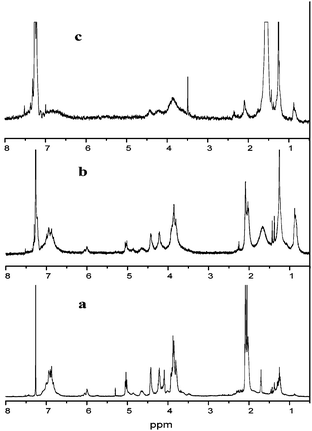 | ||
| Fig. 7 1H NMR data of lignin model compound (a) and samples pyrolyzed at different temperatures: 250 °C (b), 350 °C (c). | ||
Solid products were taken from the 350 °C to 550 °C reactions and analyzed by FTIR. The results are shown in Fig. 8. Table 1 shows the characterization of peaks in the spectrum. The band at 3471 cm−1 represents the –OH stretch and it decreases in size from 350 °C to 550 °C (Fig. 8(b)–(d)). However, a small proportion of this band still exists in the sample collected at higher temperature suggesting it still contains hydroxyl groups in the product structure. The bands of –CH stretch in aliphatic chain and methoxyl group are at 2940 cm−1 and 2840 cm−1, respectively. These bonds also decrease with increasing temperature. A small amount of aliphatic stretching exists in the sample collected at higher temperature. The carbonyl group in the lignin model compound shows at the band of 1740 cm−1. This peak decreases and almost disappears in the sample pyrolyzed at higher temperature. The aromatic ring vibration bands appear at a range from 1400 cm−1 to 1600 cm−1. In the lignin model compound (Fig. 8(a)), the aromatic ring vibration peaks are separate. However, the peaks merge to a broad band in the sample collected at higher temperature which implies that a polyaromatic structure forms. The typical guaiacol band appears at 1226 cm−1. This peak is in the original compound but disappears in the solid products. The deformation of C–H bond in aromatic ring is at 1032 cm−1. This band also disappears when the pyrolysis temperature is above 350 °C. This indicates the formation of a nonproton polyaromatic ring. It is noticed that obvious changes happen to the solid structure from 350 °C to 450 °C which indicates the major reaction happens in this temperature range, which corresponds to the huge weight loss in Fig. 5(f). From the previous work of lignin pyrolysis, a polycyclic aromatic hydrocarbon structure has been identified to form at higher temperature.47 It is clearly observed that even with a simple lignin model compound with a single type of linkage, we observe similar char formation as has been observed in pyrolyzing lignin.
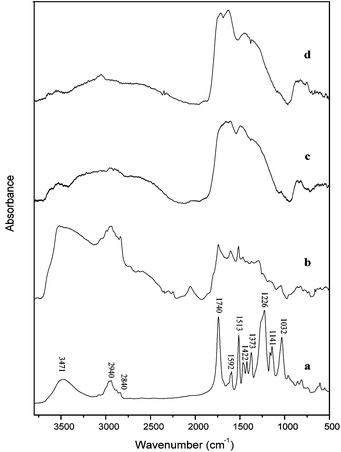 | ||
| Fig. 8 FTIR spectrum of (a) lignin model compound and solid residue obtained from the temperature of (b) 350 °C, (c) 450 °C and (d) 550 °C. | ||
| Wave number (cm−1) | Characteristics |
|---|---|
| 3471 | OH group |
| 2940 | CH (aliphatic and aromatic) |
| 2840 | CH (methoxy group) |
| 1740 | C![[double bond, length as m-dash]](https://www.rsc.org/images/entities/char_e001.gif) O group O group |
| 1592 | Aromatic ring vibration |
| 1513 | Aromatic ring vibration |
| 1422 | C–H deformation and aromatic ring vibrations |
| 1373 | OH in-plane bending and CH bending |
| 1226 | Guaiacol unit (G ring and C![[double bond, length as m-dash]](https://www.rsc.org/images/entities/char_e001.gif) O vibrations) O vibrations) |
| 1141 | Guaiacol unit (CH in-plane deformation) |
| 1032 | Aromatic C–H deformation and C–O, C–C stretching |
The gas phase species produced from pyrolysis in the TGA were measured with mass spectroscopy. The major species observed were water (MW = 18), carbon monoxide (MW = 28) and carbon dioxide (MW = 44). Fig. 9 shows these products as a function of reaction temperature at a temperature ramp of 15 °C min−1. Water is produced primarily at a temperature range of 350 °C–400 °C. This corresponds with the –OH peak decreasing in solid char (Fig. 8 from b to c). A small amounts of water is also produced at higher temperature. A large amount of carbon dioxide is observed at temperatures from 600 °C to 800 °C. The mass charge ratio of 28 represents carbon monoxide and it increases with temperature until it reaches a plateau. This is probably caused by char reduction and water gas shift reaction described by Suyitno.48 However, we cannot detect other species in our system due to the low concentration of products.
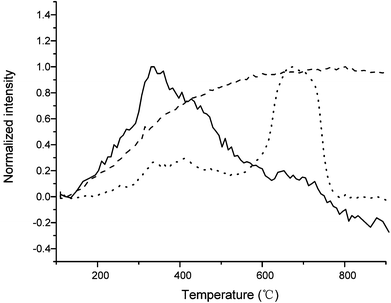 | ||
| Fig. 9 Pyrolysis of lignin model compound at temperature ramp of 15 °C min−1 by TGA. Mass spectroscopy recorded several mass to charge ratios during the reaction as shown 18 (solid), 28 (dash) and 44 (dot), respectively. | ||
Pyroprobe-GC-MS analysis
Detailed product distributions for pyrolysis of the lignin model compound were collected by pyroprobe-GC-MS system. Table 2 shows the mass balance of pyrolyzing lignin model compounds at a temperature ramp of 150 °C min−1. A fast temperature ramp of 1000 °C s−1 was also applied for comparison. We report our products in four different categories: gas, liquid, solid and unidentified. Gas mainly consists of carbon monoxide and carbon dioxide. Liquid products are quantified by all the species detected by GC-MS except gas products. These liquid compounds are mainly mono aromatics. After each reaction we collected the solid in the reactor tube. The mass of the solid was found with a balance and the carbon content was analyzed by TOC. We also report the unidentified products, which are most likely heavier molecular weight compounds that cannot be detected by GC-MS. Only 0.1 wt% to 4.3 wt% gas was observed with carbon dioxide being the major gas product. As the temperature increases, the ratio of carbon monoxide to carbon dioxide decreases. The yield of liquid product reaches a maximum (about 60 wt%) at 550 °C. The oligomeric lignin model compound produces more liquid products than lignin19 due to its simpler structure, lower heat resistance and higher reactivity. The amount of char formation decreases at the higher temperature. At the highest temperature, it has 30 wt% char formation. In the previous TGA results, we observe around 30 wt% and 20 wt% char formation at 450 °C and 550 °C, respectively (Fig. 5(e)). However, in the pyroprobe the char yield is 50 wt% and 30 wt% at the corresponding temperatures. The pyroprobe has slower rates of mass transfer than the TGA because the carrier gas does not flow through the pyrolysis tube. This most likely increases the rate of secondary reactions that form coke compared to the TGA. The fast heating rate experiment is labelled with asterisk in Table 2. The gas and liquid products decrease at the faster heating rate with an increase in the solid char formation and the unidentified products.| Temperature (°C) | Gas | Liquid | Solid | Unidentified |
|---|---|---|---|---|
| a Parenthesis designates weight ratio of carbon monoxide to carbon dioxide. b Designates heating rate of 1000 °C s−1. | ||||
| 250 | 0.10% (1![[thin space (1/6-em)]](https://www.rsc.org/images/entities/char_2009.gif) : :![[thin space (1/6-em)]](https://www.rsc.org/images/entities/char_2009.gif) 4.8)a 4.8)a |
11.80% | 74.10% | 14.00% |
| 350 | 2.20% (1![[thin space (1/6-em)]](https://www.rsc.org/images/entities/char_2009.gif) : :![[thin space (1/6-em)]](https://www.rsc.org/images/entities/char_2009.gif) 5.1) 5.1) |
20.40% | 66.30% | 11.10% |
| 450 | 3.40% (1![[thin space (1/6-em)]](https://www.rsc.org/images/entities/char_2009.gif) : :![[thin space (1/6-em)]](https://www.rsc.org/images/entities/char_2009.gif) 5.4) 5.4) |
40.40% | 50.30% | 5.90% |
| 550 | 4.30% (1![[thin space (1/6-em)]](https://www.rsc.org/images/entities/char_2009.gif) : :![[thin space (1/6-em)]](https://www.rsc.org/images/entities/char_2009.gif) 8.9) 8.9) |
59.70% | 28.30% | 7.70% |
| 550b | 2.90% (1![[thin space (1/6-em)]](https://www.rsc.org/images/entities/char_2009.gif) : :![[thin space (1/6-em)]](https://www.rsc.org/images/entities/char_2009.gif) 3.1) 3.1) |
48.30% | 32.40% | 16.40% |
Table 3 shows the carbon balance for pyrolysis in the pyroprobe. The solid product contains 30% to 75% of the carbon from the lignin model compound. The gas products have less than 2% of total carbon content. The carbon in liquid products increases from 9% at lower temperature to 46% at higher temperature. When applying the fast pyrolysis at 550 °C, the carbon content in the liquid decreases while the carbon content in the unidentified products increases. The lignin model compound has a similar weight and carbon distribution as lignin produced from maple wood by hydrolysis.46 However, lignin residue has more char formation.
| Temperature (°C) | Gas | Liquid | Solid | Unidentified |
|---|---|---|---|---|
| a Parenthesis designates weight ratio of carbon monoxide to carbon dioxide. b Designates heating rate of 1000 °C s−1. | ||||
| 250 | 0.42% (25%![[thin space (1/6-em)]](https://www.rsc.org/images/entities/char_2009.gif) : :![[thin space (1/6-em)]](https://www.rsc.org/images/entities/char_2009.gif) 75%)a 75%)a |
8.91% | 86.19% | 4.48% |
| 350 | 1.00% (23%![[thin space (1/6-em)]](https://www.rsc.org/images/entities/char_2009.gif) : :![[thin space (1/6-em)]](https://www.rsc.org/images/entities/char_2009.gif) 77%) 77%) |
16.06% | 71.13% | 11.81% |
| 450 | 1.49% (22%![[thin space (1/6-em)]](https://www.rsc.org/images/entities/char_2009.gif) : :![[thin space (1/6-em)]](https://www.rsc.org/images/entities/char_2009.gif) 78%) 78%) |
31.97% | 64.75% | 1.79% |
| 550 | 1.85% (15%![[thin space (1/6-em)]](https://www.rsc.org/images/entities/char_2009.gif) : :![[thin space (1/6-em)]](https://www.rsc.org/images/entities/char_2009.gif) 85%) 85%) |
46.34% | 48.93% | 2.88% |
| 550b | 1.28% (34%![[thin space (1/6-em)]](https://www.rsc.org/images/entities/char_2009.gif) : :![[thin space (1/6-em)]](https://www.rsc.org/images/entities/char_2009.gif) 66%) 66%) |
32.97% | 51.82% | 13.93% |
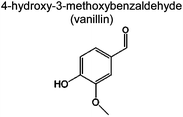
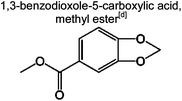
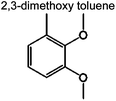
Table 4 shows the carbon selectivity of the liquid products detected by Pyroprobe-GC-MS under different temperatures at a temperature ramp of 150 °C min−1. We were able to detect more than 25 distinct peaks in the GC-MS. As shown in Table 4, most detectable liquid products are mono aromatics with different functional groups and side chains. These compounds are listed by their abundance. Acetic acid is the most abundant product being produced from the acetyl group. The most abundant monomeric aromatic is vanillin, which is the monomer used to produce the model compound. Some of the compounds in Table 4 had a low similarity with the GC-MS library indicating that there are some uncertainties in whether or not we correctly identified these compounds. The products from the pyrolysis at the fast temperature ramp have also been analyzed. The carbon selectivity of acetic acid and 1,4-butanediol diacetate decreases with an increased temperature ramp. In contrast, the carbon selectivity of the heavier aromatics increases at the faster temperature ramp. This indicates that in the fast pyrolysis, the carbon tends to remain in heavier species such as char, which is also reflected in the weight and carbon increase in the Tables 2 and 3 for the experiment at 1000 °C s−1.
| Compound | 250 °C | 350 °C | 450 °C | 550 °C | 550 °Ca | S b | F c |
|---|---|---|---|---|---|---|---|
| a Designating temperature ramp is 1000 °C s−1. b S designates similarity search from MS library. c F designates the bond cleavage or reaction number this compound comes from in Fig. 10. d Designating mass spectrometry has low identity on this compound and we may not observe. | |||||||

|
42.6% | 32.2% | 34.5% | 22.1% | 16.3% | 91 | 1,3 |

|
8.3% | 21.7% | 12.2% | 7.8% | 9.1% | 90 | (a) |
|
21.8% | 8.3% | 9.1% | 7.6% | 8.2% | 97 | 1,4 |

|
5.7% | 0.9% | 3.0% | 7.1% | 6.7% | 96 | 1,3 |

|
6.1% | 2.5% | 7.5% | 7.2% | 8.6% | 72 | |

|
0.8% | 3.3% | 2.6% | 6.7% | 8.1% | 40 | |
|
0.7% | 3.8% | 3.1% | 6.3% | 4.7% | 59 | |
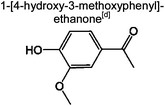
|
2.1% | 8.2% | 4.9% | 4.9% | 6.0% | 58 | |

|
4.3% | 2.5% | 3.4% | 1.9% | 0 | 35 | |

|
4.7% | 7.5% | 5.8% | 2.1% | 3.3% | 14 | |
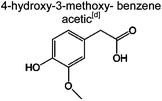
|
1.6% | 1.2% | 2.4% | 2.4% | 2.7% | 50 | |
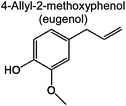
|
1.0% | 1.8% | 1.0% | 1.4% | 3.2% | 97 | (d) |

|
0 | 1.7% | 4.5% | 3.8% | 4.4% | 95 | (c) |

|
0 | 0.8% | 2.4% | 0.4% | 0.6% | 86 | |

|
0 | 1.5% | 0.4% | 0.2% | 0.06% | 94 | |

|
0 | 0.7% | 0.7% | 0.8% | 0.8% | 50 | |

|
0 | 0.2% | 0.6% | 0.7% | 0.5% | 83 | (b) |

|
0 | 0.9% | 0 | 5.9% | 5.0% | 83 | |
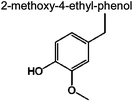
|
0 | 0.1% | 0 | 4.6% | 4.2% | 91 | |

|
0 | 0 | 1.7% | 0.07% | 0.23% | 81 | |

|
0 | 0 | 0 | 4.9% | 5.7% | 95 | 1,2 |
|
0 | 0 | 0 | 0.7% | 0.6% | 91 | |

|
0 | 0 | 0 | 0.4% | 1.1% | 59 | 1,6,7 |
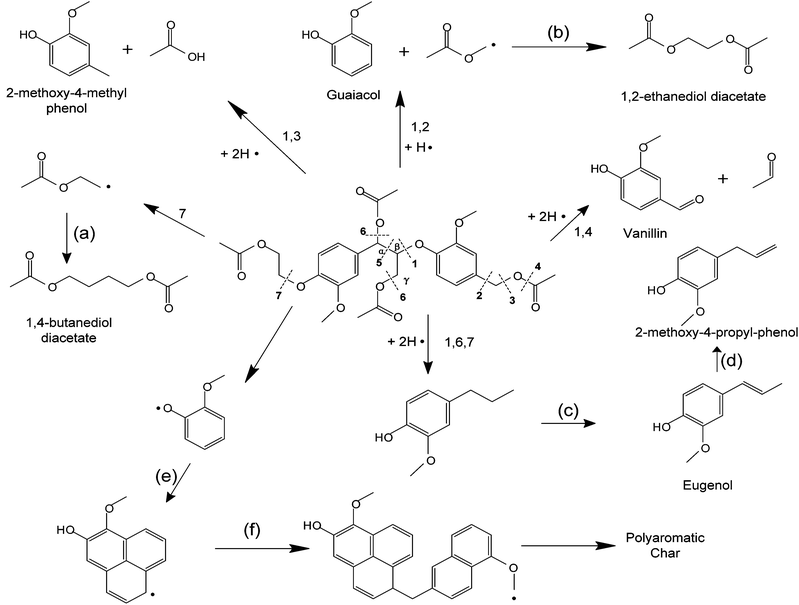
Compared with dimeric model compound, the reaction network of pyrolyzing oligomeric model compounds is much more complicated. Free radical with concerted reactions have been proposed in PPE. However, in the presence of oligomeric structure and acetyl groups, there can be various possibilities for the reaction pathways. We propose a free radical reaction dominant pathway (Fig. 10) based on the major products observed in Table 4. Previous studies have indicated that the β-O-4 bond cleavage happens at relatively low temperature because of its low dissociation energy.37,49 This is in agreement with our FTIR and NMR results discussed above. Radicals are generated after Cβ–O homolysis cleavage. This is believed to be the initiation step for free radical chain reaction.50 In Fig. 10, β-O-4 linkage breaks (cleavage 1 in Fig. 10) between the temperature 250 °C and 350 °C in our experiment. The radicals can abstract the proton from other species which have weak C–H or O–H bonding (such as C6H5–OH) and form products. Vanillin and 2-methoxy-4-methyl phenol being the two most abundant monomeric aromatic products are produced by β-O-4 bond cleavages and H-abstraction. This indicates the bond cleavage tend to happen at 1, 3 and 4 positions in Fig. 10. The radicals are passed to other species for further reaction leading to chain propagation. We observe large amount of acetic acid and 1,4-butanediol diacetate formation. This implies the C–O bond at 4 and 7 positions can easily break. When two radicals collide with each other, they form products and terminate the chain reaction such as Reaction (a) and (b) in Fig. 10. Some products in Table 4 were not identified with a high similarity by GC-MS. These compounds are not shown in Fig. 10. Secondary reactions can also happen. H-abstraction, double bond formation, rearrangement, isomerization and concerted reaction would diversify the products distribution41 such as reaction (c) and (d) in Fig. 10. From the mass and carbon balance in Tables 2 and 3, we observe that the solid products contain about 50% of carbon content in original lignin model compound. This is a similar result to what we have observed in our previous study on pyrolysis of a lignin residue.46 Even though we used relatively simple structure model compound in this work compared with lignin residue, char formation is still a dominant process. Char most likely forms from polymerization of smaller radical species such as aromatics, alkanes and alkenes (reaction (e) in Fig. 10). The reaction propagates with more radicals causing further polymerization (reaction (f) in Fig. 10). Polyaromatic char finally forms after the elimination of functional groups such as hydroxyl and methoxyl groups.
It would be desirable to inhibit radicals chain propagation reactions and prevent repolymerization during lignin pyrolysis to decrease the char formation and increase the bio-oil production. This could be done by one of two methods: (1) by converting the lignin products before they undergo free radical reactions or (2) by the addition of free radical inhibitors. From the proposed reaction chemistry, a hydrogen donor would be effective to stop the chain reaction after the initial bond break. Both intermolecular and intramolecular H-abstraction can achieve this. The weak C–H or O–H bond such as aldehyde and phenol could be taken into consideration to provide the proton. Other free radical inhibitors including nitrobenzene, butylated hydroxyl toluene or diphenyl picryl hydrazyl have shown the ability to stabilize the resonance of the radicals. A persistent radical would be another alternative. When the monomer lacks protons, it can easily abstract them from persistent radical to terminate the reaction. However, these compounds could introduce unwanted elements into the pyrolysis process. Moreover, the free radical inhibitors need to be in intimate contact with the lignin and not degrade at the temperatures of the lignin pyrolysis. More work is needed before lignin can effectively be decomposed into fungible fuels and chemicals.
Conclusion
An oligomeric lignin model compound, which only contains β-O-4 linkages, was synthesized using t-butoxycarbonlymethyl vanillin as the polymerization monomer. The average molecular weight is around 1250 Da. The oligomeric lignin model compound shows similar thermal decomposing temperatures as the lignin residue derived from maple wood. The lignin model compound decomposes around 300 °C and 380 °C at temperature ramps of 15 °C min−1 and 150 °C min−1, respectively. 1H-NMR is applied to trace the structure changes of soluble part of pyrolyzed products. β-O-4 linkage is thermally cleaved at the temperature between 250 °C and 350 °C. A solid product is observed at the temperature of 350 °C. At higher temperatures, polyaromatic char forms. The major product from pyrolysis of this lignin model compound is solid char which accounts for 50–70% of the carbon. Volatile monomeric aromatic compounds are quantified by GC-MS and vanillin is the most abundant product. A free radical dominant reaction pathway is proposed to explain the products formation. Various products are formed by bond cleavages and secondary reactions. Randomly repolymerized radicals are believed to cause char formation.Acknowledgements
This work was supported by the Defense Advanced Research Projects Agency (DARPA) and Army Research Lab (ARL) through the Defense Science Office Cooperative Agreement W911NF-09-2-0010/09-005334 B 01 (Surf-Cat: Catalysts for production of JP-8 range molecules from lignocellulosic biomass). We thank Prof. Paul Dauenhauer from University of Massachusetts Amherst for his helpful discussion with this paper. We want to thank Prof. Charles Wyman's group in UC-Riverside for preparing and providing lignin residue sample. We also would like to thank Prof. Richard Finke from Colorado State University for his insight into the free radical chemistry.Notes and references
- G. W. Huber, S. Iborra and A. Corma, Chem. Rev., 2006, 106, 4044–4098 CrossRef CAS.
- T. R. Carlson, T. P. Vispute and G. W. Huber, ChemSusChem, 2008, 1, 397–400 CrossRef CAS.
- D. Vamvuka, Int. J. Energy Res., 2011, 35, 835–862 Search PubMed.
- E.-b. Hassan, P. Steele and L. Ingram, Appl. Biochem. Biotechnol., 2009, 154, 3–13 Search PubMed.
- D. A. Laird, R. C. Brown, J. E. Amonette and J. Lehmann, Biofuels Bioprod. Bioref., 2009, 3, 547–562 Search PubMed.
- S. B. P. Badger, M. Puettmann, P. Steele and J. Cooper, Bioresources, 2011, 6, 34–47 Search PubMed.
- P. Bhattacharya, P. H. Steele, E. B. M. Hassan, B. Mitchell, L. Ingram and C. U. Pittman Jr, Fuel, 2009, 88, 1251–1260 Search PubMed.
- K. Papadikis, S. Gu and A. V. Bridgwater, Chem. Eng. J, 2009, 149, 417–427 Search PubMed.
- T. P. Vispute, H. Zhang, A. Sanna, R. Xiao and G. W. Huber, Science, 2010, 330, 1222–1227 CrossRef CAS.
- A. Demirbas, Energy Convers. Manage., 2001, 42, 1357–1378 CrossRef CAS.
- A. J. Ragauskas, C. K. Williams, B. H. Davison, G. Britovsek, J. Cairney, C. A. Eckert, W. J. Frederick, J. P. Hallett, D. J. Leak, C. L. Liotta, J. R. Mielenz, R. Murphy, R. Templer and T. Tschaplinski, Science, 2006, 311, 484–489 CrossRef.
- K. R. Brower, Science, 2006, 312, 1744–1745 CrossRef CAS.
- R. D. Perlack, L. L. Wright, A. F. Turhollow, R. L. Graham, B. J. Stokes, D. C. Erbach, Tech. Rep., Oak Ridge National Laboratory, 2005, DOE/ GO-102005-2135 Search PubMed.
- J. Jae, G. A. Tompsett, Y.-C. Lin, T. R. Carlson, J. Shen, T. Zhang, B. Yang, C. E. Wyman, W. C. Conner and G. W. Huber, Energy Environ. Sci., 2010, 3, 358–365 RSC.
- J. Ralph, K. Lundquist, G. Brunow, F. Lu, H. Kim, P. F. Schatz, J. M. Marita, R. D. Hatfield, S. A. Ralph, J. H. Christensen and W. Boerjan, Phytochem. Rev., 2004, 3, 29–60 CrossRef CAS.
- F. S. Chakar and A. J. Ragauskas, Ind. Crop. Prod., 2004, 20, 131–141 CrossRef CAS.
- E. Dorrestijn, L. J. J. Laarhoven, I. W. C. E. Arends and P. Mulder, J. Anal. Appl. Pyrolysis, 2000, 54, 153–192 CrossRef CAS.
- B. Iatridis and G. R. Garalas, Ind. Eng. Chem. Proc. Des. Dev., 1979, 18, 127–130 Search PubMed.
- G. Jiang, D. J. Nowakowski and A. V. Bridgwater, Energy Fuels, 2010, 24, 4470–4475 CrossRef CAS.
- D. J. Nowakowski, A. V. Bridgwater, D. C. Elliott, D. Meier and P. de Wild, J. Anal. Appl. Pyrolysis, 2010, 88, 53–72 CrossRef CAS.
- J. C. Serrano-Ruiz, D. J. Braden, R. M. West and J. A. Dumesic, Appl. Catal., B, 2010, 100, 184–189 CrossRef CAS.
- R. Weingarten, G. A. Tompsett, W. C. Conner Jr and G. W. Huber, J. Catal., 2011, 279, 174–182 CrossRef CAS.
- P. R. Patwardhan, R. C. Brown and B. H. Shanks, ChemSusChem, 2011, 4, 636–643 Search PubMed.
- P. R. Patwardhan, D. L. Dalluge, B. H. Shanks and R. C. Brown, Bioresour. Technol., 2011, 102, 5265–5269 CrossRef CAS.
- J. Cho, J. M. Davis and G. W. Huber, ChemSusChem, 2010, 3, 1162–1165 CrossRef CAS.
- M. J. Antal Jr. and G. Varhegyi, Ind. Eng. Chem. Res., 1995, 34, 703–717 CrossRef CAS.
- M. J. Antal, W. S. L. Mok, J. C. Roy, A. T. Raissi and D. G. M. Anderson, J. Anal. Appl. Pyrolysis, 1985, 8, 291 CrossRef CAS.
- S. Sitthisa and D. Resasco, Catal. Lett., 2011, 141, 784–791 CrossRef CAS.
- G. Jiang, D. J. Nowakowski and A. V. Bridgwater, Thermochim. Acta, 2010, 498, 61–66 CrossRef CAS.
- D. Ferdous, A. K. Dalai, S. K. Bej and R. W. Thring, Energy Fuels, 2002, 16, 1405–1412 CrossRef CAS.
- E. Avni and R. W. Coughlin, Thermochim. Acta, 1985, 90, 157–167 CrossRef CAS.
- A. I. Vuori and J. B. s. Bredenberg, Ind. Eng. Chem. Res., 1987, 26, 359–365 CrossRef CAS.
- M. T. Klein, PhD thesis, Department of Chemical Engineering, Massachusetts Institute of Technology, 1981.
- R. H. Schlosberg, P. F. Szajowski, G. D. Dupre, J. A. Danik, A. Kurs, T. R. Ashe and W. N. Olmstead, Fuel, 1983, 62, 690–694 Search PubMed.
- C. P. Masuku, Holzforschung, 1991, 45, 181–190 Search PubMed.
- P. F. Britt, A. C. Buchanan, M. J. Cooney and D. R. Martineau, J. Org. Chem., 2000, 65, 1376–1389 CrossRef CAS.
- A. Beste and A. C. Buchanan, J. Org. Chem., 2009, 74, 2837–2841 CrossRef CAS.
- A. Beste and A. C. Buchanan, Energy Fuels, 2010, 24, 2857–2867 Search PubMed.
- A. Beste and A. C. Buchanan, J. Org. Chem., 2011, 76, 2195–2203 Search PubMed.
- H. Kawamoto, M. Ryoritani and S. Saka, J. Anal. Appl. Pyrolysis, 2008, 81, 88–94 CrossRef CAS.
- T. Hosoya, H. Kawamoto and S. Saka, J. Anal. Appl. Pyrolysis, 2008, 83, 78–87 Search PubMed.
- M. W. Jarvis, J. W. Daily, H.-H. Carstensen, A. M. Dean, S. Sharma, D. C. Dayton, D. J. Robichaud and M. R. Nimlos, J. Phys. Chem. A, 2011, 115, 428–438 Search PubMed.
- J.-Y. Liu, S.-B. Wu and R. Lou, BioResources, 2011, 6(2), 1079–1093 Search PubMed.
- R. Katahira, H. Kamitakahara, T. Takano and F. Nakatsubo, J. Wood Sci., 2006, 52, 255–260 Search PubMed.
- R. Bayerbach, V. D. Nguyen, U. Schurr and D. Meier, J. Anal. Appl. Pyrolysis, 2006, 77, 95–101 CrossRef CAS.
- J. Cho, S. Chu, P. J. Dauenhauer and G. W. Huber, Green Chem., 2012, 14, 428–439 RSC.
- R. K. Sharma, J. B. Wooten, V. L. Baliga, X. Lin, W. Geoffrey Chan and M. R. Hajaligol, Fuel, 2004, 83, 1469–1482 CrossRef CAS.
- T. Suyitno and B. Suhendra, Int. J. Eng. Technol., 2011, 11, 94–101 Search PubMed.
- T. Elder, Holzforschung, 2010, 64, 435 Search PubMed (436).
- M. T. Klein and P. S. Virk, Ind. Eng. Chem. Fundam., 1983, 22, 33–45 Search PubMed.
Footnote |
| † Current address of G. W. Huber, University of Wisconsin-Madison, Chemical and Biological Engineering, 1415 Engineering Hall, Madison, WI 53706. Email: E-mail: huber@engr.wisc.edu; Tel: +1 608-283-0346. |
| This journal is © The Royal Society of Chemistry 2013 |

