Critical evaluation of quantitative methods for the multi-elemental analysis of ancient glasses using laser ablation inductively coupled plasma mass spectrometry†
Martina
Bertini
*a,
Andrei
Izmer
b,
Frank
Vanhaecke
b and
Eva M.
Krupp
ac
aDepartment of Chemistry, University of Aberdeen, Meston Walk, AB24 3UE Aberdeen, UK
bDepartment of Analytical Chemistry, Ghent University, Krijgslaan 281 – S12, B-9000 Ghent, Belgium
cAberdeen Centre for Environmental Sustainability, University of Aberdeen, 23 St Machar Drive, AB24 3UU Aberdeen, UK
First published on 10th October 2012
Abstract
Compositional analyses of ancient glasses have the potential to unravel their provenance and identify the raw materials employed in their manufacture. During the last few years, the analysis of archaeological glasses has increasingly benefited from the introduction and further development of micro-destructive techniques with trace element capability, such as laser ablation-inductively coupled plasma-mass spectrometry. However, while a variety of analytical standards can be employed for quantitative analyses of modern glass, the lack of dedicated certified reference materials represents a major obstacle in the analysis of archaeological specimens. Heterogeneity and the uncertainty in the characterisation of commercially available multi-elemental standards can also negatively influence the calculation of the response factors required to obtain fully quantitative data. Finally, fractionation and matrix effects can strongly affect the measurement, resulting in the possibility of over- or under-estimating the concentration of the analytes. This paper describes a fully quantitative method used for the investigation and characterization of a large set of Roman and late Iron Age glasses used in the making of Iron Age British beads, the results of which are published elsewhere (Bertini et al., J. Archaeol. Sci., 2011, 38, 2750–2766). In this work, the impact of the aforementioned issues and the different methods of quantification used on the precision (determined as the bias between different replicates), accuracy and repeatability of the measurement are evaluated. Particular emphasis is placed on assessing the influence of laser sampling procedures, integration of the transient signal, data reduction strategies, quantification approaches and the possibility of adapting the method to suit a large range of glass compositions.
Introduction
Multi-elemental analysis of ancient glasses
Compositional analyses of archaeological glasses are a fundamental step in their provenancing. Bulk composition data on major and minor components can provide information about the kind of glass studied and the type of raw materials employed in its production1 (e.g. the source of sand and alkali used as glass former and flux, respectively). The measurement of as few as five elemental oxides (MgO, MnO, K2O, Sb2O3 and PbO) had been shown by Sayre and Smith2 to provide sufficient information to permit a generic typological characterization of ancient glass. However, it is the study of trace elements that can help identifying their origin, distinguish the raw materials employed and shed light on the possible methods of batch preparation. Beside the basic ingredients of the melt and their impurities,3–6 trace elements can enter the glass through different routes: preparing and processing of the raw materials,7 mechanical operations such as sand grinding,4 or via introduction of pigments, decolourizers and opacifiers.8–12The analysis of archaeological artefacts generally requires the use of non-destructive or micro-destructive techniques. The damage caused to the sample needs to be kept to a minimum, in order to preserve the integrity of the artefacts, avoid the creation of an impact visible to the naked eye, and prevent any intrinsic alteration that might impair future analysis. The use of Laser Ablation (LA) as a sampling tool allows the direct removal of a few micrograms of the sample fitted in an air-tight ablation chamber. The coupling to Inductively Coupled Plasma Mass Spectrometry (ICP-MS) offers fast, multi-elemental, trace level, quantitative analysis. This versatile technique is applicable to a wide range of materials, making it an ideal analytical tool for the investigation of precious and sparingly available samples.13–16 It allows measurements with low limits of detection, high precision and accuracy in comparison with other techniques employed for archaeometric analysis, and high spatial resolution (both laterally and in depth). Although LA-ICP-MS is in a way a surface technique, which may suffer from the effects of external contamination and surface degradation, depth profiling can provide a means of establishing the extent of these problems.16 The removal of the first few microns of surface material by performing a short pre-ablation pass was proved to effectively eliminate surface contaminants and weathered layers, allowing the sampling of the unaltered material only.16,17
Despite the many advantages of LA-ICP-MS and its extensive use in the analysis of modern glass,18–22 its use in the characterization of archaeological glasses is largely impaired by the lack of dedicated standards for calibration. LA-ICP-MS analyses require solid standards that are matrix-matched to the unknown sample, particularly when long wavelength nanosecond lasers are used. Such standards must be available to research facilities worldwide in sufficient quantities to last more than a few analyses; they must be well characterized for all analytes of interest, and especially homogeneous at the required scale of sampling. These conditions are not always fulfilled,23–26 leading to the necessity to develop quantification strategies that circumvent these issues. Differences in ablation yield and the necessity for at least one internal standard to be known with sufficient certainty have also limited the use of this approach, as well as the impact of matrix-specific inter-element fractionation effects in the analysis of intrinsically different glasses. Although the latter mechanism is still not fully understood, it is defined as an element-dependent variation in the signal response of selected analytes during the analysis. It can occur both at the moment of ablation (when more volatile compounds are vaporized more readily than others), during transport (when larger particles deposit in the tubing or the chamber) or within the ICP (where larger particles are not atomized and ionized with the same efficiency as smaller ones).13,27,28 These effects depend on the type of LA system used and its operating conditions (e.g. wavelength, laser energy, sampling strategy, ablation conditions). Studies carried out on different kinds of lasers using 193 nm (ArF excimer laser) and 213 nm (Nd:YAG) laser radiation29–31 suggested that smaller particles are produced with 193 nm ablation, leading to more efficient handling (evaporation, atomization and ionization) in the Ar ICP, and therefore to the reduction of fractionation effects. Despite these limitations, LA-ICP-MS is now widely used in archaeometric research, with a steadily increasing amount of publications throughout the last decade32 and a number of applications on archaeological glasses.17,33–37 These studies apply different variations of an Internal Standard Independent (from now on ISI) method with sum normalization, initially devised by Gratuze and co-workers.38 This method relies upon the calculation of response factors from a set of standard reference materials, which are used for calibration.
This paper evaluates a fully quantitative method for the micro-destructive analysis of ancient glasses with LA-ICP-MS. Although specifically designed for the investigation of Mediterranean natron glasses, produced according to Roman recipes and used in Britain between 100 BC and 200 AD,39–41 the appropriate selection of suitable response factors will be shown to deliver accurate compositional characterization of a large range of glass types. This study will assess the importance of the various steps of the analysis, such as laser sampling strategies, integration of the signal and data reduction. The suitability of different analytical standards (NIST SRM 600 series glasses and standards from the Corning Museum of Glass) for the quantification of ancient glasses will be evaluated. Particular emphasis will be placed on establishing the influence of fractionation and of matrix effects on the analysis of profoundly different glasses, such as the soda-lime-silicate (SLS) glass used for the body of the archaeological beads investigated, and the opaque leaded glasses used for the decorations.16,37 The impact of the heterogeneity of the analytical standard used on the accuracy and repeatability of the measurement will be evaluated, as well as the accuracy of published values for the concentration of some analytes added to the basic support of the Corning glasses. The advantages of using ISI methods with sum normalization35,38versus the performance of traditional calibration curves will also be investigated. Finally, the study will consider the use of different laser types (Nd:YAG and excimer ArF), wavelengths (193 and 213 nm), and ICP-MS types (quadrupole and sector field).
Experimental
Materials
The data discussed in this paper refer to the analysis of a pool of glasses employed in the manufacture of Iron Age British beads (the compositional results of which are reported elsewhere16,37) and the extensive number of measurements performed on the standards used for their quantitative analysis.Archaeological samples
The majority of the archaeological specimens analysed were Class 13 and Class 14 Scottish beads according to Guido's classification,16,37,39 which had been made available by the University of Aberdeen Museums (formerly Marischal Museum) and the National Museum of Scotland (NMS, Edinburgh). One additional sample set, consisting of a series of fragments removed from a mix of Iron Age southern British glass beads excavated at Middleton Grandcourt Farm (East Winch, county of Norfolk), were made available for analysis by Archaeological Project Services (APS, Heckington, Lincolnshire). Each bead was composed of a variety of different glasses, analysed for major and minor components and trace elements.16,37 The body was normally an SLS glass of general Roman composition, which in itself could be made up of individual fragments melted together. In addition, each bead was decorated with a monochrome or polychrome pattern of opaque glasses, which could contain high amounts of PbO (up to 46%) and/or variable amounts of Sb (up to 15%) or Sn (up to 10%). This brought the number of individual glasses being successfully analysed in the course of the compositional study to a total of 196. During this study, these data were used to establish the best sampling and data reduction strategies for archaeological glasses, and the flexibility of the quantification method.Glass standards: suitability and limitations for quantification purposes
The method evaluation was carried out on a set of analytical glass standards, for which published quantitative values are available in the literature42–47 (see Table 1). These glasses were used for calibration purposes; however, in order to produce a large body of accuracy and repeatability data, additional measurements were performed before and throughout the investigation of the archaeological samples, and were treated as unknown samples. The reference materials used in this work were NIST (National Institute of Standard and Technologies, USA) standard reference materials (SRM) 612 and Corning Museum of Glass (CMG) standards B, C and D. The analysis performed at the Analytical Chemistry Department at Ghent University also benefited from the use of NIST SRM 610 and 614, not available for the analyses performed at the University of Aberdeen. NIST SRM glasses 610, 612 and 614 have 61 trace elements added to their basic matrix support, in a nominal concentration of 500 mg kg−1,44 50 mg kg−1,45 and 1 mg kg−1,46 respectively. However, the use of the NIST SRM 600 series alone for calibration purposes would present several drawbacks. The matrix of NIST glasses is fundamentally different from that of archaeological glasses in terms of major and minor components. This leads to large differences in ablation yield and matrix absorptivity of the laser energy that can introduce bias in the quantitative calculations. The concentration of trace elements in the NIST SRM 600 series is also significantly different from that of ancient glasses, and the fact that all trace elements are present at the same concentration level deviates from the situation for archaeological glasses. Elements responsible for imparting the colour and opacity to archaeological glasses (such as Mn, Fe, Cu, Co, Sn, Sb and PbO) were deliberately added in the form of pigments, decolourizers and opacifiers, and are found in substantially higher concentrations than those added to the NIST glasses. The use of impure raw materials also resulted in the involuntary addition to the melt of a range of trace elements in various concentrations. In order to overcome these problems, CMG standards B, C and D were employed in the quantitative calculations. Glass A is unfortunately no longer available. These analytical standards mimic ancient compositions.43,48 Glass A and B match the composition of SLS Egyptian, Mesopotamian, Roman, Byzantine and Islamic glasses. Glass C is a lead–barium glass similar to that found in East Asia, and was fundamental to the characterization of opaque lead-rich Roman glasses. Finally, glass D is a high-Mg, high-Ca potash glass, with typical medieval composition. The matrix of these glasses, and in particular those of CMG B and C, matched more closely that of the translucent and opaque glass samples analysed in this study in terms of response to laser sampling (e.g. ablation threshold). The range of concentrations of the trace elements added to these supports is more similar to that contained in ancient glasses. Also, whereas NIST SRM 600 series glasses all present different levels of transparency depending on the Co concentration contained in their matrix, the CMG glasses appear as deeply coloured as the ancient glass beads. High concentrations of chromophores impart dark hues of blue (CMG B and C) and green (CMG D), even when the thickness is low. Studies by Gaboardi and Humayun26 highlighted that with 213 nm lasers, the response to sampling of refractive versus volatile elements will vary with the transparency of the sample. The concentration of the analytes of interest may be thus over- or under-estimated. Compositional analyses of CMG standards were performed by means of many analytical techniques,42 and the use of these standards has been reported in many archaeometric analyses of ancient glasses employing microbeam techniques such as LA-ICP-MS and electron probe X-ray microanalysis (EPXMA).5,17,33,35–37,49 However, the published compositions are not certified, and the homogeneity on a microscopic scale can only be extrapolated for a limited number of elements from Vicenzi's characterization.43 These analyses show poor homogenization of some of the analytes, highlighted by high standard deviation between measurements (e.g. RSD of 102 analysis of BaO in CMG B = 46.7%). Additionally, some discrepancies were found throughout this study between published and measured values, which had deleterious consequences on the quantification process. A recent assessment of the elemental composition of CMG standards48 established that concentrations for a number of analytes measured with LA-ICP-MS differed at times substantially from the published values, confirming the necessity to re-evaluate the standards and provide additional characterization with different instrumental set-ups. Although on a different scale, the degree of heterogeneity of NIST standards is also a concern. They were produced to be used for bulk analysis and seem to display sufficient homogeneity for microanalysis for only half to two-thirds of the trace elements added.24,50–52 The concentration of only eight trace elements is certified by NIST,44–46 while for the concentration of the remaining elements one has to rely on published values, which do not seem to present a sufficient level of agreement within their stated uncertainty.52| Analyte | NIST610 accepted | NIST612 accepted | NIST614 accepted | CMG B accepted | CMG C accepted | CMG D accepted |
|---|---|---|---|---|---|---|
| [w/o] | ||||||
| SiO2 | 70.0 | 71.9 | 72.3 | 61.6 | 34.9 | 55.2 |
| Na2O | 13.4 | 14.0 | 13.6 | 17.0 | 1.07 | 1.20 |
| CaO | 11.5 | 11.9 | 11.9 | 8.56 | 5.07 | 14.8 |
| Al2O3 | 2.04 | 2.11 | 1.99 | 4.36 | 0.87 | 5.30 |
| MgO | 0.077 | 0.013 | 0.006 | 1.03 | 2.76 | 3.94 |
| K2O | 0.059 | 0.008 | 0.004 | 1.00 | 2.84 | 11.3 |
| PbO | 0.049 | 0.004 | 0.0003 | 0.61 | 36.7 | 0.480 |
| [mg kg −1 ] | ||||||
| Li | 485 | 42.0 | 1.60 | 4.65 | 46.5 | 23.2 |
| Be | 466 | 38.0 | 0.670 | — | — | — |
| B | 356 | 35.0 | 1.40 | 62.1 | 621 | 311 |
| P | 343 | 51.0 | 13.0 | 3578 | 611 | 17![[thin space (1/6-em)]](https://www.rsc.org/images/entities/char_2009.gif) 150 150 |
| S | 693 | 377 | 306 | 2002 | 400 | 1201 |
| Cl | 438 | 131 | 92.0 | 2000 | 1000 | 4000 |
| Ti | 434 | 44.0 | 0.855 | 540 | 4736 | 2278 |
| V | 442 | 39.0 | 1.00 | 224 | 33.6 | 84.0 |
| Cr | 405 | 36.0 | 1.80 | 34.2 | 6.84 | 17.1 |
| Mn | 485 | 38.0 | 1.40 | 1936 | 6351 | 4260 |
| Fe | 458 | 51.0 | 19.0 | 2643 | 2643 | 4042 |
| Co | 405 | 35.0 | 0.850 | 393 | 1416 | 157 |
| Ni | 459 | 38.8 | 1.00 | 786 | 157 | 393 |
| Cu | 430 | 37.0 | 1.37 | 21249 |
9027 | 3036 |
| Zn | 456 | 38.0 | 2.50 | 1526 | 402 | 803 |
| As | 317 | 37.0 | 0.660 | — | — | — |
| Rb | 426 | 31.4 | 0.855 | 9.14 | 91.4 | 45.7 |
| Sr | 516 | 78.4 | 0.760 | 169 | 2452 | 507 |
| Y | 450 | 38.0 | 0.750 | — | — | — |
| Zr | 440 | 38.0 | 0.840 | 185 | 37.0 | 92.5 |
| Ag | 239 | 22.0 | 0.420 | 93.1 | 18.6 | 46.6 |
| Cd | 259 | 28.3 | 0.580 | — | — | — |
| Sn | 396 | 38.0 | 1.60 | 315 | 1497 | 788 |
| Sb | 369 | 38.0 | 0.780 | 3843 | 251 | 8103 |
| Ba | 435 | 39.7 | 3.20 | 1075 | 102105 |
4568 |
| La | 457 | 35.8 | 0.720 | — | — | — |
| Ce | 448 | 38.7 | 0.810 | — | — | — |
| Pr | 430 | 37.2 | 0.760 | — | — | — |
| Nd | 431 | 35.9 | 0.740 | — | — | — |
| W | 445 | 40.0 | 0.880 | — | — | — |
| Au | 23.0 | 5.10 | 0.450 | — | — | — |
| Bi | 358 | 30.0 | 0.580 | 44.9 | 8.97 | 22.4 |
| Th | 457 | 37.8 | 0.748 | — | — | — |
| U | 462 | 37.4 | 0.823 | — | — | — |
All standards were embedded into low temperature epoxy resin (Epozide, Buehler, Germany) and polished with progressively finer SiC abrasive discs (Carbimet, Bluehier, Germany), ranging from grit size 320 to 800, in order to expose the glasses and remove surface contamination. The block was cleaned in an ultrasonic water bath for two minutes, dried at room temperature and then firmly mounted into the ablation chamber.
Instrumentation
The three sets of samples studied were analysed using three different instrumental set-ups at the Trace Element Speciation Laboratory Aberdeen (TESLA), University of Aberdeen, UK, and the Department of Analytical Chemistry of Ghent University, Belgium. The analysis of Iron Age Scottish beads used for the method development and the first part of the study37 was carried out by means of an Nd:YAG Laser Ablation system (UP 213, New Wave Research, UK), quintupling the laser beam harmonic to a wavelength of 213 nm. The instrument was coupled to a quadrupole-based ICP-MS unit (7500C, Agilent, Japan). The second part of the study16 was carried out using an equivalent instrument set-up, although in this case the laser used was a different, recently refurbished device (New Wave Research, UK). Finally, the beads excavated at Grandcourt Farm were analysed with three different combinations of Laser Ablation systems (New Wave Research UP213, New Wave Research UP193HE and GeoLas Microlas Laser System GmbH) and ICP-MS instruments, equipped with either a quadrupole mass analyser (Agilent 7500C and Thermo Scientific X Series II) or a double-focusing sector field mass spectrometer (Thermo Scientific Element XR).Tuning and optimization of the performance of LA-ICP-MS analysis were carried out daily using NIST SRM 612. A line scan was run across the surface of the standard (spot size 100 μm, speed 5 μm s−1, frequency 10 Hz, energy output of 80%, corresponding to 1.4 mJ on the sample with fluence >10 J cm−2). Prior to connecting the laser, ICP-MS tuning was performed using pneumatic nebulisation for sample introduction on a regular basis. The torch position and the voltage of ion lenses were optimized for maximum sensitivity and stability at low oxide and doubly charged ion levels. In order to control elemental fractionation, plasma operating conditions were adjusted so that the 238U/232Th intensity ratio would be as close as possible to 1. Data acquisition was carried out in peak hopping mode.
Method
In LA-ICP-MS, it is important to optimise ablation parameters for the sample matrix to be measured. Spot size, repetition rate, fluence and the use of single spots or lines for the ablation process influence the analytical performance. In the case of archaeological samples, a major factor in the choice of the spot size and rastering method is the visible impact of the sampling on the specimens (Fig. 1). Therefore, the ablation of lines, as well as the use of spot sizes larger than 150 μm, were ruled out because the ablation scar would have been visible to the naked eye, and thus be unacceptable to the curators of the museums. Ablation of short lines (1250 μm) was applied only in the analysis of fragments obtained from the Grandcourt Farm beads, for which permission to undertake destructive analysis was obtained. Here, a speed of 25 μm s−1 was chosen for ablation, as it provided the best ratio of signal intensity versus spatial resolution. Instrumental parameters were optimized to yield optimum signal intensities of the elements of interest (Table 2). Energy output was chosen to obtain a fluence of about 10 J cm−2, which exceeded the ablation threshold of all glasses involved in the analysis at the laser wavelengths used (193 nm and 213 nm). This allowed removal of sufficient material (thus providing a steady and quantifiable signal intensity) without producing an exceedingly deep crater, and with negligible fractionation effects.13 Non-stoichiometric selective volatilization and formation of large particles, which could cause problems during aerosol transport and incomplete ionization once in the plasma, were avoided to the largest possible extent by limiting the frequency to 10 Hz.34 A pre-ablation pass (see Table 2) was performed in order to clean the sample surface and remove potentially weathered layers.17 This procedure was performed on both samples and standards, in order to ensure similar conditions of ablation (e.g. initial cater depth). The element menu was chosen with regard to the range of possible compositions that could occur in ancient glass and that are well represented in the CMG standards in terms of major and minor element oxides. The choice of trace elements included elements that can discriminate different glasses, based on the various raw materials involved in their manufacture, their provenance and the (de)colourizing agents.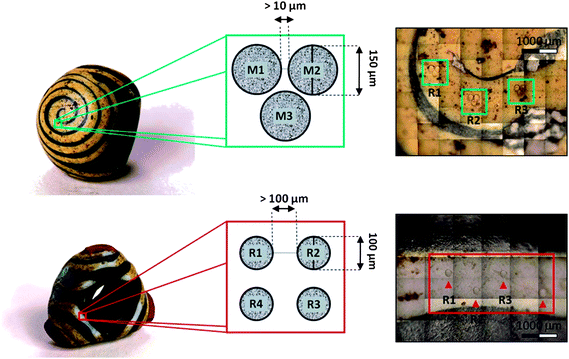 | ||
| Fig. 1 Sampling schemes used for the analysis of Iron Age Scottish glass beads. Above: ABDUA:15590; below: ABDUA:15542 (both from University of Aberdeen Museums). The scale of the photographs (obtained with NWR UP213, CCD camera) gives an indication of the level of detailed sampling which is possible to achieve with this technique (photos of the beads courtesy of University of Aberdeen Museums). | ||
| Sample set | Iron Age Scottish beads (University of Aberdeen Museums) | Iron Age Grandcourt Farm beads (APS) | Iron Age Grandcourt Farm beads (APS) | Iron Age Grandcourt Farm (APS) and Scottish beads (NMS) |
|---|---|---|---|---|
| a Laser in loan from ESI, New Wave Research, used for the method development and the first part of the study. b Second instrumental set-up, used for the remaining part of the study; the laser was a different, recently refurbished device. | ||||
| Laboratory | University of Aberdeen | Ghent University | Ghent University | University of Aberdeen |
| Laser ablation system | New Wave Research, UP213a | New Wave Research, UP193HE | Microlas Lasersystem GmbH, GeoLas | New Wave Research, UP213b |
|---|---|---|---|---|
| Type of laser – wavelength, nm | Nd:YAG – 213 | Excimer ArF – 193 | Excimer ArF – 193 | Nd:YAG – 213 |
| Ablation mode | Raster (spots) | Raster (spots and lines) | Raster (spot) | Raster (spots) |
| Replicates | 3–5 | 3–5 | 3–5 | 5+ |
| Laser warm up, s | 15 | 30 | 10 | 20 |
| Laser washout, s | 25 | 40 | 60 | 30 |
| Chamber volume, ml | 33 | 33 | (Ø = 51 mm) | 33 |
| Pre-ablation | Ablation | Pre-ablation | Ablation | Pre-ablation | Ablation | Pre-ablation | Ablation | |
|---|---|---|---|---|---|---|---|---|
| Spot size (spots), μm | 150 | 150 | 110 | 110 | 120 | 120 | 100 | 100 |
| Spot size (lines), μm | — | — | 90 | 90 | — | — | — | — |
| Line length, μm | — | — | 1250 | 1250 | — | — | — | — |
| Energy, % | 85 | 100 | 100 | 100 | 100 | 100 | 100 | 75 |
| Fluence (spots), J cm−2 | ∼6.6 | ∼9.5 | ∼8.9 | ∼8.9 | — | — | ∼12.3 | ∼8.5 |
| Fluence (lines), J cm−2 | — | — | ∼11.49 | ∼11.49 | — | — | — | — |
| Energy on sample (spots), mJ | ∼1.14 | ∼1.68 | ∼1.6 | ∼1.6 | (Max) | (Max) | 2.16 | 1.5 |
| Energy on sample (lines), mJ | — | — | 0.9 | 0.9 | — | — | — | — |
| Frequency, Hz | 10 | 10 | 10 | 10 | 10 | 10 | 10 | 10 |
| Dwell time (spots), s | 15 | 25 | 2 | 80 | 2 | 80 | 2 | 50 |
| Speed (lines), μm s−1 | — | — | 150 | 25 | — | — | — | — |
| ICP-MS | Agilent 7500 C | Thermo-Scientific | Thermo-Scientific | Agilent 7500 C |
|---|---|---|---|---|
| X Series II | Element XR | |||
| RF power, W | 1550 | 1440 | 850 | 1360 |
| Carrier gas flow rate, l min−1 | 1.45 (Ar) | 0.67 (He) + 0.75 (Ar) | 0.74 (He) + 0.42 (Ar) | 1.5 (Ar) |
| Plasma gas flow rate, l min−1 | 12 (Ar) | 13 (Ar) | 16 (Ar) | 12 (Ar) |
| Auxiliary gas flow rate, l min−1 | 1 (Ar) | 0.7 (Ar) | 1 (Ar) | 1 (Ar) |
| Acquisition time, ms per point | 100 (10 for 23Na, 43Ca, 29Si, 206Pb) | 10 | 20 | 30 (5 for 23Na, 27Al, 29Si, 43Ca, 206Pb) |
| Analytical menu | Menu 1: 7Li, (9Be), 11B, 23Na, 24Mg, 27Al, 29Si, 31P, (35Cl), 39K, 43Ca, 47Ti, 51V, 53Cr | 7Li, 9Be, 11B, 23Na, 24Mg, 27Al, 29Si, 31P, 33S, 35Cl, 39K, 43Ca, 44Ca, 47Ti, 51V, 52Cr, 55Mn, 56Fe, 57Fe, 59Co, 60Ni, 63Cu, 66Zn, 75As, 77Ar Cl, 82Se, 83Kr, 85Rb, 88Sr, 89Y, 90Zr, 107Ag, 111Cd, 118Sn, 121Sb, 137Ba, 139La, 140Ce, 141Pr, 146Nd, 182W, 197Au, 206Pb, 208Pb, 209Bi, 232Th, 238U | 7Li, 9Be, 11B, 23Na, 24Mg, 27Al, 29Si, 31P, 32S, 33S, 35Cl, 39K, 43Ca, 47Ti, 51V, 52Cr, 55Mn, 56Fe, 57Fe, 59Co, 60Ni, 63Cu, 66Zn, 75As, 85Rb, 88Sr, 89Y, 90Zr, 107Ag, 111Cd, 118Sn, 121Sb, 137Ba, 139La, 140Ce, 141Pr, 146Nd, 182W, 197Au, 206Pb, 208Pb, 209Bi, 232Th, 238U | 7Li, 9Be, 11B, 23Na, 24Mg, 27Al, 29Si, 31P, 33S, 35Cl, 39K, 43Ca, 47Ti, 51V, 53Cr, 55Mn, 57Fe, 59Co, 60Ni, 63Cu, 66Zn, 75As, 85Rb, 88Sr, 89Y, 90Zr, 107Ag, 111Cd, 118Sn, 121Sb, 137Ba, 139La, 140Ce, 141Pr, 146Nd, 182W, 197Au, 206Pb, 208Pb, 209Bi, 232Th, 238U |
| Menu 2:29Si, 55Mn, 57Fe, 59Co, 60Ni, 63Cu, 66Zn, 69Ga, 75As, (82Se), 85Rb, 88Sr | ||||
| Menu 3:29Si, 90Zr, 107Ag, 118Sn, 121Sb, 137Ba, 140Cs, 146Nd, (197Au), 206Pb, 208Pb, (209Bi), 238U |
Procedure for data reduction
Time-resolved analysis produced a plateau-shaped transient signal for each nuclide measured. The signal profile can be described as a pattern given by a steep increase in the intensity of the signal as the laser starts firing, which is proportional to the abundance of the nuclide measured. As the ablation stops the signal drops back to the base line at a rate depending on the intensity of the signal and the specific tailing (memory) effect of the analyte measured (Fig. 2). In homogeneous samples, the signal will have a fast increase to the maximum intensity and remain stable until the end of the ablation. For volatile nuclides (and specifically: K, S, Cl, Zn, Ag, Sn, Sb and Pb), the signal rises with a steep gradient far above the actual intensity of the element and then drops significantly producing an artefact peak (false maximum) at the start of the signal plateau. The time-resolved signal patterns for all elements should be parallel53 in the analysed sections. The same portion of the signal should be integrated for each analyte and the internal standard. The noise of the signal on the plateau depends on several factors, such as the degree of homogeneity of the specimen, the characteristics of the material, the conditions of ablation and the transport efficiency. The average intensity of minimum three to five replicate measurements was used for compositional analysis. The signal intensity (I), expressed in counts per second (cps) for each elemental oxide (major and minor components only) and element (e), was determined as the stable part of the signal plateau minus the average background signal intensity (bg). As certified glass blanks constituted of pure silica are not available, the background signal generated by the gas blank was acquired during laser warm-up, while the shutter was closed. It is crucial that enough washout time is allowed between two subsequent analyses to allow the system to evacuate all remaining particles and thus extinguish signal tailing and level out the background. Inspection of the time-resolved signal54 is fundamental when analysing archaeological samples. When an initial false maximum (Fig. 3) was measured, the initial part of the plateau was discarded until the transient signal reached stability. The average was calculated on a plateau area not containing the initial peak. During the analysis of archaeological samples, it is possible for the laser to encounter patches of heterogeneous material, such as gas bubbles and/or pigment clusters and opacifying crystals (Fig. 4). Unless the heterogeneity concerned large segments of the signal in all replicates, the hotspot was generally not compositionally representative, and the portions of the plateau afflicted by the heterogeneity and any associated tailing effect were discarded. When the hotspot was so large as to affect the entire signal, the replicate concerned was discarded entirely and the material re-sampled. When aggregates of heterogeneous size and distribution were found to affect the entire signal of selected nuclides in all replicates, this was interpreted as a feature of the vitreous matrix, characterized by larger particles dispersed in the glassy medium. The signal was then fully integrated and the resulting high uncertainty values clearly expressed the characteristic heterogeneity of the material. In all cases equivalent portions of the signal of both the internal standard and the analyte must be integrated for appropriate standardization. Outliers were readily identified by plotting the ablation signal as scatter/dot graphs, and spurious data were discarded after visual evaluation.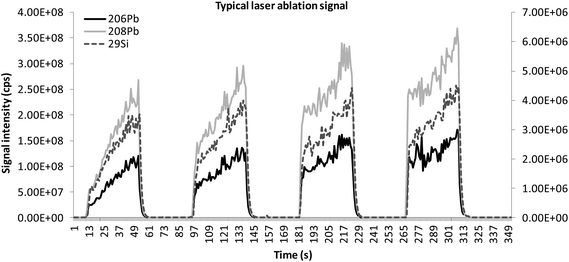 | ||
| Fig. 2 Ablation profiles for 206Pb and 208Pb against that for 29Si for the calibration standard CMG C (PbO = 36.7%) showing a typical laser ablation signal. It is possible to see that the signal of volatile analytes in high abundance is parallel to that of the internal standard and no false maximum is recorded at the beginning of the signal plateau. | ||
 | ||
| Fig. 3 Ablation profiles for 59Co and 66Zn against that for 29Si for a real sample of translucent cobalt blue glass (museum record: 15504), showing that the signal of volatile analytes (Zn) can be affected by the initial false maximum peak and the corresponding tailing effect. Both are discarded from the calculation during data reduction, and only the portion of the signal parallel to that of the internal standard is considered. | ||
 | ||
| Fig. 4 Ablation profiles for 118Sn and 121Sb against that for 29Si for a real sample of opaque leaded glass (museum record: 15504, Sn = 380 mg kg−1, Sb = 1.75%), showing the typical signal profile of some elements employed in the opacification of ancient glasses in samples with highly heterogeneous matrix. The signal of the first and second replicates could be integrated with minimum manipulation, by discarding the initial false maximum and corresponding tailing effect. The third replicate was rendered unsuitable by the presence of large crystals (possibly lead stannate and lead antimonate, typically forming in the matrix of these glasses), intercepted in the laser path. The signal of 118Sn in the fourth replicate could be correctly integrated despite the presence of irregularities in the distribution of the element in the matrix, by removing individual irregular portions of the signal. Its average intensity was standardized by the average intensity of the corresponding portion of the 29Si signal. The final precision of the measurement is of 4.85 and 3.79% for Sn and Sb, respectively. | ||
Quantification strategy
Quantification is always a difficult issue in laser ablation analysis of ancient glass. The main problem is that the efficiency of the ablation process is highly matrix-dependent, and requires perfectly matrix-matched multi-elemental standards, ideally containing the elements of interest in concentration ranges similar to those in the samples. The calculation of response factors38 is comparable to that of the slope of a single-point calibration curve forced through the origin. Normally, the drawback of this approach is that calibration is performed against one reference standard only, which may not match the range of concentrations expected in the sample for all analytes.Multi-standard calibration is highly preferable. However, unlike in liquid analysis where it is possible to adjust the span and distribution of concentrations for each analyte in the multi-elemental standard solutions, LA-ICP-MS must rely on the existence of solid standards. The standards chosen in this study were the most suited amongst those available on the market for the accurate characterization of the archaeological glasses investigated. However, the possibility of producing calibration curves can be jeopardised by fractionation and matrix effects, irregular dispersion of analytes in the matrix of standards, heterogeneous distribution of concentration data points amongst the standards, and inaccuracies in the quantification of reported values for selected analytes (e.g. in CMG standards16,43,48). Large errors in the quantification can occur when using traditional calibration curves under these circumstances. For example, the heterogeneous distribution of concentration data points in the graphs produced for some elements and elemental oxides (e.g. PbO) resulted in artificially high correlation coefficients (R2) for the line of best fit, which did not represent the actual linearity of the curve. Also, the use of standards for calibration which are radically different from the sample, and cover an unsuitable range of concentrations, resulted in a number of analytes (e.g. MgO, K2O and Fe in NIST 612, CaO and Al2O3 in CMG C, and Na2O in CMG D) suffering from poor accuracy in their quantification when using calibration curves (bias versus corresponding reference value >10%).
The quantification strategy used followed Longerich et al.54 and Gratuze et al.38 The ISI method developed during the course of this study (and described in the ESI†) envisages the determination of response factors (k) obtained from each analytical standard for all analytes. Averaging the compositional results calculated from suitable response factors of a specific array of glass standards produced identical results to the performance of traditional calibration curves.
The advantage of using the ISI method instead of standard calibration curves lies in the possibility of comparing the response factors values obtained from the different standards, and spotting those that may have suffered from specific issues. Under ideal conditions, the response factor for a given analyte obtained from different standards should always be about the same value within a given day of analysis, with some small fluctuations given by the irregularity and matrix-specific properties of the ablation yield. However, response factors were found to vary, sometimes greatly, between one standard and another, as also highlighted by van Elteren et al.35 This phenomenon was linked to two different aspects: firstly, the aforementioned irregular distribution of some analytes in the medium of the standards and the uncertainty of their published values (especially when CMG standards are concerned43,48); secondarily, the presence of identifiable matrix effects which would result in undesirable alterations of the signal.
These effects, caused by the elemental response to laser sampling in specific matrixes, cannot be appropriately monitored when using the data acquired in the production of calibration curves. Individual response factors can instead be compared and evaluated, and discarded when deemed unsuitable for any of the reasons further discussed below. Multi-spot calibration will be performed only with the suitable ones.
It was observed that the reason why the case-specific choice of response factors to suit the characteristics of the glass under investigation increased the accuracy of the quantification method, was associated with the some issues related to matrix effects. For example, despite the effort in the integration of the transient signal, it is sometimes impossible to avoid the tailing effect of a very high false maximum peak on the average intensity of the plateau (Fig. 5), resulting in artificially higher element:internal standard ratios. Whereas a matrix-independent standardization of the signal is possible for refractory elements by choosing an internal standard with a similar temperature of condensation, the effect of the false maxima on volatile elements cannot be negated,26 and any standardization is therefore subject to element-specific systematic errors. When using these data for the production of traditional calibration curves the linearity was largely lost and the quantitative results were grossly biased. Response factors calculated from these signals were equivalently influenced by the fractionation effects induced by the volatility of these analytes, particularly at low concentrations. However, it was observed that the application of response factors calculated from signals biased by these tailing effects, to samples which contained the analyte in the same range of concentration, resulted in a much higher accuracy. For this reason, it is fundamental to compare all the response factors obtained from all analytical standards available for each specific analyte, and decide their suitability for the calibration in the sample analysed. Response factors that appear biased by the aforementioned issues should be used only for calibration of samples with similar characteristics, where the analyte in question is contained in equivalent concentration ranges and its transient signal is biased in an equivalent manner. For those samples which contain the analyte in a sufficient concentration not to be influenced by this bias, all available standards which do not appear to be subject to such setbacks should be used, in order to obtain a multi-standard calibration.
 | ||
| Fig. 5 Ablation profiles for 206Pb and 208Pb against that for 29Si for a real sample of lead-free translucent amber glass (museum record: 15504, PbO = 0.007%), showing that the signal of volatile analytes in very low abundance is greatly biased by the effect of the initial false maximum. The signal of the analyte is not parallel to that of the internal standard, leading to the possibility of over-estimating its concentration. However, accurate quantification is possible when using a calibration standard containing a similar concentration of the analyte, which will produce a similar response to sampling. | ||
In conclusion, the application of the ISI method with sum normalization represented a substantial advantage in comparison to the application of single-spot calibration, or the production of traditional calibration curves. Comparing all response factors produced for each analyte during each measurement day allowed spotting those that were rendered unacceptable by the heterogeneity of the analyte distribution. Applying a ‘biased’ response factor to the quantification of ‘biased’ sample signals allowed us to avoid the possibility of over-quantifying selected analytes. Averaging results from all suitable response factors in all other cases allowed a multi-standard calibration, which extended the calibration range and ensured better accuracy than single-standard calibration. The flexibility allowed by this method permitted the accurate quantification of the composition of very different glasses, where analytes spanned very different ranges of concentrations.
Results and discussion
Signal stability
In this study, the stability of the signal was measured as the relative standard deviation (RSD) of the integrated potion of the signal plateau. The standard error (or standard deviation of the mean = ) may also be used. Although in this way much smaller values are obtained (up to one order of magnitude lower, due to the large number of data points N in the analysis), the interpretation of the signal stability using this method is less straightforward, and heterogeneous areas of the signal, normally exposed by high RSDs, are masked by the calculations. Monitoring the stability of the signal is of fundamental importance when analysing archaeological standards, as particularly high values may indicate the presence of false maxima or heterogeneous hotspots that may have not been spotted during on-line monitoring of the signal.
Very variable values were measured during the course of this study, which depended largely on the performance of the laser used and the response of the material to laser sampling. Large RSD values were measured for exceptionally sloping plateaus. Although this factor was not found to impact on the accuracy of the measurement (when it was possible to integrate the signal of each analyte correctly, and the ablation profiles of all analytes and the internal standard evolved in a parallel way) the rapid decrease in signal intensity may indicate the use of an exceedingly high fluence, which the analyst may want to reconsider.
Precision
Precision is understood as the agreement between results obtained for a number of replicate measurements of the same sample (typically between three and five across the surface of the sample, and up to ten for standards) whose average is used for quantitative purposes. It is expressed both as the propagated uncertainty (combined standard uncertainty) of the raw intensity (in cps) between replicates, and as the RSD between the quantitative results for the different replicates.The combined standard uncertainty was calculated in order to evaluate the stability of the signal between replicates. The method used follows Kragten's technique,55 and was chosen because it readily permitted the assessment of the significance of the contribution of individual uncertainty components to the final uncertainty. When considering the RSD derived from the independent quantification of different replicates, the information drawn relates to the homogeneity of the material, the reliability of the method of sampling, the integration of the signal, and the performance of the SRM used. The stability of the signal has only a marginal relevance.
When ablating real archaeological samples, these values also gave a measure of the homogeneity of the material. In addition to punctiform heterogeneities that can be visually discarded, the consistent presence of radically different standardized intensities being measured between replicates showed the degree of homogenization of the glass phase, and gave indications of the size and dispersion of pigmenting particles. The error was found to be greater for those volatile trace elements close to their LoD. When volatile elements were present in sufficiently high concentrations such that their signal intensity was not influenced by the tailing effect of the false maxima, the combined standard uncertainty was found to be low. The combined standard uncertainty was found to vary greatly between analyses performed with different lasers and ablation methods, but showed little variation between measurement days. This is not surprising as the calculation takes into account values of internal precision (stability of the signal), which varied decidedly with the instrumental set-ups, and in particular with the characteristics of the laser used. Archaeological samples always showed poorer precision results than SRM, which is related to their intrinsic heterogeneity.
The precision values measured for the analytical standards (detailed in the ESI†) were found to be compatible with those reported by Jackson,56 and were normally in the range of a few percent after propagation of all the errors. Although it is true that LA-ICP-MS provides a lower precision than does solution mode ICP-MS, it has been argued that attempting to artificially enhance precision during data reduction could lead to the risk of inaccurate quantitative results.57 Also, whereas one of the clear benefits of LA-ICP-MS is its ability to resolve different components in the sample with high spatial resolution, excessive correction and statistical data manipulation can effectively hide, rather than resolve, small-scale variations in the sample,57 which may actually be important for the interpretation of the characteristics of the material analysed. In the case of archaeological glasses, it is fundamental to account for the heterogeneity of the matrix, as this aspect can reveal important information regarding melting and colouring techniques. Reducing the uncertainty normally associated with coloured and opaque glasses can conceal differences between glasses of the same type in terms of homogeneity (e.g. crystal size and dispersion), which may distinguish different secondary workshops where the colour and opacity were imparted. Instead, on-line monitoring, real-time data correction and graphical representation of all ablation patterns, consented to appreciate and respect the signal uncertainties whilst limiting the recourse to statistical manipulation of the dataset and reducing the need for complex uncertainty propagation.
Limit of detection
For each analyte, the LoD was determined as three times the standard deviation(s) of the gas blank signal (in cps) acquired during laser warm-up. In order to convert these values to concentrations, the first step consisted in the normalization of the signal to the day-specific sensitivity of the instrument, expressed as signal per concentration units (cps ppm−1).53 The average signal intensity of the internal standard in each SRM used was divided by its concentration in the standard and used to standardize the quantity 3se. Finally, concentration values for the LoD for every given analyte (e) were calculated in the same way as for the real samples.53,54The LoDs determined using this technique fell in the sub-ppm level, and ranged between 0.00001 and about 2 mg kg−1 for most major, minor and trace elements, and were generally better than 0.5 mg kg−1 with all instrumental set-ups used (Fig. 6). Typical exceptions were represented by P (2 to 80 mg kg−1), Ti (2 to 7 mg kg−1) and Fe (5 to 40 mg kg−1). S and Cl had the highest LoDs, which varied considerably among instrumental set-ups and were usually in the range of a few hundred mg kg−1. In general, decreasing LoDs were found for increasing atomic weights. Analyses performed at the University of Aberdeen with the use of 3 sub-menus yielded lower LoDs than those carried out with a single elemental menu. Lower LoDs were obtained for the analysis performed at Ghent University, and in particular for analysis performed with a combination of the NWR UP193HE LA-unit and the Thermo Scientific X Series II instrument. However, exceptionally low LoDs were found for heavier elements when using the GeoLas LA-unit coupled to the Thermo Scientific Element XR instrument. The use of a low wavelength laser beam, probably associated with the characteristics of the ICP-MS instrument with which it was combined (such as the sector field ICP-MS instrument combined with the LA-unit), impacted favourably on the LoDs attainable.
 | ||
| Fig. 6 Limits of detection for major and minor components and trace elements as measured with the different analytical set-ups. Average limits of detection are calculated as three times the standard deviation over the background signal, quantified in the same way as compositional data. LoDs are expressed in weight% (oxide) for major and minor components, and in mg kg−1 (element) for trace elements. | ||
Accuracy, repeatability and reproducibility
The accuracy was evaluated by calculating the bias (difference between determined and published values, divided by the published value) and normalizing to 100% (Δ%). As this operation can result in both positive (over-estimation) and negative (under-estimation) values, the average deviation over a number of measurements was calculated on absolute values, rendering the highest possible deviation.Repeatability is intended as the RSD over the values obtained upon repeated determination of the composition of each standard throughout the study. In general, repeatability and accuracy were also used to determine the level of homogeneity in the distribution of some trace elements in the discrete standards, and helped discarding from the response factor calculations those analytes in the standards that returned excessively high Δ% and RSD (>15%) between a number of measurements. Standard analysis was alternated with sample analysis, so that the SRM were measured independently from the measurements used for calibration every few samples.
Accuracy and repeatability were found to vary greatly between analytes in the different standards. In particular, some of the analytes in CMG standards were found to show consistently poor accuracy and/or repeatability. A typical example is represented by Mn in CMG C. Although the concentration reported in the literature is about 0.63%,43 the signal intensity measured was always very low and in disagreement with the stated concentration given the ablation yield. Instead, our measurements established an actual concentration of about 10 mg kg−1 Mn, with repeatability normally around 10%. It is possible that a number of trace elements in low concentration in these standards were incorrectly quantified, resulting in the publication of unreliable values. This issue affected Li, B, V, Cr, Rb and Sn in CMG B; P, Cr, Mn, Sb and Bi in CMG C; Ba, Bi and PbO in CMG D. Equivalent results were recently published by Wagner and co-workers in their evaluation of Corning archaeological reference glasses.48 The response factors obtained for these analytes in the respective standards were never used for quantification. In the majority of measurements, S and Cl levels were found to be below the LoD. However, the accuracy measured for these elements was always poor. It was not possible to ascertain in this study whether this was due to inaccurate values being published, the excessive heterogeneity in their distribution, or their high volatility.
The analysis performed at the University of Aberdeen generally yielded good accuracy (Tables 3 and 4). Both repeatability and bias with respect to the reference value were found to range generally between 1 and 10% for the first experimental set-up, and between 1 and 15% (often better than 4%) for the second. Higher values were measured for CMG C, between 4 and 18%, while the best results were obtained for CMG B, the composition of which was the closest to that of the real samples amongst the reference materials employed. Repeatability values were found to be worse for several of the elements not directly added to the original melt of CMG standards (such as Be, Ga, Ce, Au and Bi), which were found to be present in the sub-ppm range. However, no accepted values are reported in the literature for these analytes, probably because of their heterogeneous distribution in these glasses. The analysis of NIST 612 rendered poor accuracy and repeatability for MgO, K2O, Fe and PbO (see ESI†). Problems with the quantification of Fe and PbO in NIST 612 were reported by Hinton.51 The high values for bias and reproducibility measured might be related to the heterogeneous distribution of these elements in the glass cane from which the wafer was cut. However, the erroneous quantification (resulting in over-estimation of their concentration) and high RSD between measurements for the aforementioned elements and elemental oxides may be attributed to their low concentration in the sample and the volatility of PbO, which would create problems in the integration of the signal plateau (which would be biased by the tailing effect after the false maximum). The concentration of MgO, K2O and Fe in NIST 612 was also substantially lower than that normally measured for archaeological glasses and present in CMG standards. This resulted in an over-estimation of their concentration when using the calibration data (array of response factors) fitted for the analysis of eastern Mediterranean natron glasses during cross-quantification. This is demonstrated when adapting the quantification strategy to the characteristics of the matrix to be analysed, favouring response factors that covered a more suited range of concentrations and suffered from an equivalent signal bias (refer to Quantification strategy). In such cases, although the repeatability is unchanged, the bias appeared to be lowered to values between 5 and 15%. Poor reproducibility was also reported for Zn and Ag in NIST 612, where these low-boiling point elements are present in low concentrations. Once again, the reason may lay in the effect of the signal tailing after the fake maximum.
| Analyte | Accepted values | University of Aberdeen | Ghent University | ||||||||
|---|---|---|---|---|---|---|---|---|---|---|---|
| New Wave Research, UP213b | New Wave Research, UP213c | New Wave Research, UP193HE | Microlas Lasersystem GmbH, GeoLas | ||||||||
| Average n = 9 | RSD | Δ% | Average n = 7 | RSD | Δ% | Measured | Δ% | Measured | Δ% | ||
| a <LoD = below limit of detection n.d. = not determined. b Laser in loan from ESI, New Wave Research, used for the method development and the first part of the study. c Second instrumental set-up, used for the remaining part of the study; the laser was a different, recently refurbished device. | |||||||||||
| [w/o] | |||||||||||
| SiO2 | 61.6 | 63.0 | 1.5 | 2.3 | 62.5 | 0.3 | 1.6 | 62.6 | 1.7 | 62.6 | 1.7 |
| Na2O | 17.0 | 16.7 | 3.5 | 3.4 | 17.4 | 2.0 | 2.3 | 17.2 | 1.3 | 17.1 | 0.76 |
| CaO | 8.56 | 8.77 | 2.6 | 3.0 | 8.69 | 1.5 | 1.7 | 8.81 | 2.9 | 9.06 | 5.5 |
| Al2O3 | 4.36 | 4.57 | 4.6 | 4.5 | 4.37 | 2.2 | 1.6 | 4.33 | 0.77 | 4.58 | 4.9 |
| MgO | 1.03 | 1.06 | 2.7 | 3.5 | 1.07 | 3.5 | 3.9 | 1.00 | 2.8 | 1.02 | 1.0 |
| K2O | 1.00 | 1.05 | 3.8 | 4.9 | 1.05 | 1.5 | 4.8 | 1.05 | 4.5 | 1.03 | 3.4 |
| PbO | 0.61 | 0.59 | 8.5 | 7.8 | 0.56 | 2.9 | 9.0 | 0.57 | 8.0 | 0.488 | 25 |
| [mg kg −1 ] | |||||||||||
| Li | 4.65 | 9.99 | 6.7 | 53 | 10.1 | 8.0 | 54 | 10.4 | 55 | 13.2 | 65 |
| Be | — | 0.05 | 26 | 0.06 | 14 | 0.29 | 0.212 | ||||
| B | 62.1 | 86.2 | 12 | 27 | 82.5 | 19 | 26 | 106 | 42 | 116 | 47 |
| P | 3578 | 3555 | 6.8 | 5.8 | 3930 | 3.2 | 8.9 | 3530 | 1.4 | 3864 | 7.4 |
| S | — | n.d. | 2066 | 5.6 | 4.6 | 1705 | 17 | 954 | 110 | ||
| Cl | 2000 | 2569 | 32 | 17 | 2525 | 13 | 20 | 1660 | 20 | 2054 | 2.7 |
| Ti | 540 | 612 | 2.8 | 12 | 602 | 5.8 | 10 | 710 | 24 | 618 | 13 |
| V | 224 | 184 | 6.8 | 23 | 194 | 3.3 | 16 | 190 | 19 | 184 | 21 |
| Cr | 34.2 | 59.9 | 12 | 42 | 60.1 | 3.2 | 43 | 58.5 | 42 | 61.1 | 44 |
| Mn | 1936 | 2057 | 4.5 | 5.7 | 1909 | 2.3 | 2.4 | 1947 | 0.55 | 1965 | 1.5 |
| Fe | 2643 | 2812 | 3.3 | 6.4 | 2810 | 1.5 | 5.9 | 2858 | 7.5 | 2716 | 2.7 |
| Co | 393 | 376 | 4.3 | 5.4 | 372 | 2.5 | 5.8 | 357 | 10 | 362 | 8.6 |
| Ni | 786 | 799 | 4.8 | 3.6 | 777 | 1.1 | 1.4 | 761 | 3.2 | 756 | 4.0 |
| Cu | 21249 |
23501 |
8.1 | 9.0 | 21825 |
1.6 | 2.6 | 21757 |
2.3 | 20197 |
5.2 |
| Zn | 1526 | 1754 | 5.7 | 13 | 1610 | 2.9 | 5.1 | 1710 | 11 | 1681 | 9.2 |
| Ga | — | 34.2 | 65 | n.d. | n.d. | n.d. | |||||
| As | — | 20.0 | 13 | 23.7 | 11 | 28.6 | 23.0 | ||||
| Rb | 9.14 | 11.5 | 9.4 | 20 | 12.7 | 2.9 | 28 | 12.8 | 28 | 12.0 | 24 |
| Sr | 169 | 164 | 6.4 | 6.0 | 160 | 2.3 | 5.8 | 165 | 2.3 | 164 | 3.2 |
| Y | — | n.d. | 0.42 | 13 | 0.40 | 0.413 | |||||
| Zr | 185 | 184 | 3.6 | 2.8 | 179 | 6.7 | 6.1 | 166 | 12 | 183 | 1.1 |
| Ag | 93.1 | 93.7 | 7.0 | 5.2 | 92.0 | 2.7 | 2.6 | 83.5 | 11 | 76.7 | 21 |
| Cd | — | n.d. | 1.02 | 14 | 1.16 | 0.911 | |||||
| Sn | 315 | 230 | 14 | 39 | 227 | 3.8 | 39 | 236 | 33 | 241 | 31 |
| Sb | 3843 | 3809 | 2.6 | 2.4 | 3984 | 1.9 | 3.5 | 3941 | 2.5 | 3860 | 0.4 |
| Ba | 1075 | 1008 | 12 | 12 | 942 | 2.6 | 14 | 954 | 13 | 876 | 23 |
| La | — | n.d. | 0.2 | 9.0 | 0.222 | 0.229 | |||||
| Ce | — | 0.19 | 29 | 0.188 | 11 | 0.185 | 0.185 | ||||
| Pr | — | n.d. | n.d. | 0.0210 | 0.0180 | ||||||
| Nd | — | 0.08 | 34 | n.d. | 0.082 | 0.0810 | |||||
| W | — | n.d. | n.d. | 0.0780 | <LoD | ||||||
| Au | — | <LoD | n.d. | <LoD | <LoD | ||||||
| Bi | 44.9 | 40.2 | 26 | 12 | 43.5 | 7.0 | 6.5 | 40.7 | 10 | 41.5 | 8.0 |
| Th | — | n.d. | 0.85 | 9.6 | 0.807 | 0.867 | |||||
| U | — | 0.23 | 29 | 0.24 | 7.6 | 0.24 | 0.235 | ||||
| Analyte | Accepted values | University of Aberdeen | Ghent University | ||||||||
|---|---|---|---|---|---|---|---|---|---|---|---|
| New Wave Research, UP213b | New Wave Research, UP213c | New Wave Research, UP193HE | Microlas Lasersystem GmbH, GeoLas | ||||||||
| Average n = 9 | RSD | Δ% | Average n = 3 | RSD | Δ% | Measured | Δ% | Measured | Δ% | ||
| a <LoD = below limit of detection n.d. = not determined. b Laser in loan from ESI, New Wave Research, used for the method development and the first part of the study. c Second instrumental set-up, used for the remaining part of the study; the laser was a different, recently refurbished device. | |||||||||||
| [w/o] | |||||||||||
| SiO2 | 34.9 | 33.9 | 4.4 | 4.3 | 34.8 | 3.2 | 2.4 | 34.1 | 2.4 | 33.7 | 3.6 |
| Na2O | 1.07 | 1.01 | 6.8 | 6.7 | 1.05 | 4.2 | 3 | 0.787 | 36 | 1.08 | 0.8 |
| CaO | 5.07 | 5.85 | 12 | 12 | 5.58 | 6.4 | 8.9 | 6.81 | 26 | 5.05 | 0.37 |
| Al2O3 | 0.87 | 0.88 | 7.3 | 5.8 | 0.89 | 3.7 | 3.3 | 0.867 | 0.4 | 0.815 | 6.8 |
| MgO | 2.76 | 2.66 | 8.7 | 7.4 | 2.74 | 5.9 | 4.3 | 2.48 | 11 | 2.67 | 3.3 |
| K2O | 2.84 | 2.76 | 7.5 | 6.7 | 2.60 | 5.6 | 9.6 | 2.67 | 6.4 | 2.73 | 4.2 |
| PbO | 36.7 | 37.2 | 4.6 | 3.5 | 37.1 | 4.8 | 3.3 | 37.5 | 2.2 | 39.1 | 6.1 |
| [mg kg −1 ] | |||||||||||
| Li | 46.5 | 44.3 | 5.7 | 5.8 | 47.7 | 14 | 9.1 | 45.6 | 2.0 | 44.8 | 3.7 |
| Be | — | <LoD | 0.046 | 50 | <LoD | 0.025 | |||||
| B | 621 | 522 | 15 | 23 | 541 | 15 | 17 | 631 | 1.6 | 589 | 5.4 |
| P | 611 | 406 | 14 | 53 | 483 | 4.5 | 27 | 469 | 30 | 682 | 10 |
| S | — | n.d. | 1026 | 78 | 46 | 874 | 54 | 732 | 45 | ||
| Cl | 1000 | 920 | 13 | 14 | 997 | 16 | 12 | 910 | 9.9 | 1156 | 13 |
| Ti | 4736 | 4876 | 9.3 | 7.3 | 4613 | 7.5 | 6.4 | 4700 | 0.77 | 4265 | 11 |
| V | 33.6 | 39.7 | 11 | 14 | 37.9 | 4.7 | 11 | 38.7 | 13 | 36.8 | 8.8 |
| Cr | 6.84 | 15.4 | 13 | 55 | 16.7 | 13 | 58 | 18.8 | 64 | 16.0 | 57 |
| Mn | 6351 | 10.1 | 12 | 63000 |
10.0 | 12 | 64000 |
10.2 | 62000 |
10.6 | 60000 |
| Fe | 2643 | 2415 | 10 | 12 | 2415 | 4.8 | 9.6 | 2490 | 6.1 | 2391 | 10 |
| Co | 1416 | 1535 | 12 | 9.8 | 1350 | 2.0 | 4.9 | 1408 | 0.55 | 1445 | 2 |
| Ni | 157 | 151 | 8.9 | 7.6 | 150 | 3.8 | 4.9 | 161 | 2.0 | 159 | 1.3 |
| Cu | 9027 | 7997 | 10 | 14 | 7994 | 3.9 | 13 | 8864 | 1.8 | 9435 | 4.3 |
| Zn | 402 | 394 | 11 | 9.7 | 403 | 4.1 | 3.0 | 645 | 38 | 443 | 9.3 |
| Ga | — | 4704 | 58 | n.d. | n.d. | n.d. | |||||
| As | — | 2.07 | 28 | 2.50 | 24 | 2.59 | 4.67 | ||||
| Rb | 91.4 | 82.9 | 18 | 18 | 81.8 | 4.2 | 12 | 83.7 | 9.3 | 87.2 | 4.9 |
| Sr | 2452 | 3015 | 14 | 17 | 2612 | 2.2 | 6.1 | 2619 | 6.4 | 2600 | 5.7 |
| Y | — | n.d. | 0.32 | 51 | 3.39 | 0.22 | |||||
| Zr | 37.0 | 42.3 | 7.0 | 12 | 40.6 | 4.9 | 8.8 | 37.5 | 1.2 | 38.0 | 2.7 |
| Ag | 18.6 | 19.0 | 12 | 11 | 19.4 | 7.2 | 6.1 | 19.4 | 4.2 | 18.8 | 0.8 |
| Cd | — | n.d. | 0.73 | 3.2 | 1.09 | 0.953 | |||||
| Sn | 1497 | 1603 | 16 | 11 | 1468 | 2.2 | 2.3 | 1435 | 4.3 | 1702 | 12 |
| Sb | 251 | 1.22 | 13 | 21000 |
2.56 | 16 | 9800 | 1.62 | 15000 |
1.77 | 14000 |
| Ba | 102105 |
131998 |
17 | 21 | 127964 |
2.1 | 20 | 122015 |
16 | 123503 |
17 |
| La | — | n.d. | 0.24 | 3.7 | 2.87 | 0.607 | |||||
| Ce | — | 0.05 | 34 | <LoD | 0.161 | 0.0510 | |||||
| Pr | — | n.d. | <LoD | 0.0310 | <LoD | ||||||
| Nd | — | <LoD | <LoD | 0.048 | 0.0320 | ||||||
| W | — | n.d. | <LoD | 0.0870 | <LoD | ||||||
| Au | — | <LoD | <LoD | <LoD | <LoD | ||||||
| Bi | 8.97 | 42.8 | 35 | 78 | 41.3 | 14 | 78 | 48.3 | 81 | 46.7 | 81 |
| Th | — | n.d. | 0.20 | 4.7 | 0.189 | 0.186 | |||||
| U | — | 0.07 | 36 | 0.07 | 4.4 | 0.075 | 0.078 | ||||
The analysis performed at Ghent University with both instrumental set-ups rendered a bias for major and minor components and trace elements generally ranging from 0.1 and 10% and normally better than 20% (see Tables 3 and 4). Standards of the NIST 600 series showed exponentially poorer accuracy for increasingly lower concentrations for some of the analytes of the alkaline, alkaline-earth and transition metals. Cross-quantification of NIST 600 series standards, and in particular NIST 612 and 614, produced very large errors for elements and elemental oxides normally employed in the pigmentation and opacification of glass, and introduced in relatively high concentration (hundreds to thousands ppm) in ancient glasses. NIST 610 showed the lowest values, while NIST 614, whose certified and accepted analyte concentrations were often found to be close to the LoD measured for this technique, rendered the worse results (bias as high as 100%). This phenomenon could be related to the use of the method devised for the analysis of archaeological glasses (employing the response factors of CMG standards) in the quantitative analysis of glasses of the NIST 600 series. This effect did not affect higher masses, such as rare earth elements and the elements of the lanthanide series, which were quantified with high accuracy (bias normally between 0 and 5%) using both NIST and Corning standards. Repeatability was only calculated for NIST SRM 612, which was measured every few samples, and was found to be compatible with that calculated for analysis at the University of Aberdeen.
Reproducibility was calculated as the RSD between the results obtained for the same archaeological samples (Grandcourt Farm beads) and standards (NIST 600 and CMG series), measured with different instrumental set-ups at different laboratories. The results were very variable depending on the sample and analyte. Reproducibility in the analysis of SRM varied between 0.5 and 5%, and was generally better than 10%. Individual higher values (up to maximum 30%) were recorded for specific elements, and especially for CMG glasses, and in particular for the elements B, P, S and Ti. Reproducibility for many of the analytes in NIST SRM 614 (B, MgO, S, K2O, Ti, V, Cr, Fe, Co, As, Cd and PbO) is particularly poor, and is above 30%. This seems to be due to the low concentration of these elements and elemental oxides in the glass. For real samples, the reproducibility varied normally between about 5 and 20%, and was normally better than 35%. Higher values (up to 100% or above) were measured for specific elements difficult to detect (S) or highly volatile and in low concentrations (Ag) and for trace elements in a concentration close to their LoD, such as Cd, Au and Bi. These values account for both the differences between the various laboratory set-ups, and the intrinsic heterogeneity of the samples themselves.
Conclusions
This work showed that the most important issues for precise and accurate compositional analysis of early glasses are signal integration and data reduction. Calibration using sets of response factors, specifically selected to be used in the quantification of each analyte in each glass type, produced more accurate results than single-point calibration by conforming to the characteristics of the glass matrix being investigated and adapting the calibration range. This procedure is particularly important when using longer laser wavelengths, whereas measurements with 193 nm lasers seem to be less affected by the choice of the standards to be employed for quantification. However, when using the multi-standard ISI method, the large deviations from the expected values highlighted by the study led by Wagner for 266 nm lasers,48 which rendered this kind of lasers unsuitable for quantification purposes, were not found. Accuracy was instead highly improved for all instrumental set-ups investigated. For volatile elements in low concentration, this could be explained as a result of the data reduction process. Volatile analytes are prone to inaccuracy in the integration of the signal plateau, due to the tailing effect of the false maximum appearing at the start of the ablation process. Therefore, using response factors derived from standards in which the analyte is present in the same order of concentration, and is hence suffering from an equivalent tailing effect, will impact favourably on their quantification. This effect can be observed when quantifying the NIST 600 series glasses with the method devised for quantification of archaeological samples. The bias for some of the low concentration elements measured in NIST 612 and quantified using the method developed for Iron Age glasses, such as MgO, Na2O, Fe or PbO, can be as high as 50% and is reported as such. However, when exclusively using response factors calculated from other NIST 600 series for their quantification, the accuracy can be as good as 5%. Instead, the strategy used for the quantification of the archaeological specimens ensured high accuracy for CMG B, which is the glass that matches the compositional characteristics of the real samples more closely. By accurately selecting the response factor(s) to be used for quantification it is possible to adapt the calibration to suit specific glass compositions (e.g. the leaded opaque glasses used for decorations) and trace elements patterns.The cross-quantification of CMG standards confirmed that accepted published values for a set of analytes present in the matrix of these reference materials do not correspond to the actual composition measured. These elements are characterized by poor accuracy and high repeatability (Tables 3 and 4). The values put forward by this study are compatible with those proposed by Wagner et al.48
LoDs were found to be substantially lower for the analyses performed at Ghent University, especially when a short wavelength laser was coupled with the Thermo Scientific X Series II instrument. However, no outstanding difference was found in terms of accuracy and repeatability between measurements performed at either laboratory with different instruments. Inter-laboratory comparison of the results obtained from the analysis of analytical standards with different instrumental set-ups emphasized that the majority of the analytes showed a reproducibility normally ranging between 0.5 and 5%. These values are within the precision, accuracy and repeatability range, hence confirming the validity of all experimental set-ups used for compositional analyses of this kind. Reproducibility measured for a reduced pool of archaeological samples was found to be poorer. This is to be ascribed to the heterogeneity of the matrix of archaeological glasses that, although not markedly, contributed to the uncertainty of the measurement.
Acknowledgements
The authors are grateful to New Wave Research Inc. (UK) for the loan of their UP213 Laser Ablation system used for the performance of the first part of the study. We wish to thank Ms M.M. Wright, former Senior Curator (Conservation), and Mr N. Curtis, Head of Museums, University of Aberdeen Museums (formerly Marischal Museum), Aberdeen, Dr F. Hunter, Head of Later Prehistory and Early History at the National Museum of Scotland, Edinburgh, and Dr S. Malone and Mr T. Lane from Archaeological Project Services, Heckington, Lincolnshire, for providing the archaeological specimens tested in this study. The Corning Museum of Glass standards were obtained with courtesy of Dr R.H. Brill, Corning Museum Of Glass, New York. We greatly acknowledge the collaboration of Prof. J.A. Anderson and Dr P. Degryse. Thanks are due to Dr D. Martlew for his help in the field of ancient and historical glass. The study was funded by the College of Physical Science and by TESLA, University of Aberdeen, and by the Special Research Foundation (BOF) of Ghent University via a ‘Concerted Research Action’ (GOA) project. Andrei Izmer acknowledges FWO (Fonds Wetenschappelijk Onderzoek, Belgium) for his postdoctoral grant.Notes and references
- D. C. W. Sanderson, J. R. Hunter and S. E. Warren, J. Archaeol. Sci., 1984, 11, 53–69 CrossRef.
- E. V. Sayre and R. W. Smith, Science, 1961, 133, 1824–1826 CAS.
- A. Silvestri, G. Molin and G. Salviulo, Archaeometry, 2006, 48, 415–432 CrossRef.
- A. Shortland, N. Rogers and K. Eremin, J. Archaeol. Sci., 2007, 34, 781–789 CrossRef.
- A. Shortland, L. Schachner, I. Freestone and M. Tite, J. Archaeol. Sci., 2006, 33, 521–530 CrossRef.
- C. M. Jackson, Archaeometry, 2005, 47, 763–780 CrossRef CAS.
- C. M. Jackson, C. A. Booth and J. W. Smedley, Archaeometry, 2005, 47, 781–795 CrossRef CAS.
- L. R. Green and A. F. Hart, J. Archaeol. Sci., 1987, 14, 271–282 CrossRef.
- S. J. Fleming and C. P. Swann, Nuclear Instruments and Methods in Physics Research, Section B: Beam Interactions with Materials and Atoms, 1999, vol. 150, pp. 622–627 Search PubMed.
- R. Arletti, M. C. Dalconi, S. Quartieri, M. Triscari and G. Vezzalini, Appl. Phys. A: Mater. Sci. Process., 2006, 83, 239–245 CrossRef CAS.
- A. Silvestri, G. Molin and G. Salviulo, J. Archaeol. Sci., 2008, 35, 1489–1501 CrossRef.
- A. Silvestri, G. Molin and G. Salviulo, J. Archaeol. Sci., 2008, 35, 331–341 CrossRef.
- R. E. Russo, X. Mao, H. Liu, J. Gonzalez and S. S. Mao, Talanta, 2002, 57, 425–451 CrossRef CAS.
- P. J. Sylvester, Geostand. Geoanal. Res., 2006, 30, 197–207 CrossRef CAS.
- M. Strlič, V. S. Šelih and J. Kolar, Handbook on the Use of Lasers in Conservation and Conservation Science, COST office, Brussels, Belgium, 2008 Search PubMed.
- M. Bertini, PhD thesis, University of Aberdeen, 2012.
- L. Dussubieux, P. Robertshaw and M. D. Glascock, Int. J. Mass Spectrom., 2009, 284, 152–161 CrossRef CAS.
- F. S. Durrant, J. Anal. At. Spectrom., 1999, 14, 1385–1403 RSC.
- L. Halicz and D. Günther, J. Anal. At. Spectrom., 2004, 19, 1539–1545 RSC.
- S. Becker and P. Weis, Presented at Trace Evidence Symposium, Clearwater Beach, Florida, 2007 Search PubMed.
- K. Smith, T. Trejos, R. J. Watling and J. Almirall, At. Spectrosc., 2006, 27, 69–75 CAS.
- P. Weis, M. Dücking, P. Watzke, S. Menges and S. Becker, J. Anal. At. Spectrom., 2011, 26, 1273–1284 RSC.
- A. E. Koenig, Microsc. Microanal., 2008, 14(supplement), 1270–1271 Search PubMed.
- M. S. Eggins and M. G. Shelley, Geostand. Newsl., 2002, 26, 269 CrossRef.
- P. Weis, M. Dücking, P. Watzke, S. Menges and S. Becker, J. Anal. At. Spectrom., 2011, 26, 1273–1284 RSC.
- M. Gaboardi and M. Humayun, J. Anal. At. Spectrom., 2009, 24, 1188–1197 RSC.
- B. Hattendorf, C. Latkoczy and D. Günther, Anal. Chem., 2003, 75, 341–347 CrossRef.
- Z. Chen, J. Anal. At. Spectrom., 1999, 14(12), 1823–1828 RSC.
- M. Guillong, K. Hametner, E. Reusser, S. A. Wilson and D. Günther, Geostand. Geoanal. Res., 2005, 29, 315–331 CrossRef CAS.
- M. Guillong, I. Horn and D. Günther, J. Anal. At. Spectrom., 2003, 18, 1224–1230 RSC.
- M. Motelica-Heino and O. F. X. Donard, Journal of Geostandards and Geoanalysis, 2001, 25, 345–359 CrossRef CAS.
- M. Resano, E. Garcia-Ruiz and F. Vanhaecke, Mass Spectrom. Rev., 2010, 29, 55–78 CAS.
- V. Van Der Linden, P. Cosyns, O. Schalm, S. Cagno, K. Nys, K. Janssens, A. Nowak, B. Wagner and E. Bulska, Archaeometry, 2009, 51, 822–844 CrossRef CAS.
- Y. Liu, Z. Hu, S. Gao, D. Günther, J. Xu, C. Gao and H. Chen, Chem. Geol., 2008, 257, 34–43 CrossRef CAS.
- J. T. vanElteren, N. H. Tennent and V. S. Šelih, Anal. Chim. Acta, 2009, 644, 1–9 CrossRef CAS.
- P. Robertshaw, M. Wood, E. Melchiorre, R. S. Popelka-Filcoff and M. D. Glascock, J. Archaeol. Sci., 2010, 37, 1898–1912 CrossRef.
- M. Bertini, A. Shortland, K. Milek and E. M. Krupp, J. Archaeol. Sci., 2011, 38, 2750–2766 CrossRef.
- B. Gratuze, M. Blet-Lemarquand and J. Barrandon, J. Radioanal. Nucl. Chem., 2001, 247, 645–656 CrossRef CAS.
- M. Guido, The Glass Beads of the Prehistoric and Roman Periods in Britain and Ireland, Society of Antiquaries of London, Thames and Hudson, London, 1978 Search PubMed.
- F. Hunter, The Glass Artefacts and Glass-working Debris from Culduthel: typology, Discussion and Catalogue, National Museum of Scotland, Edinburgh, 2011, unpublished work Search PubMed.
- M. Davis and I. Freestone, Analysis of the Glass Objects (Report for National Museum of Scotland), Edinburgh, 2011, unpublished work Search PubMed.
- R. H. Brill, Chemical Analyses of Early Glass, Volume 1 and 2, The Corning Museum of Glass, New York, USA, 1999 Search PubMed.
- E. P. Vicenzi, J. Res. Natl. Inst. Stand. Technol., 2002, 107, 719–727 CrossRef CAS.
- W. P. Reed, Certificate of analysis SRM 610-611, Trace Elements in a Glass Matrix, National Institute of Standards and Technology, Gaithersburg, USA, 1992 Search PubMed.
- W. P. Reed, Certificate of analysis SRM 612-613, Trace Elements in a Glass Matrix, National Institute of Standards and Technology, Gaithersburg, USA, 1992 Search PubMed.
- W. P. Reed, Certificate of analysis for SRM 614-615, Trace Elements in a Glass Matrix, National Institute of Standards and Technology, Gaithersburg, USA, 1992 Search PubMed.
- K. P. Jochum and F. Nehring, NIST 610, 612, 614, GeoReM Preferred Values (11/2006), GeoReM. Max-Planck-Institut für Chemie, Mainz, Germany, http://georem.mpch-mainz.gwdg.de/, 2006 Search PubMed.
- B. Wagner, A. Nowak, E. Bulska, K. Hametner and D. Günther, Anal. Bioanal. Chem., 2012, 402, 1667–1677 CrossRef CAS.
- A. Aerts, B. Velde, K. Janssens and W. Dijkmanc, Spectrochim. Acta, Part A, 2003, 58, 659–667 Search PubMed.
- J. S. Kane, Geostand. Newsl., 1998, 22, 15–31 CrossRef CAS.
- R. W. Hinton, Geostand. Newsl., 1999, 23, 197–207 CrossRef.
- L. Kempenaers, K. Janssens, K. P. Jochum, L. Vincze, B. Vekemans, A. Somogyi, M. Drakopoulosc and F. Adams, J. Anal. At. Spectrom., 2003, 18, 350–357 RSC.
- C.-T. A. Lee, Laser Ablation Data Reduction, Department of Earth Science, Rice University, Houston, Texas, 2006, http://www.ruf.rice.edu/~ctlee/ Search PubMed.
- H. P. Longerich, S. E. Jackson and D. Günther, J. Anal. At. Spectrom., 1996, 11, 899–904 RSC.
- J. Kragten, Calculating standard deviations and confidence intervals with a universally applicable spreadsheet technique, Analyst, 1994, 119, 2161–2166 RSC.
- S. E. Jackson, in Laser Ablation ICP-MS in the Earth Sciences, Current Practices and Outstanding Issues, ed. P. Sylvester, Mineralogical Association of Canada, Short Course 40, Vancouver, B.C., 2008, ch. 11, pp. 169–188 Search PubMed.
- M. S. A. Horstwood, in Laser Ablation ICP-MS in the Earth Sciences: Current Practices and Outstanding Issues, ed. P. Sylvester, Mineralogical Association of Canada, Short Course 40, Vancouver, B.C., 2008, ch. 16, pp. 283–303 Search PubMed.
Footnote |
| † Electronic supplementary information (ESI) available. See DOI: 10.1039/c2ja30036b |
| This journal is © The Royal Society of Chemistry 2013 |