Investigation at the nanometre scale on the corrosion mechanisms of archaeological ferrous artefacts by STXM
A.
Michelin
a,
E.
Drouet
a,
E.
Foy
a,
J. J.
Dynes
b,
D.
Neff
a and
P.
Dillmann
*a
aLAPA SIS2M UMR3299 CEA/CNRS and IRAMAT UMR5060 CNRS, CEA Saclay, 91191 Gif sur Yvette Cedex, France. E-mail: philippe.dillmann@cea.fr
bCanadian Light Source, 101 Perimeter road, Saskatoon, SK S7N 0X4, Canada
First published on 26th October 2012
Abstract
For the first time, corrosion products of a 450 year old archaeological iron nail were investigated at the nanometer level using STXM. NEXAFS acquisitions at the Fe L-edge were performed on a thin film taken of the metal–corrosion products including the interface. Comparison with Fe L-edge reference spectra gathered on maghemite (Fe2O3), magnetite (Fe3O4), siderite (FeCO3), chukanovite (Fe2(OH)2CO3) and metallic iron (Fe) showed the presence of an interfacial layer of about 100 nm at the metal–corrosion product interface consisting of maghemite and magnetite. Further from this interface, corrosion products are mainly constituted of Fe-carbonates, as well as smaller quantities of iron oxides, probably maghemite. These results support the hypothesis of the presence of a nanolayer controlling the corrosion processes at the metal–corrosion product interface, proposed during former studies at the macroscopic and microscopic levels. They also bring important new insights for the prediction of very long term corrosion of steels, especially into the fields of cultural heritage conservation and storage of nuclear wastes.
1 Introduction
The study of long term corrosion mechanisms of iron and ferrous alloys is an important issue in several domains of research, including the conservation and monitoring of iron cultural heritage artefacts and in designing nuclear waste storage containers. On the one hand, for iron cultural heritage artefacts, already exhibiting corrosion effects, the diagnoses of the alteration state1,2 can provide an understanding of previous corrosion mechanisms and help for setting up in situ conservation of the artefacts on archaeological sites.3 On the other hand, it is envisioned that the safe storage of nuclear waste will use various materials to form multibarriers separating the radioelements from the biosphere. In many countries4 (e.g., France5 or Japan6), a carbon steel container will be part of this barrier and will play a key role in the first 1000 year confinement period. To predict the long term stability of these carbon steel containers, under various corrosion conditions, requires that the modeling of corrosion mechanisms,7 especially at the micro and nanolevels,8 be undertaken. In this context, the study of archaeological iron artefacts, considered as analogues for steel containers exposed to the environment for long periods, is a key, complementary step to other approaches such as simulated systems (integral experiments) in the laboratory, to understand the effect of the specific long-term-parameter.9 The ancient iron-based alloys contain very low amounts of minor elements because of the low temperature of the ancient ore-smelting processes. Despite being more heterogeneously distributed, the carbon content of archaeological ferrous artefacts is always compatible with the one of the low alloyed steels envisaged in the context of the nuclear waste storage. Among the different environments concerned with the long term corrosion of iron, anoxic carbonated media are particularly crucial. Numerous archaeological sites (mainly in the north of Europe) contain iron artefacts conserved in situ under these conditions.10,11 Moreover, in deep nuclear waste storage facilities, low alloy steel canisters, in contact with clay in anoxic carbonated water, may be subjected to corrosion.8,12,13 For that reason, the study of corrosion mechanisms in carbonated media has been undertaken for several years, on simulated systems13–18 and archaeological iron analogues (e.g. nails).19–23On both systems, the characterization of corrosion products at the microscale were previously conducted using analytical tools such as μX-ray Diffraction, μRaman spectroscopy, and Scanning Electron Microscopy coupled to EDX. The corrosion products were mainly composed of siderite (FeCO3) and/or chukanovite (Fe2(OH)2CO3),14,22,24–26 sometimes locally mixed with microsized unconnected islets of iron oxides such as magnetite (Fe3O4). The total thickness of the corrosion layer reached several μm after a few years in simulated systems, while in archaeological analogues it was several hundred μm after a few hundred years of corrosion. Actually crucial issues remain to understand the behavior of this system. The micrometer thick corrosion layers are porous, allowing water to penetrate through a network of micro and nanopores toward the metal surface.27 Some authors propose that this thick corrosion layer plays a protective role by slowing down the transport of dissolved ions, to and away from the metal surface, through the water saturated nanoporous network.20 One of the main questions yet to be answered is what phenomenon controls the rate of the reactions (i.e., kinetics). In contrast, some electrochemical studies on simulated systems28,29 suggest the presence of a nonporous and compact interfacial nanometric corrosion layer located between the metal and the rest of the corrosion products, which may consequently control the kinetics. This assertion is also based on the fact that the passive electrochemical behavior was observed on mild steel coupons immersed in water saturated with CO2 over a very short term (64 hours).30 Some Grazing Incidence X-ray Diffraction coupled to EDX-TEM observations suggested that the nanolayer could be an iron oxide. The same kind of passive films was studied on iron corroded during short periods in anaerobic borate buffer solutions (neutral or slightly alkaline pH). In situ XRD Synchrotron Radiation experiments31,32 and XPS studies33 suggested that the iron was covered with a spinel iron oxide layer (Fe3−δO4) intermediate between magnetite (δ = 0) and maghemite (δ = 1/3).29 Nevertheless, this nanolayer has never been observed using physico-chemical characterization methods on very long term systems. One of the reasons is because the presence of the thick corrosion layer separating the interfacial nanolayer from the outer part of the artefacts could not be detected using the surface/macrobeam techniques mentioned above (GXRD, XPS, …).
X-ray absorption spectroscopy (XAS) can provide information on the atomic and molecular structure of materials, such as on the oxidation state, ligand type and coordination geometry.34 Scanning Transmission X-ray Microscopy (STXM), which uses the near-edge X-ray absorption fine structure (NEXAFS), can map the speciation of metals (e.g., oxidation state) with a spatial resolution near 25 nm.35 Thus, the aim of this study is to investigate, especially at the metal–corrosion products interface, the corrosion layers formed on an archeological nail corroded in anoxic carbonated water for 450 years20,22,36 using STXM at the Fe L-edge. Moreover, Dynes et al.35 proposed a methodology to perform a semi-quantitative evaluation of the proportion of different phases constituting a thin film. The same approaches were attempted here. To our knowledge this is the first time that STXM has been used to study corrosion and these first results will lead to new insight into the corrosion processes.
2 Materials and experimental methods
2.1 Sample preparation
The sample was taken from a nail, excavated in 2010 from the archaeological site of Glinet (Seine Maritime, France), an ancient iron-making site of the 16th century AD. On site measurements of the water composition indicated that the nail, taken at approximately 1 m depth, corroded in an anoxic environment for over 450 years.21,36 Since the excavation, the nail was stored in a chamber under N2 atmosphere.All the preparation stages were performed under N2 atmosphere in a glove box. The nail was embedded in epoxy resin and transverse sections using a diamond saw and non-aqueous lubricant were taken perpendicular to the corrosion system (including metal and corrosion products). For more details see Saheb et al.21,26 Observations and structural analyses at the micrometre scale were performed using optical microscopy, scanning electron microscopy (SEM) and Raman microspectroscopy to identify and locate precisely the phases inside the corrosion layer. It also allowed us to select a representative zone for the present study. This microscopic description of the corrosion system is not questioned here and can be found in ref. 22. It corresponds to the one evocated in the introduction part (i.e. a layer chiefly made of iron carbonates as chukanovite and siderite embedding unconnected islets of magnetite oxides).
In order to investigate the corrosion at the nanometre level, a thin film was taken using the Focused ion beam (FIB) in situ lift-out method37 on the transverse section, at the metal–corrosion layer interface (Fig. 1). Milling was performed with a FEI Strata 235 Dual Beam FIB system at the Institute of Electronics Microelectronics and Nanotechnology (IEMN) of Lille. A thin protection layer of platinum was deposited onto the interface metal–corrosion layer of interest. A 5 kV Ga+ beam operating at the 300 pA current was used to obtain a slice of about 100 nm thick. The in situ lift-out technique allows the sample to be fixed to a TEM-grid inside the Dual beam Instrument without exposure to the atmosphere. Moreover, once the sample is fixed to the grid, it can be thinned further and an additional plasma cleaning can be applied to improve the quality of the foil. Finally a ∼15 μm × 12 μm × ∼80 nm thin film is obtained.
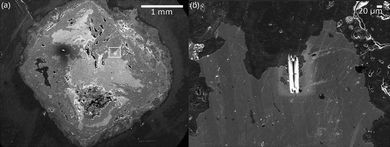 | ||
| Fig. 1 (a) SEM microphotograph of the transverse section of the nail. The rectangle shows the location of the FIB milling zone. (b) SEM microphotograph of the metal–oxide interface where the FIB section was taken. | ||
2.2 STXM analysis
STXM coupled with Fe L2,3-edge (2p1/2,3/2 → 3p) NEXAFS was carried out at the 10ID-1 beamline of the Canadian Light Source (CLS, Saskatoon)38 and at the PolluX beamline of the Swiss Light Source (SLS, Villigen). At the CLS, NEXAFS image sequences (i.e., stacks) were acquired with a spot resolution of 20–30 nm between 698 and 780 eV, with a 0.9 eV increment between 698 and 704 eV, 0.15 eV between 710 and 725 eV and 3 eV between 725 and 780. At the SLS the acquisition conditions were: 0.5 eV between 694 and 706 eV, 0.3 eV between 706 and 726 eV and 0.5 eV between 726 and 780 eV. The measured transmitted signals (I) were converted to optical density (i.e., absorbance, OD = −ln(I/I0)) using the incident flux (I0) measured in the absence of the sample. All processing was performed using aXis2000.392.3 References
On each beamline, Fe L-edge spectra were acquired on reference powder samples of magnetite and maghemite (γ-Fe2O3) from Alfa Aesar deposited on TEM copper grids covered with a carbon film. In addition, a siderite powder courtesy of the Museum National d'Histoire Naturelle (Paris-France) was analysed. A chukanovite reference powder was synthetized in our laboratory following the procedure of Savoye et al.40 Lastly, a metallic iron thin film was prepared under anoxic conditions on an ARMCO iron sample in order to obtain a Fe(0) reference. All reference spectra were extracted from image sequences using threshold masking of the pixels with the highest intensity to select the best zone.Spectra were normalized to an absolute linear absorbance scale. Absolute linear absorbance is the optical density (OD) per unit path length of a pure material of defined density. An absolute linear absorbance scale is established by adjusting the intensity scale of the reference spectrum to that of the computed elemental response outside the structured near edge region.35 This expected elemental response was calculated from the elemental composition and densities: 3.70, 3.96, 4.9, 5.15 and 7.9 g cm−3 for chukanovite, siderite, maghemite, magnetite and metal (Fe), respectively. Singular value decomposition was used to derive quantitative maps from the Fe 2p image sequences by fitting the spectrum at each pixel to a linear combination of the reference spectra suspected to be present.35
3 Results and discussion
Fig. 2 presents the Fe 2p reference spectra of chukanovite, siderite, maghemite, magnetite and of the metal. There is a good agreement with the Fe L-edge X-ray absorption spectra already published for magnetite,41,42 and for maghemite.43,44 Boulard et al.45 published a STXM spectrum acquired at the Fe L-edge on siderite formed under high pressure conditions (55 GPa), which is similar to the one shown here. Moreover the general shape of our siderite reference spectrum is very similar to the EELS L-edge Fe spectrum obtained on siderite.46 The spectrum obtained on the metallic iron is in good agreement with the data already published.47,48 To our knowledge, the Fe L-edge spectrum for chukanovite has previously not been published.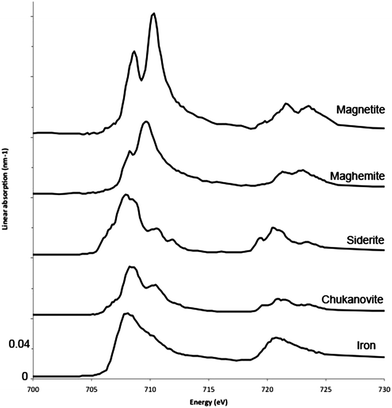 | ||
| Fig. 2 X-ray absorption spectra at the Fe 2p edge of metallic iron (Fe0), chukanovite (FeII2(OH)2CO3), magnetite (FeII,III304), siderite (FeIICO3), maghemite (FeIII2O3) reference compounds. Spectra obtained at CLS 10-ID1 beamline. | ||
In addition to the coordination and crystal field strength, the L2,3-edges from the 3d transition elements exhibit structures that are very sensitive to the valence state of the investigated atom. Generally, the Fe L3-edge of Fe species exhibit a double peak shape. For divalent Fe the first peak of the doublet (e.g., siderite, chukanovite, ∼708 eV) is higher than the second peak, while for trivalent Fe the second peak of the doublet (e.g., maghemite, ∼710) is higher than the first peak.46 Magnetite is a mixed valence 1/3 Fe(II)–2/3 Fe(III) compound, its Fe 2p L3-edge spectra doublet is more like that of an Fe3+ species. The Fe L2-edge exhibits three peaks for divalent Fe species, while only 2 for the trivalent Fe species, and the L2 peaks of the Fe2+ species occur at a lower energy than that of the Fe3+ species. There is also variation in the peak position and shapes of the Fe species presented here that enable them to be differentiated from each other.
Several stacks of the metal–corrosion products interface were gathered at various locations on the thin film made of the archaeological nail. The image sequences (i.e., stacks) were fitted by singular value decomposition (SVD) linear regression using siderite, maghemite and metallic iron, which have Fe 2p line shapes characteristic of Fe(II), Fe(III) and Fe(0) species, respectively. The derived composite maps for one of the stacks show the Fe(II), Fe(III) and Fe(0) component maps in the thin film (Fig. 3a). The color-coded composite maps for all the stacks taken from the thin film are reported on a global SEM view of the thin film (Fig. 3b). This approach gives a first rough interpretation of the variation of the degree of Fe oxidation on the thin film.
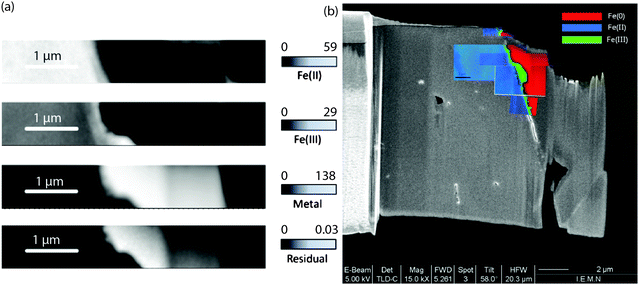 | ||
| Fig. 3 (a) Component maps of the Fe(III), Fe(II) and Fe(0) species derived by fitting the Fe 2p image sequences with the siderite, maghemite and metal reference spectra using singular value decomposition (SVD). The gray scales for the Fe(II), Fe(III) and Fe(0) component maps indicate the equivalent thickness (nm), while for the residual map optical density. (b) Overlay of the color-coded composite map of the Fe(0), Fe(II) and Fe(III) component maps for the image sequences from different regions of the thin film on the SEM microphotograph. | ||
The outer part of the corrosion products are chiefly composed of Fe(II) species as showed by former observations using Raman spectroscopy at the micrometer level, which detected siderite and/or chukanovite as the main phases at this location.22 Another very interesting fact is the presence of a zone with a higher Fe(III) concentration at the metal–corrosion product interface. This layer has a thickness (measured perpendicularly to the metal–corrosion product interface) of about 100 nm but can be locally thicker reaching hundreds of nanometers.
In order to obtain more detailed information on the Fe species of the different zones, threshold masking used to extract representative spectra from various regions of the component maps based on the pixel intensity. In the metallic zone (red zone on the color map), the extracted spectra were often saturated, due to the high absorbance of the sample, however, it was possible, in some thinner zones, to obtain data in good agreement with the Fe(0) iron reference spectra (Fig. 4). This observation verifies that the thin film was not oxidized during the preparation of the FIB section.
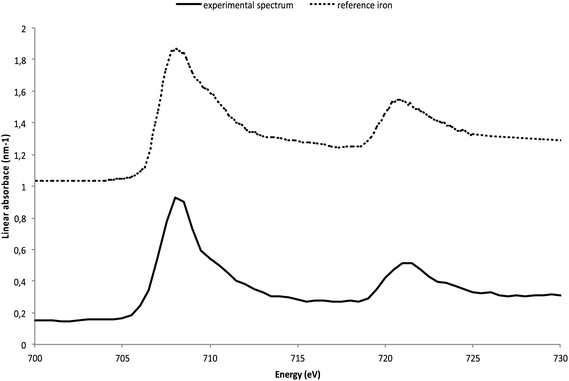 | ||
| Fig. 4 The Fe 2p spectrum extracted from the thinner regions of the Fe(0) component map compared to the metallic iron reference spectrum. | ||
Fig. 5 presents the spectrum extracted at the metal–corrosion interface on the area corresponding to the “Fe(III)” zone on the color-coded composite map presented in Fig. 3. This extracted spectrum verifies that the Fe species at the metal–corrosion interface is predominantly an Fe3+ species. A curve fit35 of the extracted spectrum, using different combinations of the reference compounds (i.e. iron, maghemite, magnetite, chukanovite and siderite), was used to determine the Fe species. Table 1 presents the results for different simulations. The best fit obtained, with positive contribution of the reference phases corresponds to a mix of maghemite and magnetite. Compared to the pure reference spectra of maghemite and magnetite, the peak of the L3 contribution of the experimental spectrum is in-between that of the references. Moreover, on the obtained fit, the resolution of the double peaks of the L3 band is not apparent, confirming that the spectra of interest is a combination of the two references. This result suggests that a spinel oxide intermediate between magnetite and maghemite constitutes the interface layer, as suggested in the literature.29,31,32 The proportion between magnetite and maghemite is about 1/3.
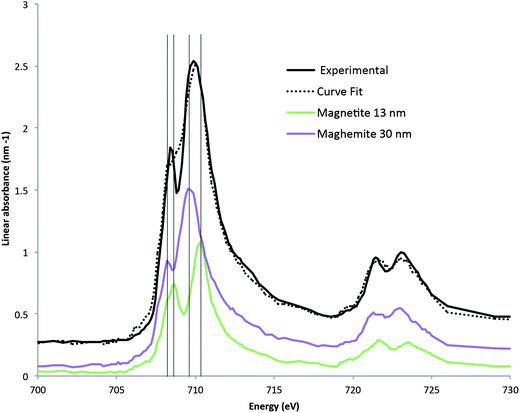 | ||
| Fig. 5 The spectrum extracted from the Fe(III) zone of the thin film, and the magnetite and maghemite reference spectra. The linear fit of using maghemite and magnetite reference spectra to the extract Fe(III) spectrum. | ||
| Combination of reference phases | Equivalent thicknesses (nm) | R 2 | F-test |
|---|---|---|---|
| Maghemite/magnetite | 30/13 | 0.7 | 4860 |
| Maghemite/magnetite/iron | 33/13/−4 | 0.56 | 4030 |
| Magnetite/siderite | 31/−2 | 3.5 | 892 |
| Maghemite/iron | 28/4 | 3.5 | 923 |
| Siderite/iron | −20/54 | 5.4 | 100 |
| Maghemite/magnetite/siderite | 31/13/−5 | 0.4 | 5460 |
| Maghemite/magnetite/chukanovite | 33/15/−10 | 0.45 | 4940 |
| Maghemite/magnetite/siderite/iron | 30/14/−7/2 | 0.4 | 4190 |
Spectra were extracted from the Fe(II) component maps (Fig. 3) using threshold masking, at about 50 nm intervals, parallel to the Fe(III)/Fe(II) interface (Fig. 6). The general features for the spectra obtained are similar, with the major L3 peak located at 708 eV and L2 containing 3 peaks, indicating the presence of Fe(II) species. None of these spectra correspond to a pure carbonate phase (i.e., siderite nor chukanovite). Moreover, several small relative intensity variations can also be observed especially in the L3 contribution of the different spectra. The same curve fitting procedure used for the spectrum extracted at the metal–corrosion interface was followed to gain insight into the Fe(II) species. Table 2 shows the fit results for different combinations of reference compounds that are used for modeling the spectrum extracted at 300 nm from the interfacial layer (Fig. 7). For all the spectra, the best combination without negative contribution corresponds to a mix of maghemite, chukanovite and siderite. An important observation is that magnetite never appears to be necessary to model the experimental spectra as negative values are always calculated when it is used.
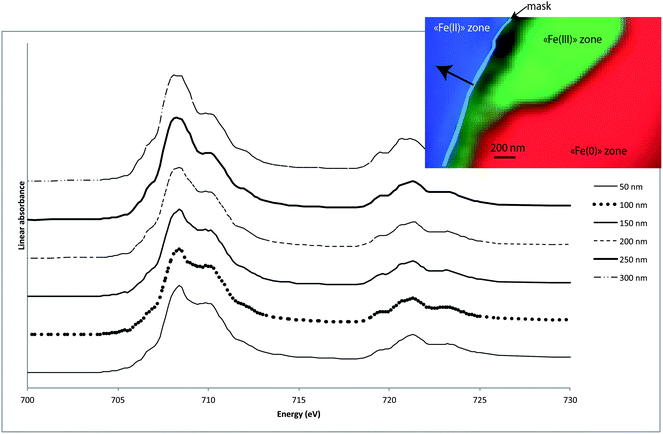 | ||
| Fig. 6 The spectra extracted from the Fe(II) component maps (50 nm mask parallel to the interface – see RGB map), at specific distances from the “Fe(III)” zone. | ||
| Combination of reference phases | Equivalent thicknesses (nm) | R 2 | F-test |
|---|---|---|---|
| Siderite/maghemite | 51/21 | 1.27 | 3550 |
| Siderite/magnetite | 50/12 | 2.28 | 1950 |
| Chukanovite/siderite/magnetite | 59/26/−1 | 0.87 | 3450 |
| Chukanovite/siderite/maghemite | 37/34/9 | 0.61 | 4960 |
| Chukanovite/siderite/maghemite/magnetite | 46/39/12/−4 | 0.51 | 4400 |
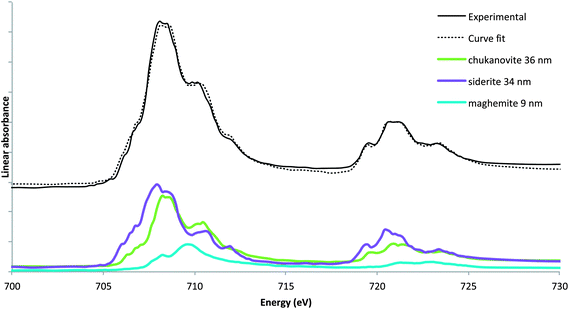 | ||
| Fig. 7 Spectrum extracted at 300 nm from the interfacial layer in the “Fe(II)” zone of the thin film and linear fit using chukanovite, siderite and maghemite. Pure reference spectra used to fit the experimental spectra. | ||
Fig. 8 presents the equivalent thicknesses of siderite, chukanovite and maghemite calculated for each spectra extracted at 50 nm intervals from the Fe(III)/Fe(II) interface. The thickness of chukanovite remains relatively constant while the thickness of siderite increases with the distance from the interfacial zone. This trend was also observed at the microscopic level by former studies and can be explained by carbonate ion concentration gradient in the corrosion layer, influencing the equilibriums between the two phases.22,49 The presence of maghemite is observed all along the profile with equivalent thicknesses between 10 and 18 nm.
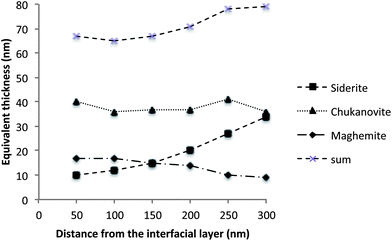 | ||
| Fig. 8 Equivalent thicknesses of the different phases obtained from the fit of the extracted spectra. | ||
These observations lead to several important deductions. First, at several hundred nanometers from the interface, it seems that the corrosion products are not only constituted of iron(II) carbonates (siderite and chukanovite) but also of smaller quantities of Fe(III) containing species, such as maghemite. This mix seems to occur at a very fine scale because it was not possible to discriminate any single phase at the STXM resolution operating in transmission mode (volume of about 20 × 20 × 80 nm). The presence of Fe(II)/Fe(III) phase mixes at the nanoscale was previously proposed by the authors50 to explain the relatively low resistivity of the corrosion layer that is mainly composed of carbonates. The present study seems to exclude the presence of magnetite, a phase with a very low resistivity (ρ = 3 × 10⁻³ Ω m). More likely, the presence of maghemite, which also has a relatively low resistivity (ρ = 5 × 10⁻³ Ω m),51 mixed with Fe(II) carbonate species at the nano-level, could explain the low resistivity of the layer observed at the microscopic and macroscopic levels by constituting a conductive network inside an insulating matrix of carbonates.
The other crucial observation is the presence of a specific layer, of about 100 nm thick at the interface between metal and corrosion products, which separates the outer carbonate layer from the metal. The fit of the spectrum extracted at this location shows that this layer is composed of iron oxides, magnetite and maghemite. This first direct observation using physico-chemical analytical methods confirms the presence of a specific layer at this location, proposed by several authors for the long term systems.14,15,24,28 The phase proportion observed here based on the curve fit analysis is 1/3 magnetite and 2/3 maghemite. The interfacial layer could also be composed of an intermediate between magnetite and maghemite as proposed by Davenport.31 It is therefore very similar to the passive film observed on low alloy steel coupons in the same environment at very short terms.30 This layer is proposed by these authors to control the corrosion kinetics because of its specific physical properties (very low porosity, conductivity, etc.). For that reason, in the case of the presence of such a barrier layer, a specific model (i.e. the point defect model)29,52,53 is used to describe the system behavior. Nevertheless, it has to be stressed that the thickness of the interfacial passive layer developed at very short term and evocated in the model is at least one order of magnitude thinner than the one observed here. Thus, in further steps of the research, the exact properties of this long term interfacial layer have to be studied (especially its porosity, homogeneity and conductivity) to decipher if this 100 nm layer observed after 450 years of corrosion is directly derived of the initial passive layer of several nanometers that forms on such systems on short terms, or is linked to a relatively different corrosion and formation mechanism. These objectives will be crucial in the next years for modeling very long term anoxic corrosion.
4 Conclusion
The investigation of the metal–corrosion products in ferrous metal systems corroded in anoxic carbonated media by STXM revealed the unique potential of the method to further our understanding of corrosion mechanisms. Here, studies at the Fe L-edge indicated that there was a nanometric continuous layer of about 100 nm at the metal–corrosion interface, consisting of a mix of iron oxides (maghemite and magnetite) or an intermediary compound between these two phases. This supports the hypothesis that the presence of an oxide barrier layer at the metal–corrosion interface, which controls the corrosion properties of the system. The physical properties of this layer must be investigated in the future to bridge the gap between the laboratory observations made on short term samples corroded under the same conditions as that of the archaeological nail. Beyond the metal–corrosion interface the corrosion products were mainly Fe(II) carbonate species (siderite and chukanovite), with a small amount of Fe(III) species. The presence of Fe(III) species in the carbonated corrosion products may explain the conductive behavior of this system, revealed by previous studies at the micrometer level. These results should consequently be taken into account by the model. Lastly these results illustrate that STXM complements very efficiently other methods (e.g., TEM) when studying materials at the nanolevels. The specific advantage of STXM is to combine high spatial resolution investigations with chemical selectivity linked to the X-ray absorption edge. This seminal study using STXM on corroded ferrous metals opens the way to further observation on other systems, especially on short term laboratory corroded samples.Acknowledgements
We wish to thank Karim Benzerara who introduced us to the STXM technique and provided us with preliminary results on the samples, the team members of the CLS and SLS STXM beamlines and Danielle Arribet Deroin, archaeologist of the Glinet site, for providing us with the samples. The SM beamline is builded on the Canadian Light Source, which is supported by the Natural Sciences and Engineering Research Council of Canada, the National Research Council Canada, the Canadian Institutes of Health Research, the Province of Saskatchewan, Western Economic Diversification Canada, and the University of Saskatchewan. This work was partly funded by the GL-VFA research program of ANDRA Agency (France).Notes and references
- D. A. Scott and G. Eggert, Iron and Steel in Art: Corrosion, Colorants, Conservation, Archetype Publications Ltd, Plymouth, 2009 Search PubMed.
- P. Dillmann, G. Béranger, P. Piccardo and H. Mathiesen, Corrosion of Metallic Heritage Artefacts: Investigation, Conservation and Prediction of Long Term Behaviour (EFC 48), Woodhead publishing, Cambridge, 2007 Search PubMed.
- B. Sørensen and D. Gregory, Metal 98 Conference on Metals Conservation, Draguignan-Figanières, France , 1998 Search PubMed.
- R. B. Rebak, in Uhlig's Corrosion Handbook, ed. R. W. Revie, Wiley, 2011, pp. 503–516 Search PubMed.
- D. Feron, D. Crusset and J. M. Gras, Corrosion, 2009, 65, 213–223 CrossRef CAS.
- H. Yoshikawa, E. Gunji and M. Tokuda, J. Nucl. Mater., 2008, 379, 112–117 CrossRef CAS.
- F. Cattant, D. Crusset and D. Feron, Mater. Today, 2008, 11, 32–37 CrossRef CAS.
- Prediction of Long Term Corrosion Behaviour in Nuclear Waste Systems, ed. D. Feron and D. D. Macdonald, Maney, London, 2001 Search PubMed.
- D. Neff, M. Saheb, J. Monnier, S. Perrin, M. Descostes, V. L'Hostis, D. Crusset, A. Millard and P. Dillmann, J. Nucl. Mater., 2010, 402, 196–205 CrossRef CAS.
- E. Jorgensen and P. Vang Petersen, in The Spoils of Victory: The North in the Shadow of the Roman Empire, ed. L. Jorgensen, B. Storgaard and L. Thornsen, National Museum of Denmark, 2003, pp. 258–287 Search PubMed.
- H. Matthiesen, E. Salomonsen and B. Sørensen, J. Archaeol. Sci., 2004, 31, 1451–1461 CrossRef.
- N. R. Smart, D. J. Blackwood and L. Werme, Corrosion, 2002, 58, 547–559 CrossRef CAS.
- N. R. Smart, A. P. Rance, L. Carlson and L. O. Werme, Mater. Res. Soc. Symp. Proc., 2006, 932, 813–820 CrossRef CAS.
- M. L. Schlegel, C. Bataillon, C. Blanc, D. Prêt and E. Foy, Environ. Sci. Technol., 2010, 44, 1503–1508 CrossRef CAS.
- F. Papillon, M. Jullien and C. Bataillon, Prediction of Long Term Corrosion Behaviour in Nuclear Wastes System, Cadarache, France, 2001 Search PubMed.
- N. R. Smart, D. J. Blackwood and L. O. Werme, Corrosion, 2002, 58, 547–559 CrossRef CAS.
- G. De Combarieu, P. Barboux and Y. Minet, Phys. Chem. Earth, 2007, 32, 346–358 CrossRef.
- N. Taniguchi, M. Kawasaki, S. Kawakami and M. Kubota, Prediction of Long Term Corrosion Behaviour in Nuclear Waste Systems, Proceedings 2nd International Workshop, Nice, 2004 Search PubMed.
- E. Vega, P. Berger and P. Dillmann, Nucl. Instrum. Methods Phys. Res., Sect. B, 2005, 240, 554–558 CrossRef CAS.
- D. Neff, P. Dillmann, L. Bellot-Gurlet and G. Beranger, Corros. Sci., 2005, 47, 515–535 CrossRef CAS.
- M. Saheb, D. Neff, P. Dillmann, H. Matthiesen and E. Foy, J. Nucl. Mater., 2008, 379, 118–123 CrossRef CAS.
- M. Saheb, D. Neff, J. Demory, E. Foy and P. Dillmann, Corros. Eng., Sci. Technol., 2010, 45, 381–387 CrossRef CAS.
- H. Matthiesen, L. R. Hilbert and D. J. Gregory, Stud. Conserv., 2003, 48, 183–194 CAS.
- G. De Combarieu, M. Schlegel, D. Neff, E. Foy, D. Vantelon, P. Barboux and S. Gin, Appl. Geochem., 2011, 26, 65–79 CrossRef CAS.
- M. L. Schlegel, C. Bataillon, K. Benhamida, C. Blanc, D. Menut and J.-L. Lacour, Appl. Geochem., 2008, 23, 2619–2633 CrossRef CAS.
- M. Saheb, D. Neff, P. Dillmann, H. Matthiesen, E. Foy and L. Bellot-Gurlet, Mater. Corros., 2009, 60, 99–105 CrossRef CAS.
- E. Vega, P. Dillmann, P. Berger and P. Fluzin, in Corrosion of Metallic Heritage Artefacts: Investigation, Conservation and Prediction for Long Term Behaviour, ed. P. Dillmann, G. Béranger, P. Piccardo and H. Matthiesen, Woodhead Publishing, Cambridge, 2007, pp. 92–108 Search PubMed.
- C. Bataillon, C. Musy and M. Roy, J. Phys. IV, 2001, 267–274 CAS.
- C. Bataillon, F. Bouchon, C. Chainais-Hillairet, C. Desgranges, E. Hoarau, F. Martin, S. Perrin, M. Tupin and J. Talandier, Electrochim. Acta, 2010, 55, 4451–4467 CrossRef CAS.
- J. Han, D. Young, H. Colijn, A. Tripathi and S. Nešić, Ind. Eng. Chem. Res., 2009, 48, 6296–6302 CrossRef CAS.
- A. J. Davenport, L. J. Oblonsky, M. P. Ryan and M. F. Toney, J. Electrochem. Soc., 2000, 147, 2162–2173 CrossRef CAS.
- L. J. Oblonsky, M. P. Ryan and H. S. Isaacs, Corros. Sci., 2000, 42, 229–241 CrossRef CAS.
- J. K. Heuer and J. F. Stubbins, Corros. Sci., 1999, 41, 1231–1243 CrossRef CAS.
- Y. F. Hu, R. K. Xu, J. J. Dynes, R. I. R. Blyth, G. Yu, L. M. Kozak and P. M. Huang, Geochim. Cosmochim. Acta, 2008, 72, 1959–1969, DOI:10.1016/j.gca.2008.02.002.
- J. J. Dynes, T. Tyliszczak, T. Araki, J. R. Lawrence, G. D. W. Swerhone, G. G. Leppard and A. P. Hitchcock, Environ. Sci. Technol., 2006, 40, 1556–1565 CrossRef CAS.
- M. Saheb, M. Descostes, D. Neff, H. Matthiesen, A. Michelin and P. Dillmann, Appl. Geochem., 2010, 25, 1937–1948 CrossRef CAS.
- R. Wirth, Chem. Geol., 2009, 261, 217–229 CrossRef CAS.
- K. V. Kaznatcheev, C. Karunakaran, U. D. Lanke, S. G. Urquhart, M. Obst and A. P. Hitchcock, Nucl. Instrum. Methods Phys. Res., Sect. A, 2007, 582, 96–99 CrossRef CAS.
- A. P. Hitchcock, http://unicorn.mcmaster.ca.
- S. Savoye, L. Legrand, G. Sagon, S. Lecomte, A. Chausse, R. Messina and P. Toulhoat, Corros. Sci., 2001, 43, 2049–2064 CrossRef CAS.
- P. Kuiper, B. G. Searle, P. Rudolf, L. H. Tjeng and C. T. Chen, Phys. Rev. Lett., 1993, 70, 1549 CrossRef CAS.
- G. Cressey, C. M. B. Henderson and G. v. d. Laan, Phys. Chem. Miner., 1993, 20, 111–119 CrossRef CAS.
- S. Bernard, K. Benzerara, O. Beyssac and G. E. Brown Jr, Geochim. Cosmochim. Acta, 2010, 74, 5054–5068 CrossRef CAS.
- B. Gilbert, J. E. Katz, J. D. Denlinger, R. F. Yadong Yin and G. A. Waychunas, J. Phys. Chem. C, 2010, 114, 21994–22001 CAS.
- E. Boulard, N. Menguy, A. L. Auzende, K. Benzerara, H. Bureau, D. Antonangeli, A. Corgne, G. Morard, J. Siebert, J. P. Perrillat, F. Guyot and G. Fiquet, J. Geophys. Res., 2012, 117, B02208 CrossRef.
- L. Garvie, A. J. Craven and R. Brydon, Am. Mineral., 1994, 79, 411–425 CAS.
- F. M. F. d. Groot, E. d. Smit, M. M. v. Schooneveld, L. R. Aramburo and B. M. Weckhuysen, ChemPhysChem, 2010, 11, 951–962 CrossRef.
- E. d. Smit, J. F. Creemer, H. W. Zandbergen, B. M. Weckhuysen and F. M. F. d. Groot, J. Phys.: Conf. Ser., 2009, 190, 012161 CrossRef.
- C. Rémazeilles and P. Refait, Polyhedron, 2009, 28, 749–756 CrossRef.
- M. Saheb, D. Neff, C. Bataillon, E. Foy and P. Dillmann, Corros. Sci., 2011, 53, 2201–2207 CrossRef CAS.
- D. S. Tannhauser, J. Phys. Chem. Solids, 1962, 23, 25–34 CrossRef CAS.
- D. D. MacDonald, J. Electrochem. Soc., 1992, 139, 3434–3449 CrossRef CAS.
- C. Bataillon, International Workshop Prediction of Long Term Corrosion Behaviour in Nuclear Waste Systems, Cadarache, France, 2001 Search PubMed.
| This journal is © The Royal Society of Chemistry 2013 |
