Subcellular redistribution and mitotic inheritance of transition metals in proliferating mouse fibroblast cells
Reagan McRaea, Barry Laib and Christoph J. Fahrni*a
aSchool of Chemistry and Biochemistry, Petit Institute for Bioengineering and Bioscience, Georgia Institute of Technology, 901 Atlantic Drive, Atlanta, GA 30332, USA. E-mail: fahrni@chemistry.gatech.edu; Fax: +1 404 894 2295; Tel: +1 404 385 1164
bAdvanced Photon Source, X-ray Science Division, Argonne National Laboratory, Argonne, IL 60439, USA. E-mail: blai@aps.anl.gov
First published on 4th December 2012
Abstract
Synchrotron X-ray fluorescence microscopy of non-synchronized NIH 3T3 fibroblasts revealed an intriguing redistribution dynamics that defines the inheritance of trace metals during mitosis. At metaphase, the highest density areas of Zn and Cu are localized in two distinct regions adjacent to the metaphase plate. As the sister chromatids are pulled towards the spindle poles during anaphase, Zn and Cu gradually move to the center and partition into the daughter cells to yield a pair of twin pools during cytokinesis. Colocalization analyses demonstrated high spatial correlations between Zn, Cu, and S throughout all mitotic stages, while Fe showed consistently different topographies characterized by high-density spots distributed across the entire cell. Whereas the total amount of Cu remained similar compared to interphase cells, mitotic Zn levels increased almost 3-fold, suggesting a prominent physiological role that lies beyond the requirement of Zn as a cofactor in metalloproteins or messenger in signaling pathways.
Introduction
Transition metals are essential trace nutrients required for the vitality of all living organisms. They play central roles in major cellular processes, including gene regulation, protein synthesis, and metabolic pathways. Not surprisingly, cell development and proliferation also depend on the presence of transition metal ions. For example, the requirements for copper and zinc are increased during pregnancy and lactation and hence critical to growth and development of the fetus and neonate.1,2 Similarly, maternal iron deficiency has serious consequences for the developing fetus, ranging from asymmetric organ growth, to reduced fetal weight, and premature birth.2 Copper and zinc also play important roles in bone metabolism and are essential for the normal development of the skeleton in humans and animals.3 The availability of copper, zinc, and iron generally affect processes that involve rapid proliferation, such as wound healing,4 angiogenesis,5 and tumor growth,6 a dependence that creates new opportunities for the development of anticancer agents based on chelation therapy.7 At the cellular level, zinc deprivation inhibits proliferation via cell cycle arrest at the late G1 phase8,9 as well as the G2/M transition,10,11 and blocks progression past telophase I of the meiotic cell cycle.12 Likewise, iron depletion leads to G1/S arrest, DNA damage, and apoptosis.13 Conversely, zinc supplementation promotes proliferation of healthy mouse cells14 as well as tumor cells.15Despite the importance of trace metals to cell proliferation, mechanisms governing their regulation, re-distribution, and ultimate partitioning into the daughter cells upon completion of cell division remain largely unexplored. Progress has been hampered in part due to the challenges associated with quantifying the distribution of trace metals at the single cell level. The average mammalian cell contains between 108 to 109 atoms of zinc and iron, and approximately 107 to 108 atoms of copper,16 quantities that are below the detection limit of common microanalytical techniques such as atomic emission spectroscopy (AES) or inductively coupled plasma mass spectrometry (ICP-MS). For this reason, the effect of trace metal ions on cell proliferation has been mostly investigated on bulk samples of synchronized cell populations. Several modern microanalytical techniques, notably secondary ion mass spectrometry (SIMS), nuclear microprobes (proton-induced X-ray emission), and synchrotron X-ray fluorescence (SXRF) microscopy, offer orders of magnitude improved detection limits and are capable of quantifying trace metals in single cells with submicron spatial resolution.17 For example, X-ray fluorescence imaging methods have been utilized to map the trace metal ion distribution in a broad range of cells and tissues, including mouse fibroblasts,18 embryonic stem cells,19 neurons,20 hepatocytes,21 mouse mammary gland tissue,22 drosophila tissue,23 or whole zebrafish embryos.24 Taking advantage of the capabilities of SXRF, we decided to explore the redistribution of transition metals in adherent mouse fibroblast cells as they progress through the individual stages of mitosis.
Experimental
Cell culture
NIH 3T3 mouse fibroblasts were cultured in Dulbecco's Modified Eagle's Medium (DMEM) supplemented with 10% bovine calf serum (GIBCO), 200 mM L-glutamine, penicillin (50 IU mL−1) and streptomycin (50 mg L−1) at 37 °C under an atmosphere of humidified air containing 5% CO2. The culture medium was sterilized by filtration through 0.2 μm filters. Cells were cultured directly onto 5 × 5 mm silicon nitride windows (Silson Ltd., UK), which were pre-coated with a 0.01% poly-L-lysine solution for 15 minutes. Upon reaching 60–80% confluency, cells were washed with PBS, fixed with 3% paraformaldehyde in PBS (10 min), washed again (PBS), and then incubated with Hoechst 33258 (5 μM solution in PBS) for 30 min in the dark at room temperature. To identify G1 and G2 phases, cells were treated with the Premo FUCCI Cell Cycle Sensor (Invitrogen) according to the manufacturer's protocol. After optimal expression of the FUCCI sensor was achieved (approximately 24 h post viral transduction), cells were washed with PBS and fixed with 3% PFA (10 min). Both Hoechst labeled and FUCCI sensor labeled samples were mounted onto microscopy slides in PBS and fluorescence micrographs were acquired with a Zeiss LSM Confocal/NLO 510 microscope, equipped with 488, 568, 633, and NLO/UV 800 nm excitation lasers and fitted with a 64× oil immersion objective. Immediately following fluorescence imaging, samples were prepared for SXRF microscopy as previously described.25 Briefly, cells were washed with PBS, followed by washing twice with isotonic ammonium acetate (0.1 M solution in sterile dH2O). Finally, the samples were air-dried overnight at ambient temperature in a covered sterile cell culture dish.SXRF microscopy
Synchrotron radiation X-ray fluorescence (SXRF) microscopy was performed at the 2-ID-D beamline of the Advanced Photon Source located at the Argonne National Laboratory (IL, USA). Cells attached to the silicon nitride windows were placed onto a kinematic specimen holder suitable for both optical and X-ray fluorescence microscopy. The holder was first mounted on a light microscope (Leica DMXRE) and target cells were located on the grid relative to a pre-determined reference point using a motorized x/y stage. Coordinates were recorded and used to precisely locate the target cells on the microprobe specimen holder. For cells stained with Hoechst dye, fluorescence images of cells occurring at each phase of mitosis were also acquired using a standard DAPI filter set. For XRF excitation, a monochromatic X-ray beam generated by an undulator source was focused to a spot size of 0.3 × 0.3 μm2 on the specimen using a Fresnel zone plate. The sample was raster scanned through the beam with excitation at 10 keV to ensure X-ray emission from all first-row transition elements. The step size was set to 0.3 μm and a full X-ray emission spectrum was acquired at each position with an energy dispersive silicon drift detector (SII NanoTechnology).Image colocalization analyses
All colocalization analyses were performed based on calibrated elemental area density maps acquired by X-ray fluorescence microscopy. To generate false-color overlay micrographs, the respective elemental maps were reproduced with a linear gray-scale and merged as red/green channel-separated rgb 8-bit color images. Scatter graphs were produced by plotting the area densities (nmol cm−2) of two elements for each pixel of a predefined spatial region of interest (ROI), typically including the entire cell area. Conversely, ROI's within the scatter plots were extracted with MATLAB (lasso routine by T. Rutten, V2.0, 2003) and replotted with ImageJ27 as false-color/gray composite rgb image. The Pearson correlation coefficients were calculated based on linear regression of the respective scatter plot data.For a subset of elemental maps, the degree of colocalization was evaluated through intensity correlation analysis (ICA) and comparison of the corresponding intensity correlation quotients (ICQ).28 To perform ICA for the spatial distribution of two elements X and Y, we calculated the product (Xi − x)(Yi − y), where x and y correspond to the average elemental densities of the pixels Xi and Yi within the cellular boundaries. If the area densities of the two elements vary synchronously, meaning areas with above average density of X contain also above average density of Y and vice versa, a scatter plot of Xi or Yi against (Xi − x)(Yi − y) will be skewed to the right. Conversely, if the two elements are spatially anti-correlated, the scatter plot will be skewed to the left. To highlight areas with a positive or negative product (Xi − x)(Yi − y) in the elemental map, the respective pixels were selected in the scatter plot and replotted with ImageJ27 as a false-color composite image. ICQ values were calculated by eqn (1)
| ICQ = (Np/Nt) − 0.5 | (1) |
Results
To capture physiologically relevant elemental distributions, NIH 3T3 cells were cultured under basal conditions and not subjected to the drug-based synchronization procedures commonly used to increase the yield of cells within specific stages of the cell cycle. The adherent cells were grown directly on an X-ray compatible substrate (silicon nitride), chemically fixed and air-dried. The mitotic stage of each cell was assigned based on the nuclear morphology visualized by the DNA-selective fluorescent stain Hoechst 33258.29 Individual cells were raster-scanned with excitation at 10 keV using a 0.3 μm step size, yielding quantitative 2D maps for all biologically relevant first-row transition elements as well as phosphorus and sulfur (Fig. 1). The considerable size of adherent fibroblast cells combined with the necessity to obtain elemental maps at high spatial resolution resulted in long data acquisition times (between 2–4 h per cell) and consequently restricted the sample size to 3 cells per mitotic stage. Because the cellular content of Co and Mn were very low and approached the detection limit of the instrumentation, only representative maps for Fe, Cu, and Zn are shown. The corresponding average quantities for all relevant elements are compiled in Table 1 as a function of the cell cycle stage.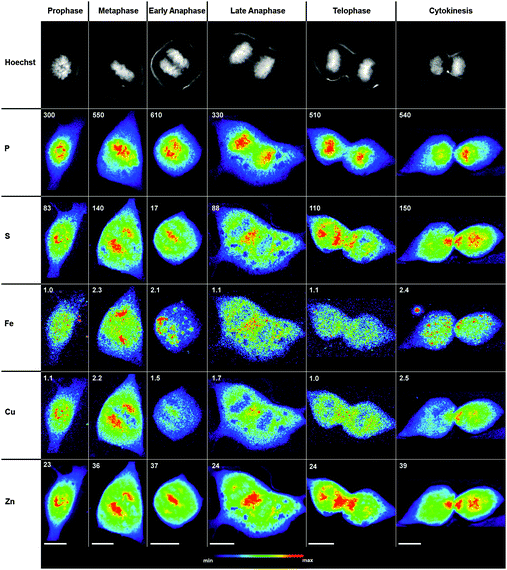 | ||
| Fig. 1 Intracellular elemental redistribution in non-synchronized NIH 3T3 cells during mitosis. Top row: fluorescence micrographs of cells stained with Hoechst 33258, a DNA selective fluorescent probe that highlights the chromosome morphology for assigning individual mitotic stages. 2nd–6th rows: subcellular distribution of phosphorus (P), sulfur (S), iron (Fe), copper (Cu), and zinc (Zn) for each cell (top row) visualized by SXRF raster scans with excitation at 10 keV and 0.3 μm step size. All false-color maps were normalized to the maximum elemental density indicated at the top left corner (units of 10 ng cm−2). All scale bars correspond to 10 μm. | ||
| Cell cycle stage | Total contenta (fmol) | ||||||||||||||||||||||||||||||||||||||||||||||||||||||||||||||||||||||||||||||||||||||||||||||||||
|---|---|---|---|---|---|---|---|---|---|---|---|---|---|---|---|---|---|---|---|---|---|---|---|---|---|---|---|---|---|---|---|---|---|---|---|---|---|---|---|---|---|---|---|---|---|---|---|---|---|---|---|---|---|---|---|---|---|---|---|---|---|---|---|---|---|---|---|---|---|---|---|---|---|---|---|---|---|---|---|---|---|---|---|---|---|---|---|---|---|---|---|---|---|---|---|---|---|---|---|
| P | S | Fe | Ni | Cu | Zn | ||||||||||||||||||||||||||||||||||||||||||||||||||||||||||||||||||||||||||||||||||||||||||||||
| a Average elemental contents of 3 cells for each cell cycle stages. | |||||||||||||||||||||||||||||||||||||||||||||||||||||||||||||||||||||||||||||||||||||||||||||||||||
| Interphase (G1) | 149 ± 11 | 71 ± 5 | 1.5 ± 0.5 | 0.15 ± 0.2 | 0.47 ± 0.1 | 3.3 ± 0.6 | |||||||||||||||||||||||||||||||||||||||||||||||||||||||||||||||||||||||||||||||||||||||||||||
| Interphase (G2) | 185 ± 5 | 77 ± 5 | 1.2 ± 0.3 | 0.16 ± 0.0 | 0.48 ± 0.1 | 3.8 ± 0.4 | |||||||||||||||||||||||||||||||||||||||||||||||||||||||||||||||||||||||||||||||||||||||||||||
| Prophase | 202 ± 11 | 62 ± 4 | 0.63 ± 0.2 | 0.53 ± 0.1 | 0.53 ± 0.1 | 9.3 ± 0.2 | |||||||||||||||||||||||||||||||||||||||||||||||||||||||||||||||||||||||||||||||||||||||||||||
| Metaphase | 214 ± 21 | 67 ± 11 | 0.54 ± 0.3 | 0.46 ± 0.1 | 0.54 ± 0.1 | 9.9 ± 1.0 | |||||||||||||||||||||||||||||||||||||||||||||||||||||||||||||||||||||||||||||||||||||||||||||
| Anaphase | 208 ± 6 | 62 ± 2 | 0.46 ± 0.1 | 0.55 ± 0.2 | 0.40 ± 0.2 | 8.3 ± 1.0 | |||||||||||||||||||||||||||||||||||||||||||||||||||||||||||||||||||||||||||||||||||||||||||||
| Telophase/cytokinesis | 195 ± 42 | 63 ± 26 | 0.42 ± 0.2 | 0.40 ± 0.1 | 0.34 ± 0.2 | 8.0 ± 3.0 | |||||||||||||||||||||||||||||||||||||||||||||||||||||||||||||||||||||||||||||||||||||||||||||
Judging from the chromosome structure and alignment, cells occurring in prophase, metaphase, anaphase, telophase, and cytokinesis were identified (Fig. 1, 1st row). Throughout all mitotic stages, the location of the chromosomes can be recognized in the P map as high-density areas. As the cells progress through mitosis, the S, Cu, and Zn maps revealed a striking redistribution with surprising similarities, whereas the Fe distribution appeared random at all stages.
During prophase, the condensed chromosomes are visible as threadlike structures. The highest density areas in the Zn and Cu maps show a similar localization compared to S, whereas the distribution of Fe is very different with hot spots appearing across the entire cell.
In metaphase, the Hoechst stain reveals chromosomes aligned along the spindle equator, and as observed for prophase cells, the P topography resembles the chromosome distribution. The highest density areas in the Zn and Cu maps appear in two distinct regions adjacent to the metaphase plate, complementing areas of high P content. Similar to prophase cells, the S distribution resembles Zn and Cu, while the Fe map is again different bearing little similarity to P, S, Cu, and Zn.
In early anaphase (Fig. 1, 3rd column), the sister chromatids have separated and started to migrate towards separate poles as evidenced by the Hoechst image and P map. The highest density areas of S, Cu, and Zn relocated to the center of the dividing cell while a smaller but prominent pool remained localized at each pole. At a later stage of anaphase (Fig. 1, 4th column), the central pool of S, Cu, and Zn was growing larger and appears now at the midzone of the dividing cell.
During telophase (Fig. 1, 5th column) and cytokinesis (Fig. 1, 6th column), the Hoechst image and P map show that the chromosomes arrived at the opposite poles. Notably, the central pools of S, Cu, and Zn are divided into similar portions and distributed into the two daughter cells upon formation of the cleavage furrow. Consistent with the observations during the earlier mitotic stages, the Fe distribution appears random with hot spots localized throughout the cell without any discernible structural organization. As evident from Table 1, the average total cellular content of Fe, Cu, and Zn did not significantly change across all mitotic stages; however, there appears to be a 2 to 3-fold increase in Zn and a similar reduction in Fe compared to interphase cells. While the Ni content in interphase cells approaches the detection limit, mitotic cells consistently showed increased Ni levels that were comparable with the total Cu content.
To better delineate the location of the highest-density areas of Cu and Zn, we determined the subcellular regions that account for 30% of the respective total elemental content within the cell and highlighted the corresponding pixels in red (Fig. 2). In the case of the Cu and Zn maps, these areas show striking similarities throughout all mitotic stages. Furthermore, the highlighted highest-density areas demarcate the pool of Zn and Cu that is redistributed from the nuclear area in prophase to the two distinct subpools in metaphase followed by partitioning into the daughter cells in the course of anaphase, telophase, and cytokinesis.
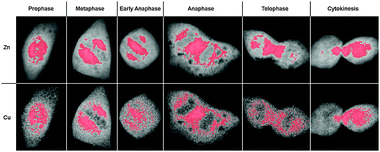 | ||
| Fig. 2 Subcellular distribution of areas with the highest densities of Zn and Cu during mitosis. The integrated elemental content of the areas highlighted in red corresponds to 30% of the total cellular content of Zn (top row) or Cu (bottom row). The depicted cells are identical with those in Fig. 1 at the respective mitotic stages. | ||
The intriguing redistribution pattern of Zn, Cu, and S in the transition from metaphase to anaphase prompted us to further analyze their spatial correlations in the form of qualitative false-color overlays and quantitative scatter plots (Fig. 3). Colocalized elemental densities appear yellow in the red-green overlays, and reside on a straight line in the scatter plots. As evident from the yellow-colored areas in the red-green overlays (Fig. 3A and B, left panels), the S and Zn maps reveal a high degree of colocalization, both in metaphase and anaphase cells (top rows). According to the scatter plots, in which the area densities of each pixel are represented as individual dots, the two elements are linearly correlated with near-unity Pearson coefficients of 0.96 and 0.97, respectively. In contrast, the highest density areas in the P and Zn maps do not overlap but rather complement each other like the pieces of a jigsaw puzzle, similar to the reciprocal distribution observed in a recent XRF study of embryonic stem cells.19 The corresponding correlation coefficients are lowered to 0.69 and 0.80 in metaphase and anaphase cells, respectively. At Zn densities below 3 nmol cm−2, however, the density correlation between the two elements is significantly higher. To identify the subcellular locations of all linearly correlated pixels, the corresponding region, marked in sky blue, was selected in the dot-plot and then highlighted within the gray-scale map of P (Fig. 3A and B, right panels). The resulting false-color plot shows a rather uniform distribution throughout the entire cell, but complete exclusion from the high-density P area where the chromosomes are located. At the same time, this area contains precisely the subset of poorly correlated pixels marked in orange. An analogous analysis of the S–Zn scatter plots yielded uniformly distributed pixels throughout the whole cell, both in metaphase and anaphase (Fig. 3A and B, second rows). The false-color overlays and scatter plots for the Cu and Zn maps indicate a significant degree of colocalization, both in metaphase and anaphase, albeit with lower correlation coefficients of 0.92 and 0.84, respectively Fig. 3A and B, bottom rows). Subcellular areas corresponding to the linearly correlated pixels are again scattered throughout the cell with apparent exclusion from areas with high P densities.
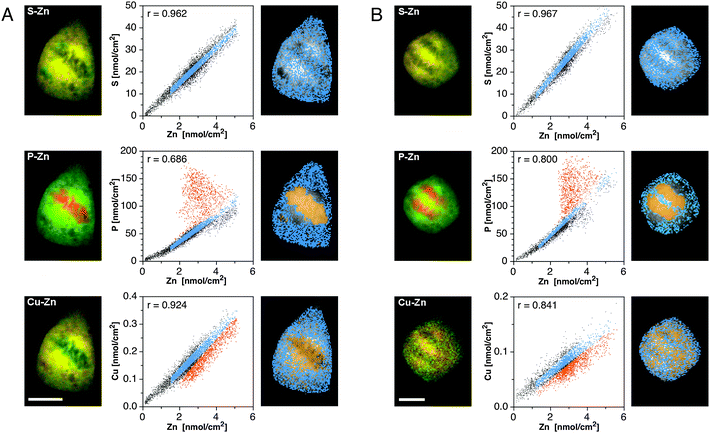 | ||
| Fig. 3 Colocalization analyses of the subcellular distribution of Zn in relation to S, P, and Cu for metaphase (panel A) and anaphase (panel B) cells. Left column: false-color overlay of the SXRF density maps of Zn (green) and selected elements (red) as indicated in each panel. Colocalized areas appear in yellow. Scale bars: 10 μm. Right column: correlation analyses based on scatter plots of the respective elemental densities at each pixel within the cellular area. The resulting Pearson correlation coefficients are displayed in the top left corner of each scatter plot. Linearly correlated pixels (sky blue) were identified in the scatter plot and the corresponding subcellular locations highlighted in the gray-scale elemental map. In select cases, a non-correlated subset was also plotted (orange pixels). | ||
The redistribution pattern of Cu and Zn and their spatial correlation with S but not P raised the question to what extent similar correlations already exists in interphase cells or whether a significant elemental redistribution occurs prior to mitosis, either during the transition from the post-mitotic G1 phase to the S phase, or at the S/G2 boundary. To determine the cell cycle stage of cells prior to SXRF imaging, we utilized the non-invasive fluorescence ubiquitination cell cycle indicator (FUCCI) developed by Miyawaki and coworkers.30 The FUCCI platform takes advantage of the complementary production and degradation of two cell-cycle regulated proteins, Cdt1 and geminin. By tagging Cdt1 and geminin with a red and green fluorescent protein, respectively, their cell-cycle dependent oscillation can be visually followed in live cells. Because geminin is proteolytically degraded during the G1 phase, cells appear red, while during the G2 phase only Cdt1 is subjected to proteolysis, rendering the cells green. At the G1/S boundary, both chimeras are sufficiently stabilized, producing an overall yellow hue. As illustrated with Fig. 4, individual cells occurring in the G1, G1/S, and G2 phases were identified based on the emission color observed of the fluorescence micrographs (top row) and a set of SXRF elemental maps were acquired to determine the subcellular distribution of P, S, Fe, Cu, and Zn.
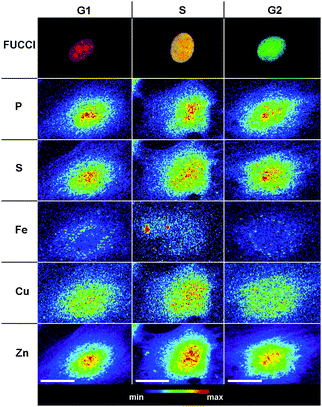 | ||
| Fig. 4 Intracellular elemental distributions in interphase NIH 3T3 cells. Top row: confocal fluorescence micrographs of cells labeled with the cell cycle indicator FUCCI30 for assigning individual interphase stages (red: G1 phase; mixed red/green: G1/S phase; green: G2). 2nd–6th rows: subcellular distribution of phosphorus (P), sulfur (S), iron (Fe), copper (Cu), and zinc (Zn) for each top row cell visualized by SXRF raster scans with excitation at 10 keV and 0.3 μm spatial resolution. All false-color maps were normalized to the maximum elemental density. Scale bars: 20 μm. | ||
Contrary to mitotic cells, the elemental topographies revealed no dramatic changes in the transition from the G1 to G2 phase. Consistent with previous observations on fibroblast interphase cells, the densities of Zn, Cu, S, and P are highest in the cell nucleus and perinuclear areas.18,25 Similar to mitotic cells, the distribution of Fe is characterized by high-density spots that are spattered throughout the cytoplasm but not in the nucleus, a topography that is again distinctly different compared to all other elements.
A direct comparison of the integrated X-ray emission spectra reveals a distinctly different transition-metal footprint for interphase compared to mitotic cells (Fig. 5). To adjust for differences in cell size, the emission spectra were normalized to the sulfur Kα band at 2.31 keV. Most notable, throughout all mitotic stages the Zn content is approximately 3-fold higher compared to interphase cells, resulting in a much lower S/Zn ratio around 7 compared to 21 for G1 or G2 cells. Furthermore, mitotic cells consistently showed a significant amount of Ni, which typically resides at or below the detection limit for interphase cells. In contrast, the Cu levels remained similar throughout the entire cell cycle with a S/Cu ratio around 140.
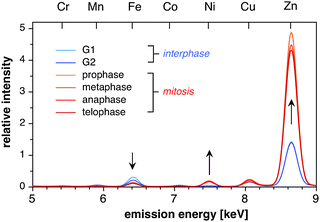 | ||
| Fig. 5 Comparison of the X-ray emission spectra for cells occurring at selected stages of the cell cycle. Pixel-by-pixel emission spectra were integrated over the entire cell area and normalized to the intensity of the sulfur Kα emission at 2.31 keV. Each spectrum represents the averaged spectra of three independent raster scans of different cells occurring at the same stage of the cell cycle. | ||
To better delineate differences between the elemental distributions in G1 and G2 cells, we again performed detailed correlation analyses (Fig. 6). Contrary to mitotic cells, a significant amount of colocalization occurs between Zn and P as indicated by the yellow areas of the false-color overlay and the considerably higher Pearson correlation coefficients of 0.90 and 0.91 for the G1 and G2 cells, respectively (Fig. 6A and B; top rows). According to the scatter analysis, the linearly correlated data points marked in blue appear randomly distributed throughout the cell without any noticeable differences between the cell nucleus and cytoplasm. An analogous analysis of the S and Zn topographies yielded a slightly higher correlation coefficient of 0.93 for both, the G1 and G2 cell, when compared to the P–Zn correlations; however, there were no apparent differences in the subcellular distribution of the linearly correlated pixels (Fig. 6A and B, middle rows). Finally, analysis of the Cu and Zn topographies revealed a reduced degree of colocalization, both according to the sparser occurrence of yellow areas in the false-color overlay as well as the lower correlation coefficients of 0.78 and 0.74, respectively (Fig. 6A and B, bottom rows). Interestingly, the linearly correlated Cu–Zn densities (blue) appear mostly in the cytoplasm, while the poorly correlated off-diagonal pixels (orange) are predominantly localized in the cell nucleus, which has a higher Zn–Cu ratio compared to the cytoplasmic regions.
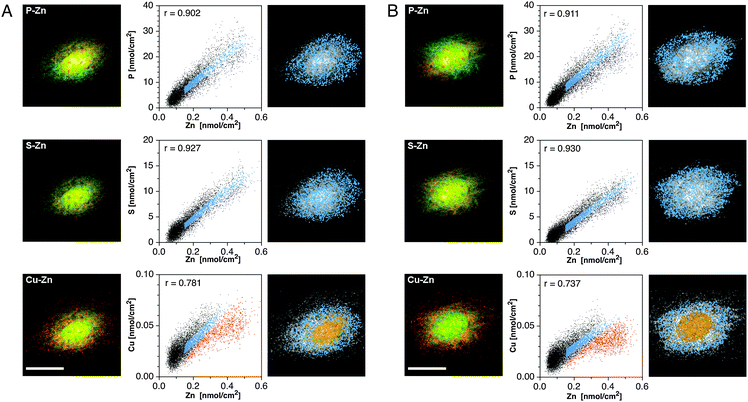 | ||
| Fig. 6 Colocalization analyses of the subcellular distribution of Zn in relation to S, P, and Cu for G1 (panel A) and G2 (panel B) interphase cells. Left column: false-color overlay of the SXRF density maps of Zn (green) and selected elements (red) as indicated in each panel. Colocalized areas appear in yellow. Scale bars: 20 μm. Right column: correlation analyses based on scatter plots of the respective elemental densities at each pixel within the cellular area. The resulting Pearson correlation coefficients are displayed in the top left corner of each scatter plot. Linearly correlated pixels (sky blue) were identified in the scatter plot and the corresponding subcellular locations highlighted in the gray-scale elemental map. In select cases, a non-correlated subset was also plotted (orange pixels). | ||
Due to their simplicity, red-green color overlays rank among the most popular colocalization analysis techniques; however, the method does not take into account whether the concentrations of two species are actually correlated within the spatially overlapping areas. To address this problem, Li et al. proposed the intensity correlation analysis (ICA), which describes the extent of synchronous variations between two species X and Y by the product (Xi − x)(Yi − y), where x and y correspond to the mean intensities of Xi and Yi of the pixels i within a region of interest.28 Positive product values indicate a dependent intensity variation and thus colocalization, whereas negative values occur in the case of spatially segregated species. Furthermore, the intensity correlation quotient (ICQ), defined as the ratio between pixels with a positive product and the total number of pixels subtracted by 0.5, is a direct measure of colocalization. It can assume values between −0.5 to +0.5, where negative numbers indicate segregation, near zero values a random distribution, and positive values a dependent relationship.
Given the distinct differences between the Zn–S and Zn–P spatial relationships, we utilized ICA to reinspect the cell cycle dependent distribution with a representative set of cells occurring in interphase (G1), metaphase, and anaphase (Fig. 7). The corresponding ICQ values are compiled in Table 2. Consistent with the overlay analysis of the cell depicted in Fig. 6A, ICA of the Zn–S and Zn–P relationships in G1 yielded positive ICQ values of 0.40 and 0.37, respectively, thus indicating a synchronous variation of the respective elemental densities. The corresponding pixels, highlighted in blue in the scatter plot, are predominantly localized in the cell nucleus for both correlations; however, areas that coincide with the nucleoli exhibit a below average Zn density compared to S (but not P) and are therefore excluded in the Zn–P ICA plot (Fig. 7A and B, left column). For both ICAs, the number of segregated pixels with a negative ICA product is small and shows a mostly random distribution throughout the cytoplasm. This is equally true for pixels with above (orange) and below average (magenta) Zn densities.
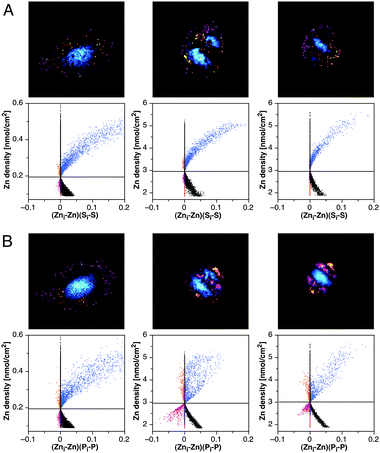 | ||
| Fig. 7 Intensity correlation analysis (ICA) for the subcellular distribution of Zn in relation to S and P at various stages of the cell cycle. The SXRF data sets for select cells occurring in G1 (left), metaphase (middle), and anaphase (right) were subjected to ICA to evaluate the Zn–S (panel A) and Zn–P (panel B) spatial relationships. Scatter plots are shown for the pixel-by-pixel correlation of the Zn densities (Zni) with the product (Zni–Zn)(Si–S), where Si corresponds to the S density at pixel i, and Zn and S represent the average elemental densities within the cellular boundaries. Area densities with above average elemental content are color-coded in blue for synchronously varying pixels and orange for segregated pixels. Below average segregated pixels are plotted in magenta. | ||
| Cell cycle stage | Correlation quotient (ICQ) | |
|---|---|---|
| Zn–S | Zn–P | |
| Interphase (G1) | 0.401 | 0.372 |
| Metaphase | 0.370 | 0.258 |
| Anaphase | 0.375 | 0.255 |
During metaphase, ICA of the Zn–S and Zn–P relationships revealed distinct differences (Fig. 7A and B, middle columns). While the ICQ for the Zn–S correlation remained close to the G1 value, it dropped from 0.37 to 0.26 for Zn–P (Table 2). The synchronously correlated pixels with positive ICA product (blue) covered precisely the same area adjacent to the chromosomes that was already revealed in the red-green overlay graph (Fig. 6A, top row); however, the latter did not indicate the presence of a positively correlated set of pixels in the same region in the Zn–P overlay. Compared to Zn–S, the Zn–P correlation contains a much larger number of segregated pixels, with above average Zn (orange) distributed in the peripheral region of the cell and below average Zn (magenta) located at areas with high P due to the presence of the chromosomes (Fig. 7B, middle). The few segregated pixels of the Zn–S correlation appear again randomly distributed throughout the cell (Fig. 7A, middle).
Finally, ICA of the Zn–S and Zn–P distributions during anaphase yielded similar results compared to metaphase, with essentially identical ICQ values of 0.38 and 0.26, respectively. Importantly, the Zn–P correlation revealed again a positively correlated set of pixels (blue) adjacent to the chromosomes, an area that was not apparent in the overlay analysis, and a set of segregated pixels coinciding with the chromosome location (Fig. 7, right panels).
To summarize the changes in elemental correlations throughout the entire cell cycle, we compiled the Pearson coefficients for all possible elemental combinations in the form of a color-coded heat map (Fig. 8). Among all correlations, the Zn–S relationship stands out, not only because it consistently scores the highest Pearson coefficients, but also because it is the only pair that is highly correlated throughout the entire cell cycle. In contrast, the Zn–P and S–P correlations are only pronounced during G1 and G2 but not mitosis, whereas the S–Cu and Zn–Cu correlations show the reverse trend. Consistent with the random and highly localized distribution of Fe, both in interphase and mitotic cells, the spatial correlations are low with any of the other elements.
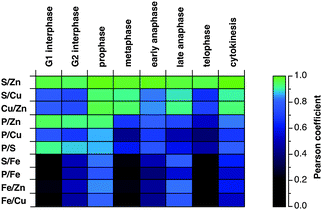 | ||
| Fig. 8 Comparison of the Pearson correlation coefficients for the colocalization of selected elements at individual stages of the cell cycle. The corresponding Pearson coefficients were converted into a color-coded heat map using a non-linear scale shown on the right, which highlights the most significant correlations (>0.9) in hues of blue-green. | ||
Discussion
The most striking observations of this study are the distinct redistribution patterns of Zn and Cu, their colocalization with S throughout all mitotic stages, and the increased Zn levels in mitotic compared to interphase cells. The importance of zinc to cell proliferation is well documented.31 For example, Zn deprivation of mouse NIH 3T3 fibroblast cells led to cell cycle arrest at the end of the G1 and G2 phases, and lowered the mRNA concentrations of cyclin D3 and E, effects that could be fully reversed by supplementation with Zn at basal levels.10 Conversely, stimulation with growth factors, including PDGF, EGF, and IGF-I resulted in increased Zn uptake and upregulated transcription of several Zn transporters, including Zip1, ZnT1, and ZnT4.32 Although Zn serves as a catalytic cofactor in DNA- and RNA-polymerases required for nucleic acid synthesis,33 the Zn dependence of the G1/S transition appears to be linked to depressed thymidine kinase activity, resulting in decreased thymidine incorporation into DNA.34 Addition of the metal-ion chelator DTPA (diethylenetrinitrilopentaacetic acid) to synchronized cultures of 3T3 cells lowered thymidine incorporation into DNA by 90%, and among biologically relevant divalent cations only Zn(II) was effective in rescuing the inhibition.35 Thymidine kinase, which catalyzes the phosphorylation of deoxythymidine to deoxythymidine monophosphate, is however not a Zn metalloenzyme. The decreased activity under Zn deficient conditions is caused by reduced thymidine kinase mRNA levels,35 suggesting that Zn might play an active role in transcriptional regulation of thymidine kinase.9,35The total concentration of Zn in mammalian cells lies in the high micromolar to low millimolar range. Regulated through an intricate network of Zn-selective membrane transporters,36 cells are capable of maintaining intracellular Zn levels approximately two orders of magnitude higher compared to the extracellular environment. While a substantial fraction of the total cellular Zn is bound to proteins, either as catalytic or structural component, cells maintain a labile subpool that can readily exchange with exogenous chelators.37 According to measurements with a range of synthetic and genetically encoded fluorescent probes, this labile cytosolic Zn pool is buffered at picomolar to low nanomolar concentrations.38 Studies with synchronized rat pheochromacytoma (PC12) cells using the Zn(II)-selective fluorescent probe FluoZin-3 revealed a cell-cycle dependent fluctuation of cytosolic Zn concentrations;39 however, the total cellular Zn levels were not reported. Based on the data compiled in Table 1, we estimate that the Zn levels in interphase cells vary between 1.4–2 mM when considering an average volume of 2 pL for 3T3 cells suspended in solution.40 During mitosis the cell volume shrinks to approximately 0.5 pL, which combined with the observed increase from 3.3 to 9 fmol, results in a rise in total Zn to levels as high as 16–20 mM throughout all mitotic stages.
In view of the low concentration of free cytosolic Zn, cells must maintain an excess chelation capacity that in turn might result in sequestration of exogenous Zn during sample preparation, especially fixation, and hence yield an artificially inflated Zn content. The same argument would also apply to Cu levels, which are buffered at an even lower concentration in the attomolar regime;41 however, no significant differences between interphase and mitotic cells were found (Table 1, Fig. 5), and therefore such a scenario seems less likely. Furthermore, the cell surface area is considerably larger in interphase compared to mitotic cells, and therefore, intracellular sequestration through random leakage across the plasma membrane would be expected to skew the data in the opposite direction. In addition, systematic studies on a variety of preparation methodologies demonstrated that mild chemical fixation with paraformaldehyde offered excellent reproducibility for SXRF quantifications of Zn and Cu, although to a lesser extent for Fe.42 Based on these considerations, the increased mitotic Zn levels appear physiologically relevant and imply an active import of Zn at the G2/M transition, possibly mediated through transcriptional or post-translational regulation of Zn import proteins.43 An increased expression of Zn importers might also explain the higher concentration of Ni in mitotic compared to interphase cells (Table 1, Fig. 5). Recent in vitro studies indeed showed that hZip4, a member of the ZIP (SLC39) family of Zn importers, tolerates transport of Ni(II) when expressed in Xenopus laevis oocytes.44
At present, we can only speculate regarding potential physiological functions of the increased Zn(II) levels during mitosis. The strong spatial correlations with sulfur throughout all mitotic stages (Fig. 8) combined with a significant drop of the S/Zn ratio upon entering mitosis (Table 1) imply possible roles of Zn in controlling the cellular redox status.45 Furthermore, the redistribution dynamics of Zn and its similarity to Cu might point towards a mechanism that entails compartmentalized transport, possibly with involvement of the Golgi apparatus. At the telophase and cytokinesis stage the highest density areas of Zn and Cu (Fig. 1) delineate a pattern that resemble the subcellular localization of the Golgi twins during late mitosis.46
The redistribution pattern of Fe stands in contrast to the correlated movement of Zn, Cu, and S, suggesting a distinctly different mechanism for the inheritance of this metal ion. The highest density areas of Fe form small patches or localized spots with no apparent spatial organization, both in mitotic (Fig. 1) and interphase cells (Fig. 4). Given the spattered appearance, it is not surprising that the Pearson coefficients revealed poor correlations between Fe and all other elements investigated (Fig. 8). Although less Fe was detected in mitotic compared to interphase cells (Table 1, Fig. 5), the cell-to-cell variations are considerably larger compared to Zn and Cu, rendering firm conclusions difficult.
Most mammalian cells acquire Fe through receptor-mediated import of transferrin, a blood plasma protein that can bind up to two Fe(III) ions with high affinity.47 Upon binding to the transferrin receptor at the cell surface, Fe-loaded transferrin is endocytosed via clathrin-coated pits. Acidification of the internalized vesicles by proton pumps triggers then the release of Fe(III), which upon reduction to Fe(II) by a ferrireductase is transported across the endosomal membrane into the cytosol and to mitochondria.48 Furthermore, cells can store excess intracellular Fe within ferritin, a large shell-like structure that can accumulate up to 4500 Fe(III) ions in form of ferric oxy-hydroxy phosphate.49 Consistent with the SXRF Fe maps, both components of the cellular Fe transport machinery would predict an uneven subcellular distribution with localized spots of high Fe densities.
Conclusions
SXRF investigation of mitotic NIH 3T3 cells offered an intriguing view of the subcellular dynamics of the trace metal redistribution during mitosis and points towards similar mechanisms for the inheritance of Zn and Cu, but not Fe. Although the cellular structures and proteins associated with the metal ions during their redistribution remain elusive, elemental quantification combined with a detailed correlation analysis of the SXRF maps nevertheless provided first clues towards a mechanism that might involve compartmentalized transport and possibly a role of the Golgi apparatus. Together, the data raise a multitude of questions that are expected to stimulate further investigations to unravel the underlying cellular and biochemical mechanisms involved in the redistribution of trace metals during the normal mammalian cell cycle.Acknowledgements
We thank Stefan Vogt (Argonne National Laboratory) for providing support with the MAPS software. Financial support from the National Institutes of Health (GM067169) is gratefully acknowledged. Use of the Advanced Photon Source was supported by the U.S. Department of Energy, Office of Science, Office of Basic Energy Sciences, under Contract No. DE-AC02-06CH11357.References
- C. L. Keen, J. Y. Uriu-Hare, S. N. Hawk, M. A. Jankowski, G. P. Daston, C. L. Kwik-Uribe and R. B. Rucker, Am. J. Clin. Nutr., 1998, 67, 1003S Search PubMed; M. S. Azman, W. S. W. Saudi, M. Ilhami, M. S. A. Mutalib and M. T. Rahman, Nutr. Neurosci., 2009, 12, 9 CrossRef CAS; J. Y. Uriu-Adams, R. E. Scherr, L. Lanoue and C. L. Keen, Biofactors, 2010, 36, 136 Search PubMed.
- L. Gambling and H. J. McArdle, Proc. Nutr. Soc., 2004, 63, 553 CrossRef CAS.
- J. P. Rodríguez, S. Ríos and M. González, J. Cell. Biochem., 2002, 85, 92 CrossRef CAS; C. Palacios, Crit. Rev. Food Sci. Nutr., 2006, 46, 621 CrossRef; M. Yamaguchi, J. Trace Elem. Exp. Med., 1998, 11, 119 CrossRef; J.-Y. Sun, J.-F. Wang, N.-T. Zi, M.-Y. Jing and X.-Y. Weng, Biol. Trace Elem. Res., 2011, 143, 394 CrossRef.
- N. Philips, H. Hwang, S. Chauhan, D. Leonardi and S. Gonzalez, Connect. Tissue Res., 2010, 51, 224 CrossRef CAS; A. B. G. Lansdown, U. Mirastschijski, N. Stubbs, E. Scanlon and M. S. Agren, Wound Repair Regen., 2007, 15, 2 CrossRef; M. Binnebösel, J. Grommes, B. Koenen, K. Junge, C. D. Klink, M. Stumpf, A. P. Ottinger, V. Schumpelick, U. Klinge and C. J. Krones, Int. J. Colorectal Dis., 2010, 25, 251 CrossRef; G. Borkow, J. Gabbay and R. C. Zatcoff, Med. Hypotheses, 2008, 70, 610 CrossRef.
- K. S. Raju, G. Alessandri, M. Ziche and P. M. Gullino, J. Natl. Cancer Inst., 1982, 69, 1183 Search PubMed; G. Hu, J. Cell. Biochem., 1998, 69, 326 CrossRef CAS; L. Finney, S. Mandava, L. Ursos, W. Zhang, D. Rodi, S. Vogt, D. Legnini, J. Maser, F. Ikpatt, O. I. Olopade and D. Glesne, Proc. Natl. Acad. Sci. U. S. A., 2007, 104, 2247 CrossRef; L. Finney, S. Vogt, T. Fukai and D. Glesne, Clin. Exp. Pharmacol. Physiol., 2009, 36, 88 CrossRef; C. Gérard, L.-J. Bordeleau, J. Barralet and C. J. Doillon, Biomaterials, 2010, 31, 824 CrossRef; L. D. D'Andrea, A. Romanelli, R. Di Stasi and C. Pedone, Dalton Trans., 2010, 39, 7625 RSC.
- Q. Pan, C. G. Kleer, K. L. van Golen, J. Irani, K. M. Bottema, C. Bias, M. De Carvalho, E. A. Mesri, D. M. Robins, R. D. Dick, G. J. Brewer and S. D. Merajver, Cancer Res., 2002, 62, 4854 Search PubMed; B. Hassouneh, M. Islam, T. Nagel, Q. Pan, S. D. Merajver and T. N. Teknos, Mol. Cancer. Ther., 2007, 6, 1039 CrossRef CAS; M. Hashemi, S. Ghavami, M. Eshraghi, E. P. Booy and M. Los, Eur. J. Pharmacol., 2007, 557, 9 CrossRef; A. Takeda, K. Goto and S. Okada, Biol. Trace Elem. Res., 1997, 59, 23 CrossRef; J. T. McQuitty, W. D. DeWys, L. Monaco, W. H. Strain, C. G. Rob, J. Apgar and W. J. Pories, Cancer Res., 1970, 30, 1387 Search PubMed.
- S. A. Lowndes and A. L. Harris, Oncol. Res., 2004, 14, 529 Search PubMed; J. L. Buss, F. M. Torti and S. V. Torti, Curr. Med. Chem., 2003, 10, 1021 CrossRef CAS.
- M. Huesca, L. S. Lock, A. A. Khine, S. Viau, R. Peralta, I. H. Cukier, H. N. Jin, R. A. Al-Qawasmeh, Y. Lee, J. Wright and A. P. Young, Mol. Cancer. Ther., 2009, 8, 2586 CrossRef CAS.
- J. K. Chesters, L. Petrie and K. E. Lipson, J. Cell Physiol., 1993, 155, 445 CrossRef CAS.
- J. K. Chesters and L. Petrie, J. Nutr. Biochem., 1999, 10, 279 CrossRef CAS.
- L. Sun, Y. T. Chai, R. Hannigan, V. K. Bhogaraju and K. Machaca, J. Cell Physiol., 2007, 213, 98 CrossRef CAS.
- A. M. Kim, S. Vogt, T. V. O'Halloran and T. K. Woodruff, Nat. Chem. Biol., 2010, 6, 674 CrossRef CAS; M. L. Bernhardt, A. M. Kim, T. V. O'Halloran and T. K. Woodruff, Biol. Reprod., 2011, 84, 526 CrossRef.
- D. R. Richardson, Curr. Med. Chem., 2005, 12, 2711 CrossRef CAS.
- S. C. Paski and Z. M. Xu, J. Nutr. Biochem., 2001, 12, 655 CrossRef CAS.
- E. Rudolf and M. Cervinka, J. Trace Elem. Med. Biol., 2008, 22, 149 CAS.
- L. A. Finney and T. V. O'Halloran, Science, 2003, 300, 931 CrossRef CAS.
- T. Paunesku, S. Vogt, J. Maser, B. Lai and G. Woloschak, J. Cell. Biochem., 2006, 99, 1489 CrossRef CAS; C. J. Fahrni, Curr. Opin. Chem. Biol., 2007, 11, 121 CrossRef; R. McRae, P. Bagchi, S. Sumalekshmy and C. J. Fahrni, Chem. Rev., 2009, 109, 4780 CrossRef; R. Ortega, G. Devès and A. Carmona, J. R. Soc. Interface, 2009, 6(Suppl. 5), S649 CrossRef; Z. Qin, J. A. Caruso, B. Lai, A. Matusch and J. S. Becker, Metallomics, 2011, 3, 28 RSC; E. Kosior, S. Bohic, H. Suhonen, R. Ortega, G. Devès, A. Carmona, F. Marchi, J. F. Guillet and P. Cloetens, J. Struct. Biol., 2012, 177, 239 CrossRef; M. W. Bourassa and L. M. Miller, Metallomics, 2012, 4, 721 RSC.
- L. Yang, R. McRae, M. M. Henary, R. Patel, B. Lai, S. Vogt and C. J. Fahrni, Proc. Natl. Acad. Sci. U. S. A., 2005, 102, 11179 CrossRef CAS; R. McRae, B. Lai and C. J. Fahrni, J. Biol. Inorg. Chem., 2010, 15, 99 CrossRef.
- J. L. Wolford, Y. Chishti, Q. L. Jin, J. Ward, L. H. Chen, S. Vogt and L. Finney, PLoS One, 2010, 5, e12308 Search PubMed.
- A. Carmona, P. Cloetens, G. Deves, S. Bohic and R. Ortega, J. Anal. At. Spectrom., 2008, 23, 1083 RSC; A. Carmona, G. Devès, S. Roudeau, P. Cloetens, S. Bohic and R. Ortega, ACS Chem. Neurosci., 2010, 1, 194 CrossRef CAS; S. C. Dodani, D. W. Domaille, C. I. Nam, E. W. Miller, L. A. Finney, S. Vogt and C. J. Chang, Proc. Natl. Acad. Sci. U. S. A., 2011, 108, 5980 CrossRef.
- M. Ralle, D. Huster, S. Vogt, W. Schirrmeister, J. L. Burkhead, T. R. Capps, L. Gray, B. Lai, E. Maryon and S. Lutsenko, J. Biol. Chem., 2010, 285, 30875 CrossRef CAS.
- N. McCormick, V. Velasquez, L. Finney, S. Vogt and S. L. Kelleher, PLoS One, 2010, 5, e11078 Search PubMed; S. A. Jansen, T. Paunesku, X. B. Fan, G. E. Woloschak, S. Vogt, S. D. Conzen, T. Krausz, G. M. Newstead and G. S. Karczmar, Radiology, 2009, 253, 399 CrossRef.
- J. C. Lye, J. E. C. Hwang, D. Paterson, M. D. de Jonge, D. L. Howard and R. Burke, PLoS One, 2011, 6, e26867 CAS.
- G. Yan, Y. C. Zhang, J. L. Yu, Y. Yu, F. Zhang, Z. Z. Zhang, A. M. Wu, X. H. Yan, Y. Zhou and F. D. Wang, PLoS One, 2012, 7, e12308 Search PubMed.
- R. McRae, B. Lai, S. Vogt and C. J. Fahrni, J. Struct. Biol., 2006, 155, 22 CrossRef CAS.
- S. Vogt, J. Phys. IV, 2003, 104, 635 CAS.
- C. A. Schneider, W. S. Rasband and K. W. Eliceiri, Nat. Methods, 2012, 9, 671 CrossRef CAS.
- Q. Li, A. Lau, T. J. Morris, L. Guo, C. B. Fordyce and E. F. Stanley, J. Neurosci., 2004, 24, 4070 CrossRef CAS.
- C. P. Leblond and M. El-Alfy, Anat. Rec., 1998, 252, 426 CrossRef CAS.
- A. Sakaue-Sawano, H. Kurokawa, T. Morimura, A. Hanyu, H. Hama, H. Osawa, S. Kashiwagi, K. Fukami, T. Miyata, H. Miyoshi, T. Imamura, M. Ogawa, H. Masai and A. Miyawaki, Cell, 2008, 132, 487 CrossRef CAS.
- R. S. MacDonald, J. Nutr., 2000, 130, 1500S Search PubMed; D. Beyersmann and H. Haase, Biometals, 2001, 14, 331 CrossRef CAS.
- M. Simpson and Z. Xu, J. Nutr. Biochem., 2006, 17, 541 CrossRef CAS.
- F. Y. H. Wu and C. W. Wu, Annu. Rev. Nutr., 1987, 7, 251 CrossRef CAS.
- F. J. Bollum and V. R. Potter, J. Biol. Chem., 1958, 233, 478 CAS; I. E. Dreosti and L. S. Hurley, Proc. Soc. Exp. Biol. Med., 1975, 150, 161 Search PubMed; J. R. Duncan and L. S. Hurley, Proc. Soc. Exp. Biol. Med., 1978, 159, 39 Search PubMed; I. R. Record and I. E. Dreosti, Nutr. Rep. Int., 1979, 20, 749 Search PubMed.
- J. K. Chesters, L. Petrie and H. Vint, Exp. Cell Res., 1989, 184, 499 CrossRef CAS.
- L. A. Lichten and R. J. Cousins, Annu. Rev. Nutr., 2009, 29, 153 CrossRef CAS; T. Fukada, S. Yamasaki, K. Nishida, M. Murakami and T. Hirano, J. Biol. Inorg. Chem., 2011, 16, 1123 CrossRef.
- R. A. Colvin, W. R. Holmes, C. P. Fontaine and W. Maret, Metallomics, 2010, 2, 306 RSC.
- A. Krezel and W. Maret, J. Biol. Inorg. Chem., 2006, 11, 1049 CrossRef CAS; J. L. Vinkenborg, T. J. Nicolson, E. A. Bellomo, M. S. Koay, G. A. Rutter and M. Merkx, Nat. Methods, 2009, 6, 737 CrossRef; Y. Qin, P. J. Dittmer, J. G. Park, K. B. Jansen and A. E. Palmer, Proc. Natl. Acad. Sci. U. S. A., 2011, 108, 7351 CrossRef.
- Y. Li and W. Maret, Exp. Cell Res., 2009, 315, 2463 CrossRef CAS.
- M. Halter, J. T. Elliott, J. B. Hubbard, A. Tona and A. L. Plant, J. Theor. Biol., 2009, 257, 124 CrossRef.
- T. D. Rae, P. J. Schmidt, R. A. Pufahl, V. C. Culotta and T. V. O'Halloran, Science, 1999, 284, 805 CrossRef CAS.
- S. Matsuyama, M. Shimura, M. Fujii, K. Maeshima, H. Yumoto, H. Mimura, Y. Sano, M. Yabashi, Y. Nishino and K. Tamasaku, X-ray Spectrom., 2010, 39, 260 CrossRef CAS; S. A. James, D. E. Myers, M. D. de Jonge, S. Vogt, C. G. Ryan, B. A. Sexton, P. Hoobin, D. Paterson, D. L. Howard, S. C. Mayo, M. Altissimo, G. F. Moorhead and S. W. Wilkins, Anal. Bioanal. Chem., 2011, 401, 853 CrossRef.
- P. T. Spellman, G. Sherlock, M. Q. Zhang, V. R. Iyer, K. Anders, M. B. Eisen, P. O. Brown, D. Botstein and B. Futcher, Mol. Biol. Cell, 1998, 9, 3273 Search PubMed; N. P. Gauthier, L. J. Jensen, R. Wernersson, S. Brunak and T. S. Jensen, Nucleic Acids Res., 2010, 38, D699 CrossRef CAS; X. Mao, B.-E. Kim, F. Wang, D. J. Eide and M. J. Petris, J. Biol. Chem., 2007, 282, 6992 CrossRef.
- S. Antala and R. E. Dempski, Biochemistry, 2012, 51, 963 CrossRef CAS.
- W. Maret and B. L. Vallee, Proc. Natl. Acad. Sci. U. S. A., 1998, 95, 3478 CrossRef CAS; W. Maret, Biochemistry, 2004, 43, 3301 CrossRef.
- G. M. Gaietta, B. N. G. Giepmans, T. J. Deerinck, W. B. Smith, L. Ngan, J. Llopis, S. R. Adams, R. Y. Tsien and M. H. Ellisman, Proc. Natl. Acad. Sci. U. S. A., 2006, 103, 17777 CrossRef CAS.
- P. Ponka, C. Beaumont and D. R. Richardson, Semin. Hematol., 1998, 35, 35 CAS.
- C. D. Kaplan and J. Kaplan, Chem. Rev., 2009, 109, 4536 CrossRef CAS; J. Wang and K. Pantopoulos, Biochem. J., 2011, 434, 365 CrossRef.
- P. Arosio, R. Ingrassia and P. Cavadini, Biochim. Biophys. Acta, 2009, 1790, 589 CrossRef CAS.
| This journal is © The Royal Society of Chemistry 2013 |
