Emulsion ageing: effect on the dynamics of oil exchange in oil-in-water emulsions
Nelly
Malassagne-Bulgarelli
and
Kathryn M.
McGrath
*
MacDiarmid Institute for Advanced Materials and Nanotechnology, School of Chemical and Physical Sciences, Victoria University of Wellington, Wellington, New Zealand. E-mail: kathryn.mcgrath@vuw.ac.nz
First published on 9th October 2012
Abstract
Emulsions are highly dynamic entropically stabilised systems. In oil-in-water emulsions, it is generally believed that oil transfer from one droplet to another via a series of destabilisation processes (e.g. Ostwald ripening or coalescence) leads to droplet growth. Rapid oil exchange between oil droplets of toluene in toluene/Triton X-100/water emulsions was recently evidenced, without any measurable concomitant change in emulsion droplet size. This dynamic process is the result of oil permeation upon droplet collision through transient holes at the surface of the surfactant layer or via reversible partial coalescence of the oil droplets, i.e. a fusion/fission mechanism. The kinetics of the oil exchange can be monitored by pulsed field gradient-NMR. The time constant of the oil exchange equates to the critical NMR observation time, Δswitch. Here we probe this rapid oil exchange between droplets as a function of emulsion age. The timescale of emulsion ageing is determined from static light scattering and macroscopic phase separation data. The timescale of the dynamic oil exchange is extracted from the NMR data. The switching time Δswitch, is an increasing function of emulsion age. Three effects must be considered when explaining the kinetics of oil exchange as a function of emulsion age: (1) the increasing droplet size; larger droplets move more slowly and interact with one another less frequently leading to a decrease in both the collision frequency and the rate of oil exchange; (2) the increased droplet concentration that arises upon emulsion ageing, reducing the average distance between droplets and (3) the properties of the interfacial domain.
Introduction
Emulsions are mixtures of two immiscible fluids (e.g. oil and water). They are encountered in many industrial applications including cosmetics, food, roading, drug delivery and paint technology. As kinetically stabilised systems, emulsions require an energy input to be realized. The nature of the relationships between the microstructure, the dynamics of the dispersed phase and the lifetime of emulsions is still poorly understood. This results in the formulation of emulsions remaining largely empirical despite their wide spread use.Emulsions are highly dynamic systems. It is of fundamental importance to determine the parameters controlling the dynamics of emulsion systems in order to be able to predict and manipulate the kinetics of these dynamic processes.
Here we report further findings with regard to our somewhat counter intuitive and potentially controversial finding that oil exchange between droplets in oil in water emulsions occurs on the millisecond to second timescale without leading to measurable concomitant oil droplet growth.1
In the classical DLVO theory, based on an energy balance between van der Waals attraction and electrostatic repulsion, oil exchange between droplets would result in droplet growth and emulsion destabilisation. That is, processes such as partial reversible coalescence, allowing for oil exchange between droplets with no ensemble average change in the droplet size, would not be possible. The van der Waals attraction and electrostatic repulsion energy balance would not provide a driving force for subsequent fission of the droplets. Inherently the system is treated as an equilibrium process with no kinetic considerations.
Reversible one-species coagulation has been theoretically shown to be possible (a diffusion-reaction equation was used to describe the local density) for maximal entropy equilibrium states.2 Such a non-equilibrium steady-state system, for which the probability of colliding particles is small, is similar to the kinetically stabilised emulsions investigated here. Burschka et al. probed the system by following the relaxation dynamics. Such an approach, where kinetic effects are incorporated, based on diffusion events and the strength of the interaction between colliding bodies, may provide an argument for the failure of the DLVO and similar theories to account for the observed oil exchange process occurring in emulsions, since they do not allow for kinetics effects to influence the system. Here we provide further experimental evidence that non-equilibrium processes in part define the behaviour of emulsion systems and thereby can provide insights into emulsion stability and use.
We have investigated the emulsion system; toluene/Triton X-100/water, where Triton X-100 is a commercially available nonionic surfactant. The evolution of the dynamics of oil exchange between oil droplets was monitored as a function of emulsion age for oil concentrations of 5 to 70 wt% toluene, while maintaining the oil-to-surfactant weight ratio, the temperature, the energy input and the emulsion formulation process constant. For this purpose pulsed field gradient-NMR (PFG-NMR) and light scattering techniques were used as the experimental techniques.
Oil exchange between oil droplets occurs throughout the entire ageing process monitored: before and during detectable droplet growth and before and after macroscopic phase separation is initiated. The timescale for the oil exchange is several orders of magnitude faster than the measurable droplet growth and emulsion destabilisation and is an increasing function of emulsion age.
Results
Droplet size distributions
The droplet size distributions of fresh toluene/Triton X-100/water emulsions upon varying oil content from 5 to 70 wt% were determined by static light scattering (SLS). Representative distributions are shown in Fig. 1.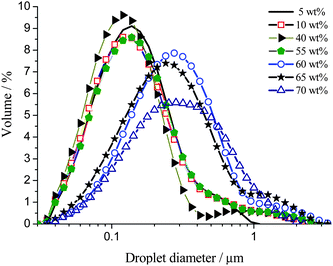 | ||
| Fig. 1 Droplet size distributions of fresh toluene/Triton X-100/water emulsions with toluene concentrations of 5 to 70 wt%. | ||
The droplet size distributions for fresh emulsions, for all oil concentrations exhibit a lognormal shape with a slightly longer tail at the large droplet end (exaggerated due to the dependence of the measured intensity on the sixth power of the particle diameter) due to inefficient droplet break up during formulation. Between 5 and 55 wt% toluene, no dependence of the droplet size distribution on oil concentration is observed. The initial volume-based mean droplet diameter is 0.23 ± 0.10 μm and the contribution of the smallest droplets of the system dominates with the maximum diameter of the size distribution being 0.15 ± 0.10 μm. Between 60 and 70 wt% toluene, the volume-based mean droplet diameter increases from 0.23 ± 0.10 μm to 0.37 ± 0.10 μm and the maximum of the distribution shifts from 0.15 ± 0.10 μm to 0.30 ± 0.10 μm.
The droplet size distributions of aged emulsions were monitored using SLS over a period of 5 days. In Fig. 2 is shown the droplet size distribution variation with time for a 40 wt% toluene emulsion. The distributions shown and the variation as a function of time are representative of emulsions between 5 and 55 wt% toluene.
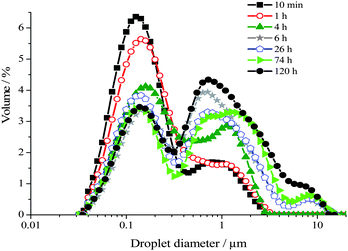 | ||
| Fig. 2 Droplet size distributions of a 40 wt% toluene emulsion measured as a function of time over 5 days using SLS. These size distributions are representative of emulsions comprising 5 and 55 wt% oil. | ||
The droplet size distribution of these emulsions becomes multimodal upon ageing, typical of systems ageing via predominantly a coalescence mechanism.3 Droplets as large as 16 μm are formed. For a 40 wt% toluene emulsion, during the first ∼6 hours following emulsification, oil droplets remain in the same size range as that measured for freshly emulsified samples, i.e. between 35 nm and ∼3 μm diameter. During this first 6 hours, the bimodal distribution is altered such that there is an increase in the number of droplets measuring ∼0.4 to ∼3 μm diameter, as seen by the growth of the peak centred at ∼1 μm. This occurs at the expense of the number of droplets between ∼35 nm and ∼0.35 μm diameter, as observed by the concomitant reduction of the amplitude of the peak centred at ∼0.15 μm.
From ∼6 h onwards a third peak centred at ∼8 μm including droplets between ∼3.5 and ∼16 μm diameter is detected. Once a critical mean droplet size has been reached emulsions macroscopically begin to phase separate, resulting in expulsion of the aqueous continuous phase, note that an upper oil phase is never observed upon ageing of these emulsions. For a 40 wt% toluene emulsion macroscopic phase separation occurs after ∼10 h. Finally, between ∼6 and ∼120 h, the amplitude ratio of the peak centred at ∼1 μm to the peak centred at ∼0.15 μm continues to increase coupled with a slight growth of the third large diameter peak.
The variation of the droplet size distribution of the higher oil content emulsion samples, prepared with toluene between 60 and 70 wt%, as a function of emulsion age is shown in Fig. 3. The initial peak centred at ∼0.30 μm diameter (Fig. 1) splits into three peaks centred at ∼0.15, 0.50 and 1.5 μm, respectively, after ∼1 h following emulsification. The global size range measured upon ageing remains however similar to that of the more diluted samples.
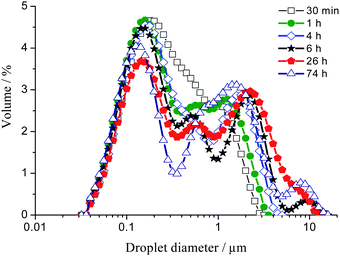 | ||
| Fig. 3 Droplet size distribution of a 65 wt% toluene emulsion measured as a function of emulsion age over 74 h using SLS. This size distribution is representative of emulsions between 60 and 70 wt% oil. | ||
Over time the amplitude of the peak centred at ∼0.50 μm decreases while the high end tail of the peak centred at ∼1.5 μm shifts to larger droplet sizes in addition to a new fourth peak centred at ∼8 μm becoming evident.
The presence of oil swollen micelles dissolved in the aqueous continuous phase was detected by analysing the expelled aqueous bottom phase of a separated emulsion sample upon ageing by dynamic light scattering (DLS, Fig. 4). Oil swollen micelles between ∼9 and ∼30 nm diameter are present. The size distribution for the oil swollen micelles is a lognormal shape with a mean diameter at 15 ± 5 nm. It was not possible to perform similar measurements on highly concentrated emulsions (65 to 70 wt% oil) due to the small quantity of expelled aqueous phase.
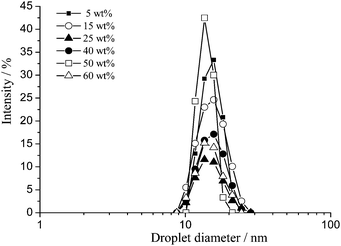 | ||
| Fig. 4 Droplet size distributions of the bottom expelled aqueous phase of aged toluene/Triton X-100/water emulsions between 5 and 60 wt% toluene using DLS. Note that the samples have been aged for different times to allow sufficient expelled aqueous phase to be isolated in order to collect the data, hence no correlation of intensity with oil volume fraction can be inferred from these data. | ||
Emulsion dynamics
Turning now to consider the dynamics of the dispersed oil phase, we recently reported on the occurrence of oil exchange between toluene droplets.1 The rapid oil transfer was evidenced using laser scanning confocal microscopy, cryo-SEM and PFG-NMR techniques for freshly prepared emulsions.1 Using PFG-NMR the diffusion coefficient is extracted from the attenuation data as a function of gradient strength, according to eqn (1) and (2) (Experimental section). For a pure substance or a monodisperse emulsion, a single diffusion coefficient is probed which is represented by a single exponential of the attenuation data upon increasing gradient strength. Hence the diffusion coefficient is extracted from the slope of the log–log plot of signal attenuation vs. gradient strength. For a polydisperse emulsion or mixture of substances a multiexponential decay is evident.The lifetime of the oil exchange can be determined using PFG-NMR upon varying the NMR observation time, Δ. Here observation times of 6.3 ms to 3 s are possible. For long observation times Δ, the echo attenuation of the oil signal follows a single exponential decay as a function of the gradient strength, indicative of a motional averaging of the oil diffusion due to the rapid exchange of toluene molecules between the droplets on a time scale faster than the NMR observation time. A single diffusion coefficient is extracted from the NMR data representing this motional averaging, Dmotional averaging. Upon decreasing Δ below the so-called concentration-dependent observation time, Δswitch, a switch between a single exponential decay (indicative of motional averaging) and a multiexponential decay of the echo attenuation as a function of the gradient strength, where individual droplet and oil molecule motions are now probed, is detected (Fig. 5). The multiexponential decay thereby represents the true underlying polydisperse nature of the emulsion samples.
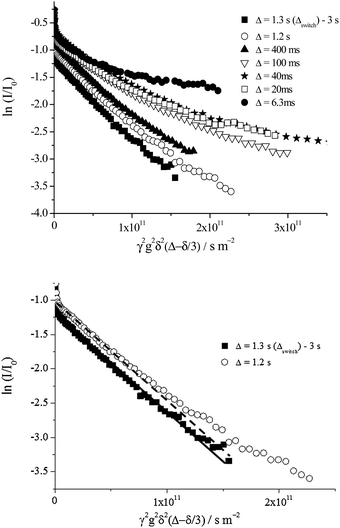 | ||
| Fig. 5 (Top) Diffusion echo attenuation of the oil signal for a fresh 40 wt% toluene emulsion. A single exponential decay arises for observation times, Δ, between 1.3 s (Δswitch) and 3 s whereas a multiexponential decay is measured for Δ between 6.3 ms and 1.2 s. (Bottom) The data for Δ = 1.2 s and 1.3 s with the corresponding single exponential fit shown. The data for Δ = 1.2 s cannot be fit by this single exponential decay whereas for Δ = 1.3 s the data are well represented by such a fit. The motional average diffusion coefficient is the slope of the single exponential fit for Δ = 1.3 s. For the multiexponential decay, Δ = 1.2 s, a distribution of diffusion coefficients is extracted using an inverse Laplace transformation, as per Fig. 11. These echo attenuations are representative of emulsion samples between 5 and ∼55 wt% toluene. | ||
The switching time for the data shown in Fig. 5, for a fresh 40 wt% toluene emulsion is 1.3 s. Hence, the observation time Δswitch defines the time scale of the oil exchange process resulting from reversible partial coalescence or permeation via transient holes.
Variations of the switching time and motional average diffusion coefficient as a function of oil concentration for fresh emulsions are shown in Fig. 6.
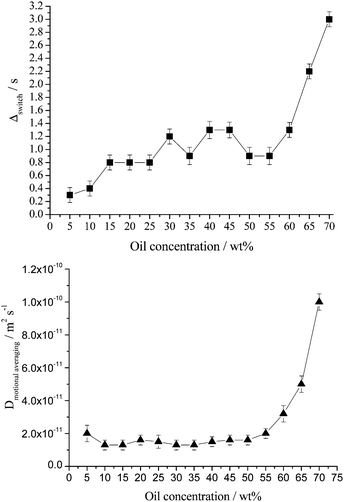 | ||
| Fig. 6 Switching time (top) and diffusion coefficient corresponding to motional averaging (bottom) as a function of oil concentration for freshly prepared emulsions. Lines to guide eye only. Note that a closed cell foam emulsion forms for toluene concentrations greater than ∼60 wt% toluene.5 Here the average droplet size is considerably larger and the droplets are in very close proximity, both affect the switching time and motional average diffusion coefficient. | ||
The distribution of diffusion coefficients related to individual droplet and oil molecule motions can be extracted from the multiexponential decay signal using an inverse Laplace transform,4 resulting in a diffusion coefficient distribution (see Fig. 6 in ref. 1) which can be directly correlated with the light scattering data.
Having established the dynamic behaviour of the fresh emulsions our focus now turns to how the motional averaging is affected by emulsion ageing.
Emulsion ageing
As toluene/Triton X-100/water emulsions age, the average droplet size increases (Fig. 3) which eventually leads to macroscopic phase separation. During this process the continuous aqueous phase is progressively expelled from the emulsion, resulting in an increasingly concentrated upper emulsion having on average larger droplets than in the fresh emulsion due to droplet coalescence. The continuous aqueous phase of these emulsions contains both oil swollen micelles and dissolved toluene molecules. Hence, upon ageing in addition to the oil droplets increasing in size and the upper emulsion becoming more concentrated it is also progressively depleted of both toluene molecules and oil swollen micelles as the two are expelled along with the water.The decrease in the free toluene molecule concentration within the continuous phase of an aged emulsion is apparent by the reduction of the very fast diffusing portion of the echo attenuation of the oil signal detected in the upper concentrated emulsion only (Fig. 7). The fast diffusing contribution to the attenuation data, corresponding to the unrestricted diffusion of toluene molecules dissolved directly in the continuous phase (see ref. 1 for details), is a significantly reduced component of the attenuation data when the upper concentrated emulsion of a sample aged for 15 days, as compared with a freshly emulsified sample, is probed. This is due solely to the reduction of the total volume fraction of toluene dissolved in the continuous phase since after 15 days most of the aqueous phase has been expelled upon phase separation and the upper emulsion is now highly concentrated.
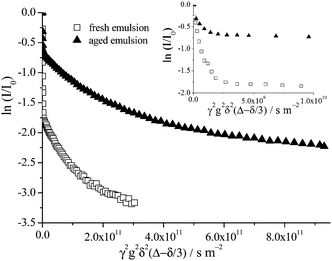 | ||
| Fig. 7 Echo attenuation of the oil signal for a 15 wt% toluene emulsion freshly emulsified and aged for 15 days (upper concentrated emulsion only is probed by the NMR rf coil); Δ = 100 ms. The inset shows the fast decaying attenuation data arising due to unrestricted diffusion of individual toluene molecules dissolved in the aqueous continuous phase present in all samples, fresh and aged for all toluene concentrations, see also Fig. 5 and 8. It should be noted that this fast decaying data are evident for all NMR observation times. | ||
In Fig. 8 are presented the echo attenuation data of the oil signal for a fresh 40 wt% toluene emulsion, the concentrated upper emulsion after ageing for 1 month and the corresponding expelled aqueous phase. Upon probing a phase separated 40 wt% toluene emulsion aged for 1 month, with the NMR rf coil sampling only the upper concentrated emulsion, it is evident that in comparison with the fresh sample, the fast diffusing contribution to the attenuation data, associated with unrestricted diffusion of toluene molecules in the continuous phase, has completely disappeared. This is true for all values of Δ (6.3 ms to 3 s) and is as expected since most of the aqueous phase has been expelled from the emulsion after 1 month. A multiexponential decay as a function of gradient strength at Δ = 100 ms is evident for both fresh and 1 month old emulsion samples.
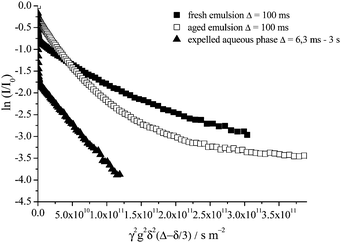 | ||
| Fig. 8 Echo attenuation of the oil signal for a freshly emulsified 40 wt% toluene emulsion, Δ = 100 ms; the upper concentrated emulsion of the 40 wt% toluene sample aged 1 month, Δ = 100 ms and the expelled aqueous phase of a 40 wt% toluene emulsion aged of 1 month for Δ between 6.3 ms and 3 s. | ||
On the contrary, when only the expelled aqueous phase of the 1 month old emulsion is probed by the NMR rf coil a bimodal exponential decay is observed for all values of Δ (6.3 ms to 3 s, Fig. 8). These two decays are the result of (1) the fast diffusing component, the unrestricted diffusion of toluene molecules dissolved directly in the continuous phase, and (2) the slow diffusion component, the unrestricted diffusion of toluene swollen micelles. A significantly larger proportion of the total attenuation decay is now a result of probing the toluene molecules freely diffusing in aqueous solution, as expected since no large emulsion droplets are being detected by the rf coil of the NMR probe.
Considering the PFG-NMR data for the expelled aqueous phase of the aged emulsion sample, the diffusion coefficients associated with the unrestricted diffusion of the oil swollen micelles present were calculated using an inverse Laplace transform for emulsions prepared with toluene between 15 and 60 wt% (Fig. 9). The measured diffusion coefficients are independent of the NMR observation times (6.3 ms to 3 s), i.e. unrestricted diffusion is probed for all samples. The diffusion coefficients lie between (1.7 ± 0.3) × 10−11 m2 s−1 (60 wt%) and (3.0 ± 0.3) × 10−11 m2 s−1 (30 wt%). Using the Stokes–Einstein equation (eqn (3)), this diffusion coefficient range corresponds to a size range of 15 to 26 nm diameter, which fits well with the size range of the oil swollen micelles detected by DLS (9–30 nm, Fig. 4). Between 15 and 35 wt% toluene, the diffusion coefficient remains approximately constant at an average value of D = (2.7 ± 0.1) × 10−11 m2 s−1 whereas it is a decreasing function of oil concentration spanning from (2.4 ± 0.3) × 10−11 to (1.7 ± 0.3) × 10−11 m2 s−1 at higher oil content between 40 and 60 wt% toluene. This indicates that at high oil droplet concentration, oil swollen micelles associated with slower diffusion coefficients are on average larger in comparison with the more dilute emulsions.
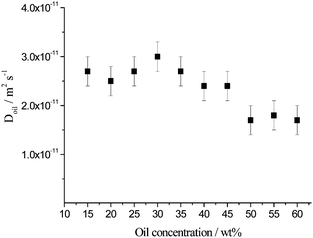 | ||
| Fig. 9 Diffusion coefficients of the oil signal corresponding to the oil swollen micelles present in the expelled aqueous phase of emulsions aged for 1 month prepared with toluene between 15 and 60 wt% for Δ between 6.3 ms and 3 s. | ||
Emulsion age, microstructure and diffusion
The effect of emulsion age on the diffusion of the oil phase was evaluated by performing PFG-NMR experiments continuously over 70 h for a constant observation time, Δ = 60 ms. Emulsion samples were placed in the spectrometer and left unperturbed during the ageing experiment (Fig. 10). In this way the rf coil used to detect the FID signals detected signals from both the upper concentrated emulsion and the lower expelled aqueous phase when both fractions of the sample were contained within the coil dimensions. Depending on the original concentration of toluene it was not always possible to see both the upper concentrated emulsion and the lower expelled aqueous phase throughout the entire 70 h experiment. For example, if only a small amount of expelled aqueous phase was present at the bottom of the NMR tube it would sit below the rf coil and hence not be detected and similarly, particularly so in the case of dilute emulsion samples, if the amount of expelled aqueous phase, upon emulsion ageing, was very large the concentrated aged upper emulsion would sit above the rf coil and hence could also not be detected. Under all other circumstances both the upper and lower portions were simultaneously detected.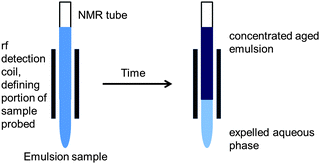 | ||
| Fig. 10 Position of a phase separated emulsion sample with respect to the spectrometer detection coil upon PFG-NMR ageing experiments. Note that depending on the age and the concentration of the emulsion one of the following scenarios was met at any given time: (1) both the upper concentrated emulsion and lower expelled aqueous phase; (2) the upper concentrated emulsion only; or (3) the lower expelled aqueous phase only were housed within the rf detection coil. | ||
The distribution of diffusion coefficients can be associated with a number of different motions of the oil molecules with in the sample. These include: (1) the unrestricted diffusion of oil droplets, which do not encounter other oil droplets and are therefore unhindered in their diffusion during the NMR observation time; (2) the restricted diffusion of oil droplets which do encounter other oil droplets during the NMR observation time and hence their apparent diffusion is reduced; (3) the unrestricted diffusion of oil swollen micelles, which do not encounter other oil droplets or oil swollen micelles during the NMR observation time; (4) the restricted diffusion of oil swollen micelles which encounter other oil droplets or oil swollen micelles during the NMR observation time; (5) unrestricted diffusion of oil molecules within an oil droplet which do not encounter the walls of the oil droplet during the NMR observation time; and (6) restricted diffusion of oil molecules within droplets and oil swollen micelles which have a reduced apparent diffusion coefficient due to interacting with the walls of the droplets during the NMR observation time.
Because of the vastly different sizes of an individual toluene molecule, an oil swollen micelle and an emulsion droplet the unrestricted diffusion coefficients of these three entities is separated by several orders of magnitude. Hence, which motions are observed depend on the droplet and oil swollen micelle size distributions coupled with the dependence of the diffusion spectra on the observation time, Δ.6 We note however that unrestricted diffusion of oil molecules confined within droplets and oil swollen micelles measuring ∼9 nm to ∼16 μm diameter upon ageing (Fig. 2) cannot be detected in our experiments.
Between 5 wt% and ∼55 wt% toluene in fresh emulsions, the average small size of the oil swollen micelles and the oil droplets precludes restricted diffusion of oil molecules within such confinements being observed. This is due to the limit in the observation times that are possible (6.3 ms to 3 s) and the lower measurable limit of the diffusion coefficients (∼10−14 m2 s−1). In aged emulsions by contrast, given the increase of the average droplet size over time (Fig. 2), restricted diffusion of oil molecules within droplets can now be measured.
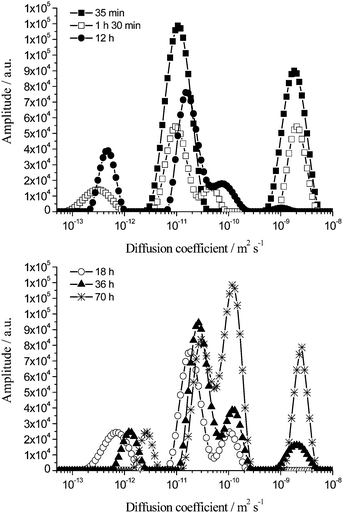
In Fig. 11 is shown the variation of the diffusion spectra (extracted from the attenuation data using an inverse Laplace transform) of the oil with time at Δ = 60 ms for a 40 wt% toluene emulsion representative of the behaviour of the emulsions.
The diffusion spectrum recorded 35 min after emulsification of a 40 wt% toluene emulsion is comprised of two peaks centred at ∼1.5 × 10⁻¹¹ m2 s−1 (middle peak) and ∼2.0 × 10⁻⁹ m2 s−1 (peak corresponding to fastest diffusion).
In this sample restricted diffusion of oil molecules within droplets is detected as early as 90 min post emulsion formulation due to the large oil volume fraction. Such restricted diffusion results in the appearance of a peak centred at ∼3.0 × 10⁻¹³ m2 s−1. This peak is attributed to the restricted diffusion of oil molecules within droplets measuring 0.3 μm to 1 μm diameter (as estimated using eqn (4)). This peak starts to shift to faster diffusion coefficient values ∼12 h after emulsification. This emphasises the occurrence of droplet growth which continues throughout the timeframe of investigation (70 h). By 70 h this peak now pertains to the restricted diffusion of oil within droplets between 1 μm and 2.5 μm diameter.
Considering the peak associated with the fastest diffusion, centred at ∼2.0 × 10⁻⁹ m2 s−1, and associated with the unrestricted diffusion of toluene molecules dissolved directly in the continuous phase, its amplitude decreases over time and by 18 h it has totally disappeared. This indicates that after macroscopic phase separation is initiated (∼10 h for a 40 wt% toluene emulsion), the volume fraction of expelled phase is negligible and cannot be detected by the coil as mentioned above. However, after ∼36 h the volume of expelled aqueous phase has increased sufficiently to be detected by the rf coil and this results in the reappearance of this fast diffusion coefficient peak, centred at ∼2.0 × 10⁻⁹ m2 s−1. Hence at the beginning it represents the unrestricted diffusion of the toluene molecules dissolved in the continuous phase of the emulsion and at long times to the unrestricted diffusion of the toluene molecules dissolved in the expelled aqueous phase.
With the peaks associated with the fastest and slowest diffusions within the sample accounted for, the remaining peaks in the diffusion coefficient distribution need to be considered. For t = 1 h 30 min there are two peaks. The peak centred at ∼1.0 × 10⁻¹¹ m2 s−1 corresponds to the unrestricted diffusion of oil swollen micelles and the restricted diffusion of droplets up to 0.2 μm. The final peak has limits of ∼3.0 × 10⁻¹¹ m2 s−1 and ∼1.0 × 10⁻¹⁰ m2 s−1 and is centred at ∼4.5 × 10⁻¹¹ m2 s−1. The amplitude of this peak increases over time and this is coupled with the peak shifting to faster diffusion coefficients. Collectively these are suggestive of the peak being due to the restricted diffusion of oil molecules within the largest droplets (8 μm to 19 μm diameter, eqn (4)). This is in agreement with the SLS data (Fig. 2).
On the other hand, the shift of the peak initially centred at ∼1.0 × 10⁻¹¹ m2 s−1 to faster diffusion coefficients may be attributed to two contributions. These include the increase of the signal detected by the rf coil from the expelled bottom aqueous phase at the expense of the signal from the upper concentrated aged emulsion and the detection of the restricted diffusion of oil molecules within medium size droplets (3 μm to 7 μm, eqn (4)).
The above analysis confirms the direct correlation between the PFG-NMR diffusion spectra of the oil signal and the SLS droplet size distributions for aged toluene emulsions.
Emulsion age and oil transfer
The age of the emulsion significantly affects the time scale at which oil exchange between droplets occurs in the system. The NMR switching time, Δswitch varies as a function of emulsion age (Fig. 12). The switching time, Δswitch, was measured for 15 wt%, 25 wt%, 40 wt% and 65 wt% toluene emulsions that were left unperturbed in the spectrometer for 70 h (Fig. 10 and 12). Note that the measurement of Δswitch was not possible over the entire 70 h period for both the 15 and 25 wt% toluene emulsions due to the appearance of a droplet size gradient, i.e. two emulsion layers being apparent in the sample tube due to gravitational effects. In the 15 wt% oil sample, the spectrometer rf coil detects a signal mainly from the lower expelled aqueous phase between ∼40 h and ∼70 h, due to the large concentration of water in this sample. As such, during that period the measured value of Δswitch is erroneous since the detection volume of the coil does not include the whole volume of emulsion. The same is true for a 25 wt% oil sample between ∼7 h and ∼35 h. Despite the “gap” in the NMR data shown in Fig. 12 for both the 15 and 25 wt% oil samples, for the four toluene concentrations investigated, Δswitch is an increasing function of emulsion age.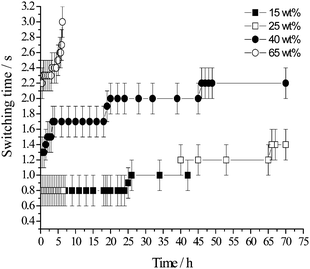 | ||
| Fig. 12 NMR switching time, Δswitch as a function of emulsion age for toluene concentration of 15, 25, 40 and 65 wt%. | ||
For the highest toluene concentration investigated, i.e. 65 wt%, Δswitch increases from ∼2.2 s 30 min following emulsification to ∼3.0 s after ∼6.25 h (Fig. 12). For times longer than ∼6.75 h, Δswitch is longer than the longest observation time available (∼3.0 s). The echo attenuation data follow a multiexponential decay only as a function of gradient strength for all values of Δ.
Upon decreasing oil concentration to 40 wt% toluene, Δswitch changes from ∼1.3 s (t = ∼30 min) to ∼2.2 s (t = ∼46 h–70 h). For 25 wt% oil emulsions, Δswitch increases from ∼0.8 s (t = ∼30 min) to ∼1.4 s (t = ∼66 h to 70 h). Finally, for 15 wt% oil, Δswitch changes from ∼0.8 s to ∼1 s over a 26 h period (Δswitch could not be determined for times longer than ∼42 h due to the occurrence of a droplet size gradient).
The motional rate of a droplet is proportional to the droplet size as seen by the Stokes–Einstein equation (eqn (3)). Firstly, considering droplet size alone, as the emulsion mean droplet size increases upon ageing, droplets move and interact with each other, on average, more slowly as compared with the fresh emulsions, resulting in a decrease of the droplet encounter frequency, and hence a decrease of the rate of oil exchange via permeation and/or reversible partial coalescence. This is consistent with Δswitch being an increasing function of the emulsion age.
In similarity with the switching time, the value of the motional averaging of the oil diffusion, calculated using an inverse Laplace transform of the single exponential decay raw data, varied with emulsion age (Fig. 13). The uncertainty was ±5%. At very high concentration, 65 wt% toluene, the motional averaging of the oil rises from ∼5.0 × 10⁻¹¹ m2 s−1 (t = ∼30 min) to ∼6.3 × 10⁻¹¹ m2 s−1 (3 h 15 min to 6 h post emulsification). For a 40 wt% toluene emulsion followed over the full 70 h the motional average oil diffusion coefficient varied from ∼1.5 × 10⁻¹¹ m2 s−1 (t = ∼30 min) to ∼4.7 × 10⁻¹¹ m2 s−1 (∼50 h to 70 h). 25 wt% toluene emulsions over this same timeframe resulted in the motional averaging increasing from ∼1.5 × 10⁻¹¹ m2 s−1 (t = ∼30 min) to ∼3.7 × 10⁻¹¹ m2 s−1 (∼65 h to 70 h). Finally at the lower oil content, 15 wt% toluene, the motional averaging initially at ∼1.3 × 10⁻¹¹ m2 s−1 rises to ∼1.9 × 10⁻¹¹ m2 s−1 (∼14 to 42 h).
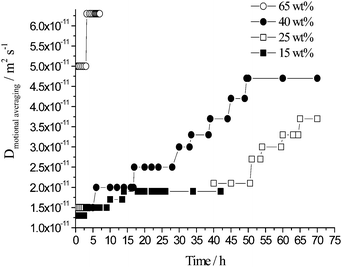 | ||
| Fig. 13 Motional averaging of the oil diffusion plotted against time, calculated using an inverse Laplace transform applied to the single exponential attenuation data for emulsions prepared with 15, 25, 40 and 65 wt% toluene, Δ ≥ Δswitch. | ||
For all four toluene concentrations investigated, the motional averaging of the oil diffusion increases with emulsion age which is consistent with the mean droplet size increasing with emulsion age leading to oil molecules being able to travel a longer distance within the droplets over the same duration before exchanging.
Discussion
Several authors have measured the time scale of oil exchange occurring between microemulsion droplets (∼1 nm to ∼30 nm diameter). The main technique used has been fluorescence quenching experiments, i.e. a probe and a fluorescence quencher are confined within droplets of separately prepared microemulsions and the rate-determining step of the fluorescence quenching is the exchange between droplets. The authors report that the oil exchange arises from the reversible coalescence of the microemulsion droplets occurring with time scales spanning from a few microseconds to a few milliseconds for both O/W microemulsions stabilised by nonionic surfactants7,8 and W/O microemulsions stabilised by ionic surfactants.9 Similar time scales have been experimentally determined considering oil exchange between microemulsion droplets via oil permeation upon droplet collision.10In kinetically stabilised emulsion systems, Taisne and Cabane probed oil exchange following a temperature quench leading to droplet growth and occurring via oil permeation upon droplet collision on the timescale of minutes.11 The time constant of the exchange spanned from ∼2 min at 26 °C to ∼20 min at 20 °C (oil volume fraction of 0.2).
These studies highlight the correlation between kinetics of oil transfer via oil permeation or reversible coalescence and droplet size, i.e. oil exchange occurs more slowly in emulsions than in microemulsions. This is partly due to the larger mean droplet size of emulsion systems as compared with microemulsions, leading to the slower motions of emulsion droplets (eqn (3)) and the concomitant decrease of the droplet encounter frequency.
The direct relationship between droplet size and kinetics of oil exchange for a given oil concentration was also evidenced in our PFG-NMR ageing experiments. In Fig. 14 is plotted Δswitchversus the SLS volume-based mean droplet diameter for a 65 wt% toluene emulsion. The observation time, Δswitch, is linearly dependent on the emulsion mean droplet size within the first 6 hours following emulsion formation, i.e. before macroscopic phase separation begins from ∼8 h. This is consistent with the time scale of the oil exchange being inversely proportional to the droplet collision frequency within the first 6 hours following emulsification. For emulsion ageing times longer than 6 hours, for 65 wt% toluene emulsions, the switching time was longer than the longest possible NMR observation time (3 s). Hence it was not possible to probe this relationship beyond the initial 6 hours subsequent to emulsion formulation.
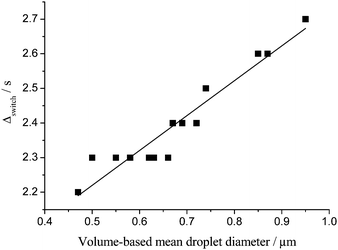 | ||
| Fig. 14 NMR switching time versus SLS mean droplet diameter within the first 6 hours following emulsification for an emulsion prepared with 65 wt% toluene. | ||
For the 40 wt% toluene emulsions, the Δswitchversus SLS volume-based mean droplet size plot is consistent with a linear relationship only within the first ∼4 h following emulsification (Fig. 15).
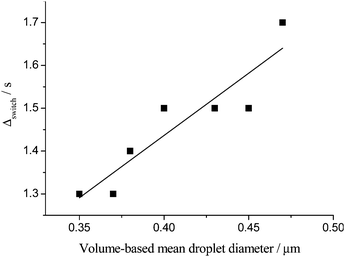 | ||
| Fig. 15 NMR switching time versus SLS mean droplet diameter within the first 4 hours following emulsification for an emulsion prepared with 40 wt% toluene. | ||
Beyond the first 4 hours the increase in the switching time as a function of emulsion age is slowed down compared with the first 4 hours of ageing (Fig. 12). In contrast the average droplet size continues to increase monotonically with ageing up to ∼10 hours at which time macroscopic phase separation is initiated and the aqueous continuous phase begins to be expelled. Motional averaging of the oil molecules occur on a rapid time scale despite the average droplet size continuing to increase, resulting in a slowing down of the oil droplets and a reduction in the number of droplet encounters per second, when considering droplet size alone.
However we do not observe a continual monotonic increase of the switching time on this basis. Hence, these data suggest that the increase of the mean droplet size, superposed to the concomitant decrease of the droplet collision frequency are not the sole contributions to the variation of the time scale of the oil exchange.
There is a decrease of the mean interdroplet spacing, along with the increase of the oil droplet size due to the upper emulsion becoming increasingly concentrated once phase separation has been initiated since the aqueous continuous phase is continuously expelled. Hence the oil exchange process is facilitated due to this concentrating effect leading to the increase of the rate of exchange as seen by the slowdown of the Δswitch function over time from ∼4 h to ∼70 h (Fig. 12).
For the more dilute samples, the switching time remains unchanged within the first few hours of the emulsion life, e.g. Δswitch = 0.8 s within the first 24 hours following emulsion formation for a 15 wt% toluene sample (Fig. 12), despite droplet growth occurring and macroscopic phase separation being initiated. Note that due to the presence of a droplet size gradient, a complete investigation of the dependence of the switching time on the droplet size was not possible. These data suggest that the increase of the emulsion mean droplet size and the concomitant decrease of the droplet encounter frequency upon ageing has a limited impact on the rate of oil exchange at low oil content.
Collectively these data indicate that in addition to droplet size and droplet concentration other parameters must control the time constant of oil transfer occurring via oil permeation or reversible partial coalescence. The properties of the interfacial domain including surfactant rigidity and chain length, degree of surfactant packing, Gibbs' elasticity, curvature or the association of a cosurfactant or ion with the interface must be of fundamental importance in defining the kinetics of oil transfer.
The surfactant molecular bending elasticity is proportional to the activation energy of hole nucleation,12 which is a rate-determining step for oil exchange occurring via either reversible partial coalescence or oil permeation.13,14 Therefore, it is expected that the rate of oil exchange is a decreasing function of the surfactant molecular bending elasticity as determined experimentally by Fletcher and Horsup.15
The surfactant chain length significantly affects the rate of surfactant desorption upon hole formation,16 hence the rate of oil exchange should be a decreasing function of surfactant chain length as confirmed experimentally by Jada et al.17
The addition of a cosurfactant such as benzyl alcohol or hexanol residing at the oil–water interface may interfere with the stabilising interactions between surfactant molecules (e.g. in the case of AOT), hence increasing the rate of exchange.10 The presence of cosurfactant can also alter the rate of exchange by swelling the surfactant head group region more than the surfactant tail volume. This favours a less negative (W/O emulsions) or more positive (O/W emulsions) spontaneous curvature of the surfactant film, hence facilitating (W/O emulsions) or hindering (O/W emulsions) oil exchange since hole formation is always coupled with the surfactant molecules being forced to adopt a curvature of opposite sign around the hole.9 In O/W emulsions this means the surfactant molecules must adopt a local highly negative curvature around the hole as the tail region is locally expanded and the head region is locally compressed (Fig. 16).
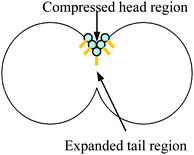 | ||
| Fig. 16 Hole nucleation in an O/W emulsion. | ||
Oil swollen micelles can be formed in the continuous phase of emulsions if there is an excess of surfactant molecules once the surface of the oil droplets is covered. The driving force for the formation of oil swollen micelles is the tendency of the surfactant layer to adopt its equilibrium mean curvature.18 The PFG-NMR data associated with the unrestricted motion of the oil swollen micelles in toluene/Triton X-100/water emulsions indicate that the oil swollen micelles get larger upon increasing toluene content (Fig. 9). As oil swollen micelles are thermodynamically stable, the mean curvature of the Triton X-100 layer in the oil swollen micelles is the equilibrium mean curvature. Therefore, the spontaneous curvature of the Triton X-100 layer becomes less positive upon increasing toluene concentration. The interfacial curvature is here controlled by both the Triton X-100 and the toluene due to the mutual solubilities of toluene, water and Triton X-100, the Triton X-100 alone is not the sole control agent. It is more energetically favourable for the Triton X-100 layer to curve less towards the oil upon increasing toluene content due to the dehydration of the ethylene oxide head groups upon decreasing the water concentration, resulting in a decrease of the distance between the head groups while the distance between the tails is maintained.19
Experimental
Triton X-100 (C8H17-(C6H4)-(OCH2CH2)n-OH) was purchased from BDH (purity 98%, n = 10 on average, ρ = 1.061 g cm−3 at 25 °C). A single batch number was used for all experiments. Toluene, purity greater than 99.9%, was purchased from Sigma-Adrich (ρ = 0.8669 g cm−3 at 25 °C). All reagents were used without further purification. Milli-Q water was used in the preparation of all emulsions. All experiments were performed at 25 °C. All experiments were repeated to reproducibility.A blade stirrer (Warring blender) delivering an energy of 65 J g−1 emulsion was used to achieve emulsion formation.20 Emulsions were prepared by maintaining the weight ratio of Triton X-100 to toluene at 1![[thin space (1/6-em)]](https://www.rsc.org/images/entities/char_2009.gif) :
:![[thin space (1/6-em)]](https://www.rsc.org/images/entities/char_2009.gif) 5. Toluene concentrations of 5–70 wt% were used (corresponding to volume fractions of the dispersed phase, φ, of 0.058–0.835). Oil-in-water emulsions were exclusively formed independent of oil concentration.5
5. Toluene concentrations of 5–70 wt% were used (corresponding to volume fractions of the dispersed phase, φ, of 0.058–0.835). Oil-in-water emulsions were exclusively formed independent of oil concentration.5
Static (SLS) and dynamic light scattering (DLS)
Droplet size was measured using a MALVERN Mastersizer 2000 with wavelengths of 633 nm and 452 nm, covering a size range from 0.02 μm to 2000 μm. The particle size distribution was calculated with the inherent Mastersizer software using Mie-Theory and assuming the sample is comprised of polydisperse particles with irregular shape. The refractive indices were taken as 1.390 for the oil droplets and 1.330 for the dispersant. An absorption value of 0.001 was used for all samples. Variation of this absorption value did not significantly alter the obtained distributions, as expected.Upon ageing the emulsions begin to expel the aqueous continuous phase resulting in an upper concentrated emulsion and a lower aqueous phase. No oil separation was observed for any samples. The size distributions of the aged systems were obtained by (1) sampling the upper concentrated emulsion or (2) gently shaking the system to redisperse the emulsion and removing an aliquot. Both methods yield the same droplet size distributions.
To sample the oil swollen micelles in the distribution a MALVERN Zetasizer nano-ZS was used, operating with a 633 nm laser covering a size range from 0.6 nm to 6 μm.
Pulsed field gradient-NMR (PFG-NMR)
In general, PFG-NMR has been applied to the detection of the diffusion of individual molecules moving within a solvent, where there is no boundary to diffusion, that is, so-called unrestricted diffusion. Probing the particle size distribution of dilute emulsions can therefore be accomplished via PFG-NMR investigations, where the unrestricted diffusion of individual molecules or particles moving in a solvent is directly determined.21 However, in emulsions the movement of the droplets may be restricted by the presence of the other droplets in the sample over the time frame of the experiment. Moreover, the diffusion of the molecules inside a droplet can be restricted as well, depending on both the size and shape of the droplet. Restricted diffusion, whether of the individual oil droplets or of oil molecules within the droplets, will depend on the magnitude of the diffusive length scale associated with the experimental observation time, Δ (the time between gradient pulses, see Fig. 17) in comparison with the structural dimensions (diameter of droplets and spacing of droplets) of the emulsion. It should be noted that because of the widely differing diffusion rates of individual molecules and macroscopic oil droplets, these two diffusions might occur over very different length scales and therefore correlate to different time scales in the NMR experiment.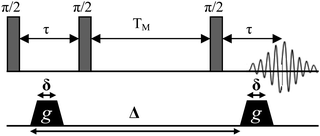 | ||
| Fig. 17 The stimulated echo pulse sequence. During a single experiment the attenuation is monitored as a function of gradient strength g, for a fixed value of Δ, the NMR observation time. In a series of experiments Δ may sequentially be changed. | ||
PFG-NMR experiments were performed using a standard stimulated echo pulse sequence (Fig. 17). The diffusion coefficients of the molecules or droplets are measured in the following way. The NMR echo signal of 1H nuclear spins (top Fig. 17) is observed in the presence of a pulsed field gradient of magnitude g and duration δ (bottom Fig. 17). Because molecules and droplets of a given substance diffuse during the observation time Δ, the echo signal is attenuated in correlation with the self-diffusion coefficient D according to eqn (1) (ref. 22 and 23)
 | (1) |
In the case of a pure substance or a monodisperse emulsion the echo attenuation can be described by a single diffusion coefficient, that is the summation in eqn (1) reduces to a single term (eqn (2))
 | (2) |
From the perspective of a single NMR experiment, different kinds of unrestricted and restricted diffusion can potentially be monitored simultaneously at one observation time, which considerably complicates the analysis of the data with respect to extracting a particle size distribution and time scales of dynamic processes. With respect to emulsions, or colloidal systems in general, polydispersity of the droplet size leads to further complications with the different motions being directly superimposed, such as, for example, if restricted diffusion in a large droplet overlaps with restricted diffusion of a small droplet. However, these different dynamic process can be differentiated by performing experiments over a range of observation times. Interactions between droplets may significantly influence the apparent diffusion coefficient of the molecules in the droplet phase. Thus, PFG-NMR may provide some insight regarding the solution dynamics.
All PFG-NMR experiments were carried out using a Bruker Avance-460 NMR system fitted with a diffusion probe. The temperature was controlled to within 0.1 °C using an airflow system. Calibration was performed using Milli-Q water with a known diffusion coefficient of 2.3 × 10⁻⁹ m2 s−1 at 25 °C.24 Diffusion measurements were performed using a stimulated echo pulse sequence (Fig. 17)22 for time scales Δ of 6.3 ms to 3 s (available observation window depending on the pulse sequence parameters and the sample relaxation constants) with a maximum gradient of 6.5 T m−1 and a gradient duration in the range 2.1–4.1 ms. The gradient stabilization time was 1 ms and the repetition time 3000 ms.
Both linear and non-linear decaying attenuation curves were obtained. The diffusion coefficients are extracted from the echo attenuation using a one-dimensional inverse Laplace transform, according to an algorithm first used by Provencher,4 using software developed by Callaghan et al. for a 2D inverse Laplace transform.25 The distribution of diffusion coefficients are determined by performing a non-negative least-squares fit on the exponentially decaying signal, weighted by an additional regularisation function. Ideally it leads to a sum of well-resolved delta functions.
Self-diffusion is the random translational motion of molecules or particles due to thermal energy. Translational diffusion is the most fundamental form of transport and is responsible for all chemical reactions. Diffusion is also closely related to molecular size, as can be seen from the Stokes–Einstein equation (eqn (3))
 | (3) |
When unrestricted diffusion occurs, the diffusion coefficient is independent of the observation time, Δ. By contrast, in emulsions the movement of molecules inside a droplet, or of droplets themselves can be restricted by the size and the shape of the droplets. Such restrictions depend on the magnitude of the diffusive length scale associated with the time Δ, in comparison with the structural dimensions (diameter of droplets and spacing of droplets) for the emulsion. Such effects can be used to probe the diffusive boundary and reveal the microstructure of the emulsion. When motion of a molecule is confined within a restricted spherical geometry such as an emulsion droplet, the limiting mean square displacement, Z, in one dimension is correlated with the size of the sphere viaeqn (4) (ref. 26)
 | (4) |
Conclusion
Ageing of toluene/Triton X-100/water emulsions was performed to assess how the process of dynamic oil exchange between droplets evolves with time.Data obtained from PFG-NMR ageing experiments reflected the growth of the oil droplets and the expulsion of the free toluene molecules and oil swollen micelles as part of the expelled continuous phase as a function of time resulting in gross phase separation.
Upon ageing the time scale of the oil exchange varies with droplet size and droplet encounter frequency. These two factors are however not the sole contributors in controlling the oil transfer which occurs via oil permeation through transient holes on the droplet surface or reversible partial coalescence mechanisms, the properties of the interfacial domain itself must also be considered. The properties of the interfacial domain, and in particular the surfactant packing, Gibbs' elasticity and equilibrium curvature vary as a function of concentration in the toluene/Triton X-100/water emulsion systems. These additional factors are responsible for the divergence of the switching time from a pure linear variation with droplet size. The effect of these interfacial characteristics on the lifetime of oil exchange as a function of varying oil concentration will be detailed in an upcoming paper.
References
- N. Malassagne-Bulgarelli and K. M. McGrath, Soft Matter, 2009, 5, 4804–4813 RSC
.
- M. A. Burschka, C. R. Doering and D. ben-Avraham, Phys. Rev. Lett., 1989, 63, 700–703 CrossRef
.
- S. N. Maindarkar, N. B. Raikar, P. Bongers and M. A. Henson, Colloids Surf., A, 2012, 396, 63–73 CrossRef CAS
.
- S. W. Provencher, Comput. Phys. Commun., 1982, 27, 229–242 CrossRef
.
- E.-H. Liu, P. T. Callaghan and K. M. McGrath, Langmuir, 2003, 19, 7249–7258 CrossRef CAS
.
- E.-H. Liu, H. Egger and K. M. McGrath, J. Phys. Chem. B, 2005, 109, 13332–13341 CrossRef CAS
.
- S. Clark, P. D. I. Fletcher and X. L. Ye, Langmuir, 1990, 6, 1301–1309 CrossRef CAS
.
- P. D. I. Fletcher and R. Johannsson, J. Chem. Soc., Faraday Trans., 1994, 90, 3567–3572 RSC
.
- P. D. I. Fletcher, A. M. Howe and B. H. Robinson, J. Chem. Soc., Faraday Trans., 1987, 83, 985–1006 CAS
.
- S. S. Atik and J. K. Thomas, J. Am. Chem. Soc., 1981, 103, 3543–3550 CrossRef CAS
.
- L. Taisne and B. Cabane, Langmuir, 1998, 14, 4744–4752 CrossRef CAS
.
- J. Prost and F. Rondelez, Nature, 1991, 350, 11–23 CrossRef CAS
.
- V. Schmitt, C. Cattelet and F. Leal-Calderon, Langmuir, 2004, 20, 46–52 CrossRef CAS
.
- A. Kabalnov and H. Wennerström, Langmuir, 1996, 12, 276–292 CrossRef CAS
.
- P. D. I. Fletcher and D. I. Horsup, J. Chem. Soc., Faraday Trans., 1992, 88, 855–864 RSC
.
- H. F. Eicke, J. C. W. Shepherd and A. ASteinemann, J. Colloid Interface Sci., 1976, 56, 168–176 CrossRef CAS
.
- A. Jada, J. Lang, R. Zana, R. Makhloufi, E. Hirsch and S. J. Candau, J. Phys. Chem., 1990, 94, 387–395 CrossRef CAS
.
- J. Weiss, J. N. Coupland, D. Brathwaite and D. J. McClements, Colloids Surf., A, 1997, 121, 53–60 CrossRef CAS
.
- J. Israelachivili, Colloids Surf., A, 1994, 91, 1–8 CrossRef
.
- E.-H. Liu and K. M. McGrath, Colloids Surf., A, 2005, 262, 101–112 CrossRef CAS
.
- L. Ambrosone, S. Murgia, G. Cinelli, M. Monduzzi and A. Ceglie, J. Phys. Chem. B, 2004, 108, 18472–18478 CrossRef CAS
.
- J. E. Tanner, J. Chem. Phys., 1970, 52, 2523–2526 CrossRef CAS
.
- D. E. Woessner, J. Chem. Phys., 1961, 34, 2057–2061 CrossRef CAS
.
- I. Lönnqvist, A. Khan and O. Söderman, J. Colloid Interface Sci., 1991, 144, 401–411 CrossRef
.
- P. T. Callaghan, S. Godefroy and B. N. Ryland, Magn. Reson. Imaging, 2003, 221, 243–248 CrossRef
.
-
P. T. Callaghan, Principles of Nuclear Magnetic Resonance Microscopy, Oxford University Press, New York, 1991 Search PubMed
.
| This journal is © The Royal Society of Chemistry 2013 |

