Persistence length of polyelectrolytes with precisely located charges†
Hannah K.
Murnen‡
a,
Adrianne M.
Rosales‡
a,
Andrey V.
Dobrynin
b,
Ronald N.
Zuckermann
c and
Rachel A.
Segalman
*a
aDepartment of Chemical and Biomolecular Engineering, University of California, Berkeley, CA 94720, USA. E-mail: segalman@berkeley.edu
bInstitute of Materials Science, University of Connecticut, Storrs, Connecticut 06269, USA
cMolecular Foundry, Lawrence Berkeley National Laboratory, Berkeley, CA 94720, USA
First published on 16th October 2012
Abstract
The conformation of polyelectrolytes in aqueous salt solutions is closely related to their self-assembly properties. In particular, the persistence length has a large impact on how the chain can arrange itself. In this work, biomimetic poly N-substituted glycines (polypeptoids) have been designed to position charged side chains at precise distances from each other to elucidate the relationship between the spacing of the charges along the backbone, the ionic strength, and the persistence length. Using small angle neutron scattering (SANS), it is shown that at low ionic strength, polypeptoids with charged groups located closer to each other along the polymer backbone are stiffer than those with the charged groups spaced further apart. At high ionic strength, the total persistence length decreases for both macromolecules because the electrostatic repulsions between ionized groups are screened. The measured persistence lengths were compared to those calculated using a discrete chain model with bending rigidity, and it is shown that the electrostatic persistence length scales quadratically with the Debye screening length. It is also shown that the bare persistence length of a molecule with alternating ionizable and hydrophilic groups is larger than that of a molecule containing 100% ionizable groups. This difference can be attributed to the longer hydrophilic side chains that may induce local chain stiffening.
Introduction
The effect of electrostatic interactions on conformations of charged polymers in solutions and at interfaces has long been of interest due to its relevance in fields ranging from ion-exchange membranes to biopolymers such as DNA and proteins. Interactions between ionized groups play a dominant role in polyelectrolyte conformations due to electrostatically induced stiffening and swelling of the polyelectrolytes.1,2 Furthermore, the strength and range of these interactions can be controlled by changing salt concentration in solutions. Salt ions screen the long-range electrostatic repulsion between ionized groups on the polymer backbone, reducing chain swelling and bending rigidity.3 Presence of salt can also shift the ionization equilibrium,4 reducing the charge density along the polymer backbone and altering the chain conformation. Understanding the relationship between polyelectrolyte conformations, charged group distribution along the polymer backbone, and ionic strength is a complex problem that has been studied experimentally, theoretically, and in computer simulations.3,5–14One of the most common measures of polyelectrolyte chain conformation is the persistence length. Persistence length impacts a wide range of polymer properties, such as intrinsic viscosity,15 electrical conductivity,16 and in concentrated solutions or in the bulk, ion clustering.17 Thus, understanding chain conformation of these charged polymers lends insight into their functional properties. For example, Wang et al. measured the persistence length of a water-soluble conjugated polymer in semi-dilute solution to determine the effect of chain conformation on photoluminescence and found the presence of large aggregates.18,19 Upon the addition of a cationic surfactant, the electrostatic interactions are screened and the aggregates decrease in size, leading to a remarkable enhancement in photoluminescent efficiency. Further control over chain shape and charge spacing is therefore desirable to design highly functional materials. Recent research on charged polymers in the solid state has examined the influence of polymer architecture and monomer sequence on the spacing of ionic clusters.20,21 However, these parameters are not easily probed in synthetic polyelectrolytes, and to this end, biologically relevant polymers have proved useful, as they contain sequence specificity and defined secondary structures.
Experimental studies of biologically relevant polyelectrolytes in water have mostly focused on DNA. The effect of ionic strength on the persistence length of DNA has been studied using a variety of techniques, such as light scattering,22,23 force-extension24 experiments, dielectric spectroscopy,25,26 and fluorescence microscopy.27 However, the measurement of the persistence length can be convoluted by these techniques. For example, at high and moderate salt concentrations, a persistence length obtained by light scattering measurements for sufficiently long macromolecules can include an excluded volume contribution. In addition, force-extension experiments can underestimate values of the persistence length due to enthalpic effects associated with stretching the molecules at forces above 5 pN. Because of these issues, the relationship between ionic strength and DNA persistence length is difficult to quantify, and experimental observations often contradict each other. Various techniques have also been used to measure the ionic strength dependence of the persistence length for other biopolymers.28–31 In particular, light scattering has been used to determine a salt concentration dependence of the persistence length of hyaluronan32 and a polysaccharide,33 but aggregation can complicate measurements at low ionic strength, as seen in a neutron scattering study by Bonnet et al.34 Similar issues lead to very few studies for polypeptides.35,36
Theoretical studies on the chain conformation of polyelectrolytes also lead to much debate. The total persistence length for a polyelectrolyte contains contributions from both the bare persistence length of the chain and the electrostatic persistence length. Much of the debate on developing theoretical models for polyelectrolyte systems has centered on the flexibility of the underlying chain and how it impacts the scaling of the electrostatic persistence length with regards to ionic strength.37–39 On the one hand, theory originating with Kuhn, Kunzle, and Katchalsky40 suggests that persistence length scales with the inverse of the square root of the salt concentration (i.e., a linear dependence on the Debye screening length); this calculation corresponds to a flexible or semi-flexible chain with electrostatic corrections. On the other hand, OSF1,2,41–43 theory shows the persistence length scales with the inverse of the salt concentration (i.e., a quadratic dependence on the Debye screening length); OSF theories assume a locally stiff chain for which electrostatic interactions can modify the bending properties. In both cases, theory has been developed over the past several decades, and neither fully accounts for experimental observations. Given the difficulties in obtaining a definitive result for the verification of scaling laws, it is useful to investigate a simplified system in which factors such as chain length and charge distribution along the polymer backbone can be controlled with high accuracy.
The simplified system we will therefore focus on is polypeptoids, which are sequence-specific poly(N-substituted glycines).44 Biological polyelectrolytes have a sequence-specific arrangement of the charged groups along their backbone, and the sequence of charged groups is essential to the structure and function of the macromolecule. However, natural biopolymers also have many other interactions that impact their persistence length. For instance, polypeptides are inherently chiral and form intramolecular and intermolecular hydrogen bonds. They can also have strong hydrophobic interactions that drive a chain to collapse. Polypeptoids, however, do not have these competing interactions due in large part to their backbone chemistry. Polypeptoids have the same backbone as polypeptides, but the side chain is attached to the nitrogen rather than the backbone α-carbon. This N-substitution eliminates chirality and intra and intermolecular hydrogen bonding in the backbone, allowing the interactions in the system to be tuned by the introduction of different side chains. Furthermore, these materials are synthesized using a solid phase submonomer process that leads to sequence specific, monodisperse chains. In addition to serving as model biomimetic polymers, polypeptoids are an interesting self-assembly material in their own right.45 In solution, they can assemble into supramolecular helices46 and nanometer-thick sheets.47–49 To model and understand these assemblies, it is important to have a basic understanding of polypeptoid behavior with regard to ionic interactions.
In this paper, we explore the impact of charge density on chain stiffness using polypeptoids with either 100% carboxyl groups or 50% carboxyl groups (in an alternating sequence). The persistence lengths of these molecules have been measured using small angle neutron scattering (SANS). The results show that at low ionic strength, a polypeptoid in which every monomer contains an ionizable group has a higher persistence length than a polypeptoid in which ionizable and hydrophilic monomers alternate. At high ionic strength, this difference is far smaller, and both polypeptoids show a decrease in persistence length. The data has been analyzed using a semi-flexible chain model, and it is shown that the persistence length has a quadratic dependence on the Debye screening length. It is also shown that the bare bending rigidity is higher for the macromolecule with alternating charged group distribution. This result is attributed to the effect of the longer hydrophilic side chains that can induce local chain stiffening.
Experimental methods
Synthesis
Polypeptoids were synthesized on a commercial robotic synthesizer Aapptec Apex 396 on 100 mg of Rink amide polystyrene resin (0.6 mmol g−1, Novabiochem, San Diego, CA) using the procedure previously detailed.50,51 All primary amine monomers, solvents, and reagents were purchased from commercial sources and used without further purification. The β-alanine was purchased from ChemImpex and used after freebasing from the β-alanine O-tBu ester hydrochloride submonomer by extraction from dichloromethane and basic water. The resulting compound was confirmed by 1H NMR. All primary amine submonomers were 1.5 M in N-methyl-pyrrolidone, and all displacement times were 60 minutes for the first 15 additions, 90 minutes for the next 15 additions, and 120 minutes for the remaining additions. All polypeptoids were acetylated on the resin and purified using reverse phase HPLC as previously described.51 The mass and purity were confirmed using reverse phase analytical HPLC and MALDI. All polymers synthesized are listed in Table 1 along with their purities and molecular weights.| Polymer | Abbreviation | Purity | Obs/actual MW | Structure |
|---|---|---|---|---|
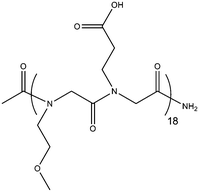
| Acetyl-poly(N-carboxyethyl glycine-N-methoxyethyl glycine)18 | Ac-p(NmeNce)18 | 98% | 4487.1/4488.2 |
|
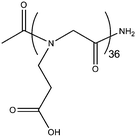
| Acetyl-poly(N-carboxyethyl glycine)36 | Ac-p(Nce)36 | 97% | 4737.0/4737.6 |
|
Small angle neutron scattering (SANS) measurements and data fitting
SANS measurements were conducted at two different facilities: the NG3 SANS line at the National Institute of Standards and Technology (NIST) Center for Neutron Research in Gaithersburg, Maryland and the CG-3 Bio-SANS line at the High Flux Isotope Reactor at Oak Ridge National Laboratory (ORNL) in Oak Ridge, Tennessee. Samples were prepared at a concentration of 10 mg ml−1 in deuterated water to enhance the contrast between the polypeptoids and the solvent.The experiments at NIST were conducted using a neutron wavelength of 6 Å and two sample-to-detector distances: 1.3 m and 4 m, which corresponded to a q-range of approximately 0.003–0.5 Å−1. Raw intensity measurements were corrected for the detector efficiency and the dark current, and absolute intensities (units of cm−1) were calculated using a direct beam measurement from an empty cell. Quartz banjo cells (Hellma USA, Plainview, NY) with a path length of 1 mm were used in a temperature controlled multiple position sample holder. The data were reduced using the NCNR SANS reduction macros52 in Igor Pro. For each sample, data from each q range was merged, and the scattering contribution from the solvent (deuterated water) was subtracted. Samples containing 1× and 3× charging levels were measured at NIST.
The experiments at ORNL were also conducted using a neutron wavelength of 6 Å and two sample-to-detector distances: 1.7 m and 14.5 m, which corresponded to a q-range of approximately 0.003–0.5 Å−1. Raw intensity measurements were corrected for the detector efficiency and the dark current, and absolute intensities (units of cm−1) were calculated using a direct beam measurement from an empty cell. Quartz banjo cells (Hellma USA, Plainview, NY) with a path length of 2 mm were used in a temperature controlled multiple position sample holder. The data were reduced using the Spice SANS reduction program in Igor Pro. For each sample, data from each q range was merged, and the scattering contribution from the solvent (deuterated water) was subtracted. Samples containing 10× and 30× charging levels were measured at ORNL.
The scattering intensity of the reduced sample data was fit to a semiflexible cylinder model with excluded volume using the Igor data analysis package provided by NCNR at NIST. In its simplest form, the scattering intensity can be represented as
| I(q) = KP(q) + Iincoherent | (1) |
Titration
The charge state of each molecule was probed through titrations with sodium hydroxide (NaOH). Sodium hydroxide (0.5 M) was added in increments of 2 μl to solutions of Ac-p(Nce)36 (2.1 mM, 10 mg ml−1) and Ac-p(NmeNce)18 (2.2 mM, 10 mg ml−1) while stirring. The pH was allowed to equilibrate over 1 to 2 minutes before being measured. These pH values were plotted against the molar equivalents of NaOH per COOH group. Using the Henderson Hasselbach equation, the percent dissociation values were calculated for each point along the titration curve.Solutions
Solutions (Table 2) were made by dissolving the desired polymer at a concentration of 10 mg ml−1 (2.1 mM for Ac-p(Nce)36 and 2.2 mM for Ac-p(NmeNce)18) in water. The ionic strength was adjusted by adding various amounts of 0.5 M NaOH. The correct volume of NaOH was determined by calculating the molar concentration of COOH groups and providing the desired molar equivalent of NaOH.| Sample | Polymer | NaOH equiv. | [NaOH] (M) | Overall fraction charged monomers, α | Measured Lp (nm) |
|---|---|---|---|---|---|
| 1 | Ac-p(Nce)36 | 1 | 0.04 | 0.48 | 0.7 ± 0.2 |
| 2 | Ac-p(Nce)36 | 3 | 0.15 | 1 | 0.9 ± 0.3 |
| 3 | Ac-p(Nce)36 | 10 | 0.68 | 1 | 0.41 ± 0.06 |
| 4 | Ac-p(Nce)36 | 30 | 2.19 | 1 | 0.4 ± 0.2 |
| 5 | Ac-p(NmeNce)18 | 1 | 0.03 | 0.18 | 0.54 ± 0.02 |
| 6 | Ac-p(NmeNce)18 | 3 | 0.08 | 0.50 | 0.62 ± 0.2 |
| 7 | Ac-p(NmeNce)18 | 10 | 0.36 | 0.50 | 0.57 ± 0.03 |
| 8 | Ac-p(NmeNce)18 | 30 | 1.15 | 0.50 | 0.45 ± 0.03 |
Results and discussion
Two polymers were designed to probe the effect of charge location on the chain conformation in aqueous solution. The use of solid phase-synthesized polypeptoids allowed the specification of the exact location for each monomer as well as exact monodispersity for each chain. It was anticipated that this design would eliminate ambiguities present in studies of synthetic polyelectrolytes due to polydispersity and uncertainty of ionized charge group distribution along the polymer backbone. In addition, the simplified nature of the polypeptoid system in comparison to other biopolymers allows the isolation of the effect of the charged groups without the impact of backbone hydrogen bonding or chirality. The first polymer, Ac-p(NmeNce)18 (Table 1) was designed to contain alternating ionizable monomers, N-2-carboxyethyl glycine, and hydrophilic monomers, N-2-methoxyethyl glycine. The second polymer, Ac-p(Nce)36, contained 100% ionizable groups. When Ac-p(Nce)36 is completely charged, the negative charges are adjacent to each other. The location of these charges was expected to have an impact on the chain behavior in solution because the charges that are directly next to each other will have a stronger electrostatic repulsion than the charges that are spaced further apart.The ionization of the carboxylic acid side chains is pH-dependent, and a titration with sodium hydroxide shows the relative charge states of each polymer. Interestingly, it is easier to deprotonate Ac-p(Nce)36 than Ac-p(NmeNce)18 as seen in Fig. 1. Fewer equivalents of NaOH were required to reach the equivalence point and eventually full deprotonation for Ac-p(Nce)36. This result may be because when the ionizable groups are directly next to each other, they can more easily share sodium ions, allowing the charges to be more evenly distributed. However, this may also be a kinetic effect, as both molecules tend to form aggregates over long times. To further examine this trend, additional molecules with carboxyl side chains spaced every third and every fourth monomer apart (Ac-p(Nme2Nce)12 and Ac-p(Nme3Nce)9) were studied and found to require the same amount of NaOH as Ac-p(NmeNce)18 if sufficient time was allowed for the system to stabilize (data shown in ESI, Fig. S1†). All solutions studied were made and filtered immediately prior to SANS experiments to avoid aggregation.
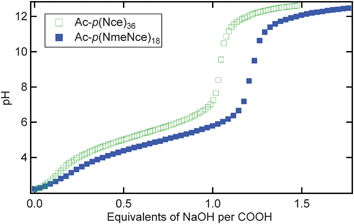 | ||
| Fig. 1 The titration curves of Ac-p(Nce)36 (open green squares) and Ac-p(NmeNce)18 (solid blue squares) as pH versus equivalents of NaOH. | ||
Solutions were made with each polymer and various concentrations of NaOH (Table 2). When the solutions contained 1 equivalent of NaOH, the polymers were only partially charged. From the titration curve equivalence point, it is calculated that the acid groups on Ac-p(Nce)36 (sample 1) are 48% charged while those on Ac-p(NmeNce)18 (sample 5) are 35% charged. Because only 50% of the monomers in Ac-p(NmeNce)18 are ionizable, the overall fraction of monomers that are charged, α, is actually 18%. The subsequent solutions were all made using higher concentrations of sodium hydroxide (3×, 10×, 30×), where all of the carboxylic acids are negatively charged. In these solutions, adding more sodium hydroxide simply increases the ionic strength and provides screening of the electrostatic repulsion between ionizable groups.
In order to obtain information about the conformation of these molecules at the various ionic strengths, small angle neutron scattering (SANS) experiments were performed. As a first assessment of the polymer conformation, the SANS data was plotted on a Kratky plot (Q2I versus Q), as shown in Fig. 2. The shape of this plot provides information about the polymer and its arrangement in solution. Fig. 2a shows the Kratky plot for Ac-p(Nce)36 at various equivalents of NaOH. The data for both the 1× and 3× solutions increase monotonically, indicating that the molecule is dispersed in solution. However, for both the 10× and 30× solutions, there is a distinct difference in the shape of the data curves. The data have a hump with a peak around 0.1–0.15 Å−1. This hump indicates that the macromolecule has a more coiled configuration in solution. This is likely due to the fact that when the amount of sodium in the solution is relatively low (in the 1× and 3× case), the ionized groups cause the macromolecule to remain extended. However, when more NaOH is added (in the case of 10× and 30× solutions), the macromolecule can also form complexes between the positive sodium and the negative carboxylic acids. This is known as the counterion condensation effect,4 and it pulls the molecule into a more coiled state. A similar trend is seen for Ac-p(NmeNce)18. The decrease in chain size due to counterion condensation has been observed experimentally54,55 and in computer simulations.56,57 While radius of gyration (Rg) measurements would be helpful in confirming this analysis, low signal to noise ratio in the small q range (Guinier region) of the scattering data makes it difficult to obtain reliable Rg values. In addition, the Rg measurement may be convoluted by any complexation of the polypeptoid with sodium ions.
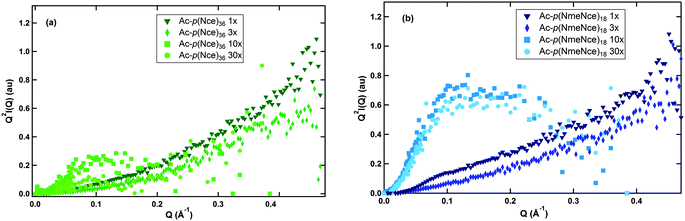 | ||
| Fig. 2 Kratky plots for each polymer solution. (a) Includes the traces for Ac-p(Nce)36 while (b) includes the traces for Ac-p(NmeNce)18. For both polymers the solutions with 10× and 30× NaOH equivalents show peaks while the solutions with 1× and 3× NaOH equivalents monotonically increase. | ||
In order to understand the effect of electrostatic interactions on chain configurations, a semi-flexible chain model53 was used to fit the SANS data and to obtain a value of persistence length, Lp, for each ionic strength. These data are summarized in Table 2. In agreement with previous measurements of polypeptoid persistence lengths,58 these macromolecules are quite flexible with persistence lengths ranging from 0.4 nm up to approximately 1 nm. Dependence of the persistence length on NaOH concentration is shown in Fig. 3. The chain persistence length first increases with increasing NaOH concentration, then it begins to decrease as more NaOH is added. The initial increase is due to the NaOH behaving as a titrant, increasing the fraction of ionized groups along the polymer backbone. Electrostatic repulsion between these ionized groups stiffens the polymer chain, resulting in an increase in persistence length. As more sodium hydroxide is added, the persistence length decreases as expected because the added salt ions screen electrostatic interactions between ionized groups along the polymer backbone, making the macromolecules more flexible. This is in line with the qualitative results from the Kratky plots, where it was seen that the molecules adopted more coiled conformations (and therefore were more flexible) at higher ionic strengths. There is also a difference between the two polymers, particularly at low NaOH concentrations. The Ac-p(Nce)36 has a larger Lp at these concentrations, which is presumably due to the close proximity of the charged groups along the backbone and the larger overall amount of charge as compared to Ac-p(NmeNce)18. These two factors both contribute to increase the persistence length for Ac-p(Nce)36, demonstrating that the amount of charge has the ability to influence the polymer conformation in solution.
![The persistence lengths for Ac-p(Nce)36 (open green squares) and Ac-p(NmeNce)18 (closed blue squares). The red dashed line is the best fit line using the expression Lp = f + g[NaOH]−0.5.](/image/article/2013/SM/c2sm26849c/c2sm26849c-f3.gif) | ||
| Fig. 3 The persistence lengths for Ac-p(Nce)36 (open green squares) and Ac-p(NmeNce)18 (closed blue squares). The red dashed line is the best fit line using the expression Lp = f + g[NaOH]−0.5. | ||
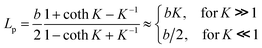
As discussed in the introduction, the most common treatment for the theoretical scaling of persistence length with salt for polyelectrolytes is the work of Odijk1,41–43 and Skolnick and Fixman,59 who showed that for locally stiff polyelectrolytes, the persistence length should scale directly with the inverse of the salt concentration. This relationship holds well for low salt concentrations and for relatively stiff polyelectrolytes. However, at high salt concentrations and for more flexible polyelectrolytes, there is significant deviation from the OSF model. Several experimental60 and theoretical61,62 studies have shown that the persistence length of flexible polyelectrolytes is actually inversely proportional to the square root of the salt concentration, or chain persistence length scales linearly with the Debye screening length. These results hold especially well for polyelectrolytes that do not assume locally stiff conformations. Given the very low persistence length values measured here, it is likely that the polyelectrolytes described in this paper do not adopt locally stiff conformations. Therefore, it is possible to examine the scaling dependence of the persistence length on the ionic strength by fitting experimental data to the following equation
| Lp = f + g[NaOH]−0.5 | (2) |
Below we will account for the finite chain length and map our polymers into a discrete chain model with internal bending rigidity.63 In the framework of this model,63 chain properties are described by two independent parameters: effective chain bond length b and chain bending constant K. For effective bond length, we will use a projection length of a bond in zig–zag conformation, which gives a value of b = 0.37 nm. In the case of charged polymers, a chain bending constant K has contributions from the bare chain bending rigidity K0 and from the electrostatic interactions between ionized groups along the polymer backbone (details shown in the ESI†):64
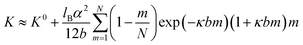 | (3) |
 | (4) |
This equation was used to fit the measured persistence length as a function of NaOH concentration as shown in Fig. 4 by considering K0 in eqn (3) as fitting parameter. For both peptoids, the agreement between experimental and calculated values is very good. The biggest difference is observed for values of the persistence length at the highest ionic strength. As shown in Table 3, the value of the bare bending constant K0 is larger for the Ac-p(NmeNce)18 peptoid, which could be due to the longer side chain causing local chain stiffening. In Fig. 4, we plot the electrostatic contribution to the chain bending constant. All of the data collapse onto a universal line, confirming the quadratic dependence of the chain persistence length on the Debye screening length and illustrating the high quality of the fitting procedure.
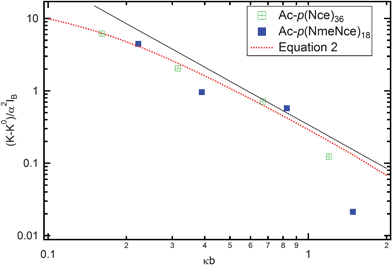 | ||
| Fig. 4 Electrostatic contribution to the chain persistence length as a function of the reduced Debye screening length. Experimental data for Ac-p(NmeNce)18 are shown as open circles and those for Ac-p(Nce)36) shown as filled circles. Dashed red line corresponds to eqn (3). The solid black line illustrating a quadratic scaling serves as a guide to the eye. | ||
| Sample | Polymer, NaOH equivalent | K 0 | K | L p,calc (nm) | L p,fit (nm) | Radius, Rfit (nm) |
|---|---|---|---|---|---|---|
| 1 | Ac-p(Nce)36, 1× | 0.975 | 1.92 | 0.71 | 0.7 ± 0.2 | 0.65 ± 0.03 |
| 2 | Ac-p(Nce)36, 3× | 0.975 | 2.35 | 0.87 | 0.9 ± 0.3 | 0.45 ± 0.01 |
| 3 | Ac-p(Nce)36, 10× | 0.975 | 1.22 | 0.45 | 0.41 ± 0.06 | 0.98 ± 0.04 |
| 4 | Ac-p(Nce)36, 30× | 0.975 | 1.03 | 0.38 | 0.40 ± 0.2 | 0.46 ± 0.02 |
| 5 | Ac-p(NmeNce)18, 1× | 1.43 | 1.41 | 0.52 | 0.54 ± 0.02 | 0.54 ± 0.01 |
| 6 | Ac-p(NmeNce)18, 3× | 1.43 | 1.86 | 0.69 | 0.62 ± 0.2 | 0.60 ± 0.02 |
| 7 | Ac-p(NmeNce)18, 10× | 1.43 | 1.38 | 0.51 | 0.57 ± 0.03 | 0.69 ± 0.01 |
| 8 | Ac-p(NmeNce)18, 30× | 1.43 | 1.27 | 0.47 | 0.45 ± 0.03 | 0.69 ± 0.01 |
Conclusions
In conclusion, a model system has been used to study the effect of charge distribution on polyelectrolyte conformations in aqueous solutions. Polypeptoids containing ionizable groups on every monomer or containing ionizable groups on every other monomer were synthesized and their conformations in dilute solutions were analyzed by small angle neutron scattering. It was shown that at low ionic strengths, the polypeptoid with closer charge placements had a higher persistence length due to the increased level of electrostatic repulsion between ionized groups. At higher ionic strengths, both polymers showed a decrease in persistence length that is inversely proportional to NaOH concentration in agreement with previous theoretical and experimental results. These results will aid in the understanding of biopolymer behavior and will also help in designing and understanding polypeptoid mesoscale assemblies.Acknowledgements
We gratefully acknowledge funding from the Office of Naval Research via a Presidential Early Career Award in Science and Engineering. A.M.R. and H.K.M also gratefully acknowledge the National Science Foundation and the Department of Defense for graduate fellowships (respectively). Polypeptoid synthesis and associated chemical characterization were performed at the Molecular Foundry, a Lawrence Berkeley National Laboratory user facility supported by the Office of Science, Office of Basic Energy Sciences, U.S. Department of Energy, under Contract DE-AC02-05CH11231. A portion of the neutron scattering in this work is based on activities at the NIST Center for Neutron Research, which is supported in part by the National Science Foundation under Agreement no. DMR-0454672. Certain trade names and company products are identified to adequately specify the experimental procedure. In no case does such identification imply recommendation or endorsement by the National Institute of Standards and Technology, nor does it imply that the products are necessarily best for the purpose. The authors thank Dr Steven Kline for assistance on SANS data collection. A portion of this research was also performed at Oak Ridge National Laboratory. The authors thank Dr Volker S. Urban at Oak Ridge National Laboratory for assistance on SANS data collection. The SANS studies at Oak Ridge National Laboratory's Center for Structural Molecular Biology were supported by the Office of Biological and Environmental Research, using facilities supported by the DOE, managed by UT-Battelle, LLC, under Contract no. DE-AC05-00OR22725. We also would like to thank Dr J.-M. Carrillo for help with data fitting.References
- T. Odijk, Polyelectrolytes near rod limit, J. Polym. Sci., Polym. Lett. Ed., 1977, 15(3), 477–483 Search PubMed.
- J. Skolnick and M. Fixman, Electrostatic persistence length of a wormlike polyelectrolyte, Macromolecules, 1977, 10(5), 944–948 CrossRef CAS.
- A. V. Dobrynin, R. H. Colby and M. Rubinstein, Scaling theory of polyelectrolyte solutions, Macromolecules, 1995, 28(6), 1859–1871 CrossRef CAS.
- G. S. Manning, Limiting laws and counterion condensation in polyelectrolyte solutions I. Colligative properties, J. Chem. Phys., 1969, 51(3), 924 CrossRef CAS.
- V. M. Prabhu, Counterion structure and dynamics in polyelectrolyte solutions, Curr. Opin. Colloid Interface Sci., 2005, 10(1–2), 2–8 CrossRef CAS.
- M. N. Spiteri, F. Boue, A. Lapp and J. P. Cotton, Persistence length for a PSSNa polyion in semidilute solution as a function of the ionic strength, Phys. Rev. Lett., 1996, 77(26), 5218–5220 CrossRef CAS.
- M. Ullner, B. Jonsson, C. Peterson, O. Sommelius and B. Soderberg, The electrostatic persistence length calculated from Monte Carlo, variational and perturbation methods, J. Chem. Phys., 1997, 107(4), 1279–1287 CrossRef CAS.
- G. Ariel and D. Andelman, Persistence length of a strongly charged rodlike polyelectrolyte in the presence of salt, Phys. Rev. E: Stat., Nonlinear, Soft Matter Phys., 2003, 67(1), 11 Search PubMed.
- P. Y. Hsiao, Chain morphology, swelling exponent, persistence length, like-charge attraction, and charge distribution around a chain in polyelectrolyte solutions: effects of salt concentration and ion size studied by molecular dynamics simulations, Macromolecules, 2006, 39(20), 7125–7137 CrossRef CAS.
- T. T. Nguyen and B. I. Shklovskii, Persistence length of a polyelectrolyte in salty water: Monte Carlo study, Phys. Rev. E: Stat., Nonlinear, Soft Matter Phys., 2002, 66(2), 7.
- E. Sauvage, N. Plucktaveesak, R. H. Colby, D. A. Amos, B. Antalek, K. M. Schroeder and J. S. Tan, Amphiphilic maleic acid-containing alternating copolymers – 2. Dilute solution characterization by light scattering, intrinsic viscosity, and PGSE NMR spectroscopy, J. Polym. Sci., Part B: Polym. Phys., 2004, 42(19), 3584–3597 Search PubMed.
- L. Cannavacciuolo, C. Sommer, J. S. Pedersen and P. Schurtenberger, Size, flexibility, and scattering functions of semiflexible polyelectrolytes with excluded volume effects: Monte Carlo simulations and neutron scattering experiments, Phys. Rev. E: Stat. Phys., Plasmas, Fluids, Relat. Interdiscip. Top., 2000, 62(4), 5409–5419 CrossRef CAS.
- W. Groenewegen, S. U. Egelhaaf, A. Lapp and J. R. C. van der Maarel, Neutron scattering estimates of the effect of charge on the micelle structure in aqueous polyelectrolyte diblock copolymer solutions, Macromolecules, 2000, 33(9), 3283–3293 CrossRef CAS.
- R. Colby, Structure and linear viscoelasticity of flexible polymer solutions: comparison of polyelectrolyte and neutral polymer solutions, Rheol. Acta, 2010, 49(5), 425–442 CrossRef CAS.
- T. S. Rushing and R. D. Hester, Semi-empirical model for polyelectrolyte intrinsic viscosity as a function of solution ionic strength and polymer molecular weight, Polymer, 2004, 45(19), 6587–6594 Search PubMed.
- A. N. Zelikin, O. V. Davydova, N. I. Akritskaya, S. I. Kargov and V. A. Izumrudov, Conformation of polyelectrolyte chains in dilute aqueous solutions investigated by conductometry. 4. Influence of molecular mass and charge density of the chains on conformation of symmetrical aliphatic ionene bromides, J. Phys. Chem. B, 2004, 108(1), 490–495 CrossRef CAS.
- J. M. Song and J. S. Kim, Small-angle X-ray scattering study on poly(ethyl acrylate-co-itaconate) ionomers neutralized with various cations, J. Nanosci. Nanotechnol., 2008, 8(10), 5454–5458 Search PubMed.
- D. L. Wang, D. Moses, G. C. Bazan, A. J. Heeger and J. Lal, Conformation of a conjugated polyelectrolyte in aqueous solution: small angle neutron scattering, J. Macromol. Sci., Part A: Pure Appl.Chem., 2001, 38(12), 1175–1189 Search PubMed.
- D. L. Wang, J. Lal, D. Moses, G. C. Bazan and A. J. Heeger, Small angle neutron scattering (SANS) studies of a conjugated polyelectrolyte in aqueous solution, Chem. Phys. Lett., 2001, 348(5–6), 411–415 CrossRef CAS.
- E. Allahyarov and P. L. Taylor, Simulation study of the equilibrium morphology in ionomers with different architectures, J. Polym. Sci., Part B: Polym. Phys., 2011, 49(5), 368–376 Search PubMed.
- L. M. Hall, M. E. Seitz, K. I. Winey, K. L. Opper, K. B. Wagener, M. J. Stevens and A. L. Frischknecht, Ionic aggregate structure in ionomer melts: effect of molecular architecture on aggregates and the ionomer peak, J. Am. Chem. Soc., 2012, 134(1), 574–587 Search PubMed.
- E. S. Sobel and J. A. Harpst, Effects of Na+ on the persistence length and excluded volume of T7 bacteriophage DNA, Biopolymers, 1991, 31(13), 1559–1564 CrossRef CAS.
- L. X. Wang and V. A. Bloomfield, Small-angle X-ray-scattering of semidilute rodlike DNA solutions – polyelectrolyte behavior, Macromolecules, 1991, 24(21), 5791–5795 CrossRef CAS.
- C. G. Baumann, S. B. Smith, V. A. Bloomfield and C. Bustamante, Ionic effects on the elasticity of single DNA molecules, Proc. Natl. Acad. Sci. U. S. A., 1997, 94(12), 6185–6190 CrossRef CAS.
- S. Tomic, T. Vuletic, S. Dolanski Babic, R. Podgornik, S. Krca, D. Ivankovic and L. Griparic, Screening and fundamental length scales in semidilute Na–DNA aqueous solutions, Phys. Rev. Lett., 2006, 97(9), 4.
- S. Tomic, S. D. Babic, T. Vuletic, S. Krca, D. Ivankovic, L. Griparic and R. Podgornik, Dielectric relaxation of DNA aqueous solutions, Phys. Rev. E: Stat., Nonlinear, Soft Matter Phys., 2007, 75(2), 13 Search PubMed.
- N. Makita, M. Ullner and K. Yoshikawa, Conformational change of giant DNA with added salt as revealed by single molecular observation, Macromolecules, 2006, 39(18), 6200–6206 CrossRef CAS.
- M. S. Chun, C. Kim and D. E. Lee, Conformation and translational diffusion of a xanthan polyelectrolyte chain: Brownian dynamics simulation and single molecule tracking, Phys. Rev. E: Stat., Nonlinear, Soft Matter Phys., 2009, 79(5), 10 Search PubMed.
- T. Vuletic, S. D. Babic, T. Ivek, D. Grgicin, S. Tomic and R. Podgornik, Structure and dynamics of hyaluronic acid semidilute solutions: a dielectric spectroscopy study, Phys. Rev. E: Stat., Nonlinear, Soft Matter Phys., 2010, 82(1), 10 Search PubMed.
- R. Beck, J. Deek, M. C. Choi, T. Ikawa, O. Watanabe, E. Frey, P. Pincus and C. R. Safinya, Unconventional salt trend from soft to stiff in single neurofilament biopolymers, Langmuir, 2010, 26(24), 18595–18599 Search PubMed.
- T. A. Camesano and K. J. Wilkinson, Single molecule study of xanthan conformation using atomic force microscopy, Biomacromolecules, 2001, 2(4), 1184–1191 CrossRef CAS.
- E. Buhler and F. Boue, Chain persistence length and structure in hyaluronan solutions: ionic strength dependence for a model semirigid polyelectrolyte, Macromolecules, 2004, 37(4), 1600–1610 CrossRef CAS.
- A. Gamini and M. Mandel, Physicochemical properties of aqueous xanthan solutions – static light-scattering, Biopolymers, 1994, 34(6), 783–797 Search PubMed.
- F. Bonnet, R. Schweins, F. Boue and E. Buhler, Suppression of aggregation in natural-semiflexible/flexible polyanion mixtures, and direct check of the OSF model using SANS, EPL, 2008, 83(4), 5 Search PubMed.
- G. Damaschun, H. Damaschun, K. Gast, C. Gernat and D. Zirwer, Acid denatured apo-cytochrome-C is a random coil – evidence from small-angle X-ray-scattering and dynamic light-scattering, Biochim. Biophys. Acta, Gen. Subj., 1991, 1078(2), 289–295 Search PubMed.
- S. Shimizu, Y. Muroga, T. Hyono and K. Kurita, Small-angle X-ray scattering study on conformation of poly(sodium L-glutamate) in NaCl and NaF aqueous solutions, J. Appl. Crystallogr., 2007, 40, S553–S557 Search PubMed.
- A. V. Dobrynin and M. Rubinstein, Theory of polyelectrolytes in solutions and at surfaces, Prog. Polym. Sci., 2005, 30(11), 1049–1118 CrossRef CAS.
- M. Fixman, Electrostatic persistence length, J. Phys. Chem. B, 2010, 114(9), 3185–3196 CrossRef CAS.
- Y. F. Wei and P. Y. Hsiao, Role of chain stiffness on the conformation of single polyelectrolytes in salt solutions, J. Chem. Phys., 2007, 127(6), 14 Search PubMed.
- A. Katchalsky, O. Kunzle and W. Kuhn, Behavior of polyvalent polymeric ions in solution, J. Polym. Sci., 1950, 5(3), 283–300 Search PubMed.
- T. Odijk, Possible scaling relations for semidilute polyelectrolyte solutions, Macromolecules, 1979, 12(4), 688–693 CrossRef CAS.
- T. Odijk and A. C. Houwaart, Theory of excluded-volume effect of a polyelectrolyte in a 1-1 electrolyte solution, J. Polym. Sci., Polym. Lett. Ed., 1978, 16(4), 627–639 Search PubMed.
- T. Odijk and M. Mandel, Influence of chain-flexiblity on colligative properties of polyelectrolyte solutions, Physica A, 1978, 93(1–2), 298–306 Search PubMed.
- J. Seo, B.-C. Lee and R. N. Zuckermann, Peptoids – Synthesis, Characterization, and Nanostructures, in Comprehensive Biomaterials, ed. P. Ducheyne, K. E. Healy, D. W. Hutmacher, D. W. Grainger and C. J. Kirkpatrick, Elsevier, 2011, vol. 2, pp. 53–76 Search PubMed.
- D. Zhang, S. H. Lahasky, L. Guo, C.-U. Lee and M. Lavan, Polypeptoid materials: current status and future perspectives, Macromolecules, 2012, 45(15), 5833–5841 Search PubMed.
- H. K. Murnen, A. M. Rosales, J. N. Jaworsk, R. A. Segalman and R. N. Zuckermann, Hierarchical self-assembly of a biomimetic diblock copolypeptoid into homochiral superhelices, J. Am. Chem. Soc., 2010, 132(45), 16112–16119 CrossRef CAS.
- B. Sanii, R. Kudirka, A. Cho, N. Venkateswaran, G. K. Olivier, A. M. Olson, H. Tran, R. M. Harada, L. Tan and R. N. Zuckermann, Shaken, not stirred: collapsing a peptoid monolayer to produce free-floating, stable nanosheets, J. Am. Chem. Soc., 2011, 133(51), 20808–20815 CrossRef CAS.
- R. Kudirka, H. Tran, B. Sanii, K. T. Nam, P. H. Choi, N. Venkateswaran, R. Chen, S. Whitelam and R. N. Zuckermann, Folding of a single-chain, information-rich polypeptoid sequence into a highly ordered nanosheet, Biopolymers, 2011, 96(5), 586–595 CrossRef CAS.
- K. T. Nam, S. A. Shelby, P. H. Choi, A. B. Marciel, R. Chen, L. Tan, T. K. Chu, R. A. Mesch, B. C. Lee, M. D. Connolly, C. Kisielowski and R. N. Zuckermann, Free-floating ultrathin two-dimensional crystals from sequence-specific peptoid polymers, Nat. Mater., 2010, 9(5), 454–460 CrossRef CAS.
- G. M. Figliozzi, R. Goldsmith, S. C. Ng, S. C. Banville and R. N. Zuckermann, Synthesis of N-substituted glycine peptoid libraries, Methods Enzymol., 1996, 267, 437–447 CAS.
- A. M. Rosales, H. K. Murnen, R. N. Zuckermann and R. A. Segalman, Control of crystallization and melting behavior in sequence specific polypeptoids, Macromolecules, 2010, 43(13), 5627–5636 CrossRef CAS.
- S. R. Kline, Reduction and analysis of SANS and USANS data using IGOR Pro, J. Appl. Crystallogr., 2006, 39, 895–900 CrossRef CAS.
- J. S. Pedersen and P. Schurtenberger, Scattering functions of semiflexible polymers with and without excluded volume effects, Macromolecules, 1996, 29(23), 7602–7612 CrossRef CAS.
- N. T. M. Klooster, F. Vandertouw and M. Mandel, Solvent effects in poly-electrolyte solutions. 1. Potentiometric and viscosimetric titration of poly(acrylic acid) in methanol and counterion specificity, Macromolecules, 1984, 17(10), 2070–2078 Search PubMed.
- S. G. Starodoubtsev, A. R. Khokhlov, E. L. Sokolov and B. Chu, Evidence for polyelectrolyte ionomer behavior in the collapse of polycationic gels, Macromolecules, 1995, 28(11), 3930–3936 CrossRef CAS.
- A. R. Khokhlov and E. Y. Kramarenko, Weakly charged polyelectrolytes: collapse induced by extra ionization, Macromolecules, 1996, 29(2), 681–685 CrossRef CAS.
- R. G. Winkler, M. Gold and P. Reineker, Collapse of polyelectrolyte macromolecules by counterion condensation and ion pair formation: a molecular dynamics simulation study, Phys. Rev. Lett., 1998, 80(17), 3731–3734 CrossRef CAS.
- A. M. Rosales, H. K. Murnen, S. R. Kline, R. N. Zuckermann and R. A. Segalman, Determination of the persistence length of helical and non-helical polypeptoids in solution, Soft Matter, 2012, 8(13), 3673–3680 RSC.
- J. Skolnick and M. Fixman, Electrostatic persistence length of a wormlike polyelectrolyte, Macromolecules, 1977, 10(5), 944–948 CrossRef CAS.
- S. Ghosh, L. Xiao, C. E. Reed and W. F. Reed, Apparent persistence lengths and diffusion behavior of high-molecular-weight hyaluronate, Biopolymers, 1990, 30(11–12), 1101–1112 Search PubMed.
- M. Tricot, Comparison of experimental and theoretical persistence length of some polyelectrolytes at various ionic strengths, Macromolecules, 1984, 17(9), 1698–1704 CrossRef CAS.
- J. L. Barrat and J. F. Joanny, Persistence length of polyelectrolyte chains, Europhys. Lett., 1993, 24(5), 333–338 CrossRef CAS.
- A. V. Dobrynin, J. M. Y. Carrillo and M. Rubinstein, Chains are more flexible under tension, Macromolecules, 2010, 43(21), 9181–9190 Search PubMed.
- A. V. Dobrynin and J. M. Y. Carrillo, Swelling of biological and semiflexible polyelectrolytes, J. Phys.: Condens. Matter, 2009, 21(42), 11 Search PubMed.
Footnotes |
| † Electronic supplementary information (ESI) available. See DOI: 10.1039/c2sm26849c |
| ‡ Authors contributed equally. |
| This journal is © The Royal Society of Chemistry 2013 |