Self assembly and pore formation of HIV GP160 revealed at molecular resolution†
Lynn
Donlon
and
Daniel
Frankel
*
Chemical Engineering and Advanced Materials, Newcastle University, Newcastle Upon Tyne, UK. E-mail: d.j.frankel@newcastle.ac.uk
First published on 18th October 2012
Abstract
Protein assembly at interfaces is fundamental to disease pathology and biological function. Here we report on the self assembly of the HIV viral envelope protein HIV GP160 and its interaction with phospholipids. The protein can assemble to form either pores or large aggregates. The process of aggregation can be observed at molecular resolution giving a rare insight into the assembly process. HIV GP160 was reconstituted into lipid bilayers simulating the HIV viral envelope and exhibited similar self assembly behaviour to the naked protein. When HIV GP160 was adsorbed on top of a pure single phase phospholipid bilayer it gradually “sank in” over time. Such a variety of self assembly modes and lipid interactions could be critical to the behaviour of the protein in the viral envelope and subsequent viral infection.
Introduction
HIV infection begins with attachment of the RNA containing virion particle to CD4 receptors on the target cell surface. The virion itself is contained within a phospholipid bilayer, annexed from host cells, and containing the transmembrane glycoprotein GP160.1,2 It is the GP120 head section of this protein, protruding from the virion, that is responsible for anchoring to the cell via CD4 and co receptors.3,4 A model for the fusion of the virion with a cell membrane at the molecular level has been proposed by Frey et al.5 Here they suggest that the binding of GP120 with CD4 and the co receptor cause a conformational change. Activation of GP160 requires cleavage into two fragments, GP41 which is the transmembrane section and GP120 the protruding spike.In its native state both GP160 and GP41 exist as a homotrimer, which appears to be crucial to function.6 GP41 itself consists of three domains, cytoplasmic, transmembrane and an endodomain.7 Shai et al. have examined the interactions of the GP41 segment with lipid bilayers and found that GP41 could disrupt the lipid bilayer.8,9 However in this study the GP41 wasn't reconstituted into lipid bilayers, rather adsorbed on top, a less biologically relevant scenario when considering GP41 as opposed to GP120. In addition Shai et al. were interested in the role of GP41 in fusion of the virion to cells. They used mutagenesis and surface characterization methods to relate domain structure to function.10
An understanding of protein–lipid interactions for this viral protein at the molecular level is crucial for the development of new drugs, as the exact infection mechanism, the specificity of related proteins and the fusion process will be fundamental to the workings of blocking strategies. Current HIV vaccines utilise either protease inhibitors or reverse transcriptase inhibitors, but these are prone to drug resistance. Thus drugs which target the virion–cell interaction are being developed.11,12
Atomic force microscopy is ideally suited to measure the self-assembly properties of proteins and their interactions with lipids.13 Unlike fluorescence microscopy no fluorescent probes are involved, thus perturbations associated with labelling the protein of interest are avoided, which could otherwise affect self-assembly behaviour.14 In addition AFM can provides molecular level lateral resolution and subnanometer vertical resolution, allowing the potential for high resolution imaging of protein assembly in a liquid environment.15–17
In force spectroscopy mode, AFM has the ability to unfold proteins of interest at defined locations, allowing a nanomechanical identification of system components.18–20 By employing dynamic force spectroscopy it is possible to extract thermodynamic and kinetic information at the single molecule level.21,22 It is also possible to use single molecule unfolding to measure surface interactions with functionalized tips.23–25 However it is not always practical to tether the molecule of interest to the cantilever, especially when the self assembly behaviour of the free floating molecule is to be examined. Fortunately nanomechanical information can be obtained by “picking up molecules” with a naked tip, as long as the molecule stays adsorbed to the surface, and care is taken over which unfolding events to analyse.26–28
In this work the self assembly properties of HIV GP160 were followed using a combination of atomic force microscopy and single molecule force spectroscopy. Initially mica was used as a platform followed by a study of protein interactions with supported lipid bilayers. The complete protein, i.e. GP160 was chosen rather than the individual components, as both membrane interaction and protein reconstitution were of interest.
Materials and methods
HIV GP160 adsorption
Aliquots of HIV GP160 (ab73770, Abcam, UK) were diluted in ultrapure water to a working concentration of 20 μg mL−1; aliquots of stock solution were stored at −20 °C. Further dilutions were carried out as necessary in ultrapure water. Protein was adsorbed on to either mica (20 × 20 mm) or supported lipid bilayer surfaces for 30 minutes within the AFM liquid cell. Surfaces were then gently washed 3 times with ultrapure water to remove non-adsorbed protein prior to imaging.Supported lipid bilayer preparation
1,2-Dioleoyl-sn-glycero-3-phosphocholine (DOPC) (Avanti Polar Lipids) was dissolved in chloroform and dried under nitrogen flow. The resulting lipid film was then re-suspended in ultrapure water and vortexed giving a final concentration of 1 mg mL−1. Unilamellar vesicles were formed by ten freeze–thaw cycles followed by ten extrusion cycles using a mini extruder (Avanti Polar Lipids). Extrusion was carried out at 45 °C through a polycarbonate membrane with 100 nm pores. Supported lipid bilayers were prepared via vesicle fusion on to freshly cleaved mica with annealing for 20 minutes at 45 °C.29,30Reconstitution of GP160 into supported lipid bilayer
Incorporation of GP160 into supported lipid bilayers was accomplished via encapsulation of the protein into vesicles.31 A 1 mg mL−1 solution of DOPC vesicles was prepared via aqueous resuspension of a dried lipid film followed by 10 freeze–thaw cycles. GP160 was added to the vesicle solution giving a protein concentration of 1 μg mL−1. Unilamellar vesicles were then prepared via extrusion of the protein–lipid solution and GP160-containg bilayers obtained via vesicle fusion on to mica and subsequent annealing.Topographic AFM imaging
AFM experiments were performed in a liquid cell using an Agilent 5500 AFM/SPM microscope. Images were obtained in contact mode using nitrogen doped silicon tips with a nominal force constant of 0.02–0.77 N m−1. Forces were minimized during scans remaining below 1 nN, with typical scan rates in the range of 0.5–1 kHz at 512 pixel resolution. All measurements were performed in ultrapure water at ambient temperature (∼20 °C). All image processing, including height measurements, was performed using version 5.1.6 of the Scanning Probe Image Processor (SPIP) software (Image Metrology, Lyngby, Denmark).Force spectroscopy
Force spectroscopy experiments were conducted using backside aluminium coated silicon cantilevers (PPP-CONTR, Nanosensors, Switzerland) with a nominal spring constant of 0.02–0.77 N m−1 and typical tip radius of less than 7 nm. Spring constants were calibrated using the equipartition theorem (Thermal K) as described by Hutter and Bechhoefer.32 At least 1000 force–distance curves were obtained per sample with an applied load in the range of 9–10 nN, curve length of 1 μm and constant tip velocity of 1 μm s−1. Force spectra were analyzed (using SPIP) to obtain unfolding forces and highlight lipid/protein breakthrough events. Only curves displaying well defined sawtooth patterns that could be fitted to the wormlike chain model were attributed to single molecule pulling events. Determination of rupture forces from force–distance spectra was carried out according to previously reported procedures.33In order to rule out instances of tip contamination force spectra were taken on freshly cleaved mica both prior and subsequent to protein unfolding experiments. No evidence of tip contamination was observed confirming that the protein remains on the imaging surface. Drift was minimised by allowing the tip to equilibrate in the liquid cell prior to measurements.
Results and discussion
Prior to examination of HIV GP160 behaviour upon reconstitution into lipid bilayers, pure HIV GP160 was adsorbed onto freshly cleaved mica. The mica surface is atomically flat over large terrace areas and gives an ideal base to image single molecules. 50 μL of the protein solution was adsorbed on to a freshly cleaved mica surface for 30 minutes within the AFM liquid cell. Excess (non-adsorbed) protein was removed by gentle washing of the surface with ultrapure water. In areas of low concentration on the surface, single molecules of GP160 are identifiable, Fig. 1a and b. Even at low concentrations there are some instances of aggregation, with such units having a 3 fold symmetry (Fig. 1b), suggesting the formation of molecular trimers. This is consistent with crystallographic data that reveal the protein exists in a trimer form.6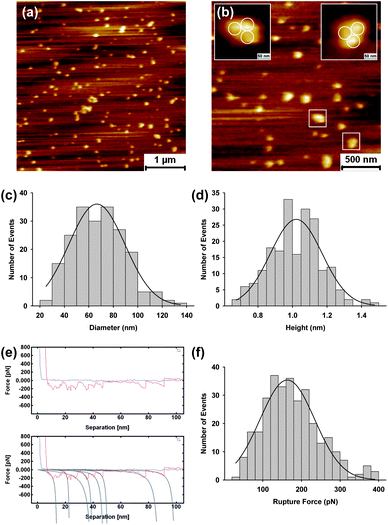 | ||
| Fig. 1 Atomic force microscopy images of HIV GP160 adsorbed onto a mica surface at a concentration of 20 μg mL−1 (a) and (b). In areas exhibiting low localised concentration both single molecules and small aggregates are observed. Aggregates show a triangular shape which we attribute to formation of molecular trimers (b). Distribution of the diameter (c) and height (d) of features observed. Average diameter and height were found to be 66.6 ± 1.5 nm (mean = 66.6; SD = 21.4, n = 201) and 1.02 ± 0.02 nm (mean = 1.02; SD = 0.15; data = 200), respectively. Representative force spectra that exhibit a sawtooth pattern upon retraction, indicating unfolding of the GP160 molecule. Fitting is to the wormlike chain model (e). Rupture force distribution of GP160 on mica at a pulling speed of 1 μm s−1. Only force curves that could be fitted with a wormlike chain model were accepted and values from all selected curves were fitted to a Gaussian function in order to extract the average rupture force, 163.5 ± 4.1 pN (mean = 163.5; SD = 72.7; data = 314). | ||
Histograms of molecular dimensions confirm heights of approximately 1 nm and average dimensions of 10's of nanometers, Fig. 1c and d. A representative line profile illustrating the height of individual molecular features is given in the ESI.† In order to confirm the proteinacious nature of the molecular features, forced unfolding was carried out via force spectroscopy. Unfolding of single GP160 molecules reveals characteristic, well defined sawtooth patterns in the retraction curve, Fig. 1e. These sawtooths are indicative of protein unfolding with individual segments corresponding to the unfolding of single protein domains. Peaks in the sawtooth pattern were fitted to the wormlike chain model allowing unfolding forces to be extracted. For each curve, the rupture force was determined at the point of maximum extension of the cantilever (i.e. the force obtained at the data point just prior to return of the cantilever to its rest position), as reported previously.33 The final peak in the sawtooth pattern, which corresponds to detachment of the protein from the tip rather than the protein from the surface, was discounted as it relates to the interaction between silicon nitride and GP160 rather than the underlying mechanical properties of the protein. Conformation that GP160 remains on the surface upon completion of force spectroscopy is presented in the ESI† and is consistent with similar unfolding experiments for proteins such as fibronectin. A histogram of rupture forces, Fig. 1f indicates an average value of 163.5 ± 4.1 pN which is within the range of unfolding forces measured for a variety of proteins on surfaces.
Further analysis of force spectra fitted to the wormlike chain model allows contour lengths for the unfolding of domains within the protein to be examined. A histogram of contour lengths for unfolding of individual GP160 molecules is included in the ESI,† where the majority of lengths are found to be <20 nm. However it is difficult to assign individual contour lengths to unfolding of specific GP160 domains, which would require force spectroscopy of mutant variants of the protein.
At higher localised concentrations GP160 self assembles into one of two structures. The first of these is shown in Fig. 2a. A large scale image shows assembled zig-zag like features embedded within pores. A similar underlying structure is present throughout the whole sample. Images obtained at successively higher magnification confirm the pore structure (Fig. 2b and c) with the highest resolution scan, Fig. 2d, illustrating a single pore. Each pore is made up of 6 features with dimensions consistent with single molecules. Sizes of the pores are uniform indicative of similar constituent components and structures, Fig. 2e and f. A representative line scan showing the depth of individual pores is included in the ESI.† Surrounding the pores there are large areas of molecules forming linear features, assembled out of several single proteins. Under the same adsorption conditions an unusual structure can self assemble, Fig. 3a. Higher resolution images, Fig. 3b–e, show that large terraces of uniform height cover the surface, inter-dispersed by the structures previously seen. The height of these raised terraces is approximately 3.5 nm, Fig. 3f, at least double the height expected for single molecule features. A representative line profile showing terrace height is given the ESI.† In between terraces are the self assembled zig-zag structures observed previously, Fig. 3e. These raised terraces exhibit the classic spinodal decomposition morphology a phenomenon which has been observed for the protein lysozyme.34–36
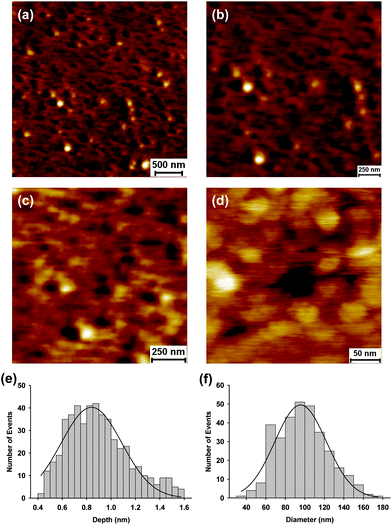 | ||
| Fig. 2 Atomic force microscopy images of HIV GP160 adsorbed onto a mica surface at a concentration 20 μg mL−1 (a–d). GP160 self assembles to form pore-like structures within the adsorbed protein film. Zoom ins to successively higher magnification illustrate that pores assemble from six individual protein molecules (d). Distribution of the depth (e) and diameter (f) of individual pores. Average depth and diameter were found to be 0.84 ± 0.01 nm (mean = 0.84; SD = 0.25; n = 500) and 95.7 ± 1.8 nm (mean = 95.7; SD = 25.8; data = 325), respectively. | ||
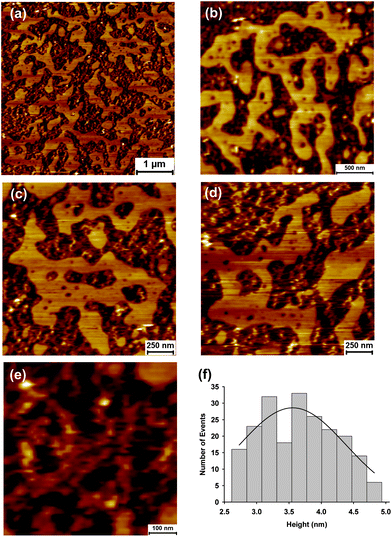 | ||
| Fig. 3 Atomic force microscopy images showing self assembly of HIV GP160 adsorbed onto a mica surface at a concentration 20 μg mL−1 (a–e). Zoom ins to successively higher magnifications illustrate flat terraced areas of uniform height punctuated by small holes (b–d). Terraces are surrounded by zig-zag structures interspaced with pores (e). The average height of the terraced areas was found to be 3.56 ± 0.1 nm (mean = 3.56; SD = 0.58; data = 210). | ||
To further investigate the nature of the large terraces, force spectra were taken both on the terraces and in surrounding areas, Fig. 4. Sawtooth patterns indicative of protein unfolding were observed in both areas. Rupture forces of ∼80 pN were measured in both areas, suggesting the protein is equally accessible for unfolding. However, these forces are much lower than those measured for unfolding of isolated proteins on mica, which were above 160 pN (Fig. 1). The lower unfolding forces suggest that GP160 is considerably easier to unfold when aggregated than isolated. This may seem counterintuitive in that intermolecular interactions could be hypothesised to stabilize components of larger structures however the ease of unfolding could reflect the protein being in an alternate conformation when assembled.
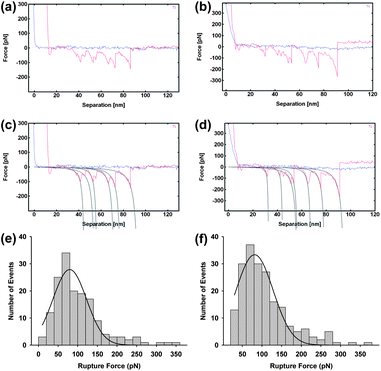 | ||
| Fig. 4 Representative force spectra taken on raised terraces (a) and lower features (b) with fitting to the wormlike chain model (c) and (d). Rupture force distribution of self assembled GP160 unfolding on terraced and lower regions ((e) and (f), respectively) at a pulling speed of 1 μm s−1. Only force curves that could be fitted with a wormlike chain model were accepted and values from all selected curves were fitted to a Gaussian function in order to extract the average rupture force. Rupture forces were measured as 79.6 ± 3.9 pN (mean 79.6; SD = 61.7; data = 158) and 81.3 ± 3.8 pN (mean = 81.3; SD = 61.8; data 198) for the terraces and lower regions, respectively. | ||
In order to explore the interaction of GP160 with lipids, preformed supported DOPC bilayers were treated with an aqueous solution of GP160. The untreated lipid bilayer is comparatively flat, Fig. 5a, showing no obvious features. Force spectra taken on the bilayer show a single adhesion event and lipid breakthrough of ∼4.9 nm consistent with thickness of a lipid bilayer,37Fig. 6a and b.
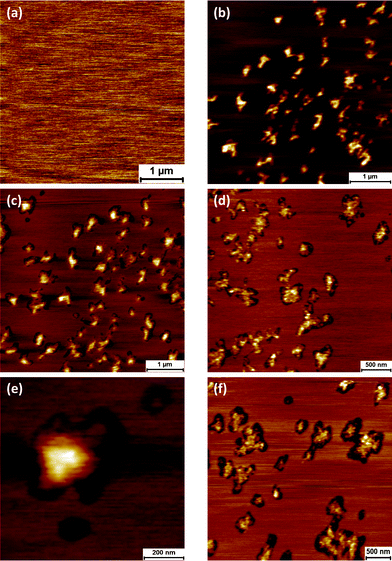 | ||
| Fig. 5 Atomic force microscopy image of DOPC bilayer prior to protein adsorption (a). Adsorption of GP160 for 30 minutes followed by subsequent imaging illustrates raised protein features (b) which sink into the bilayer over time forming pore-like structures. Images taken 45 min (c), 1 h 15 min (d) and 18 hours (overnight) (f) after initial image. Zoom in of molecular trimer sinking into DOPC bilayer (e). | ||
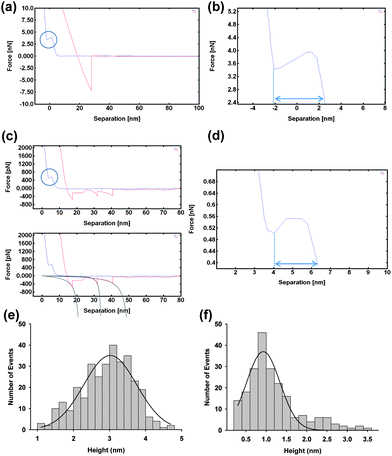 | ||
| Fig. 6 Force–distance curve taken on DOPC bilayer prior to GP160 adsorption (a) illustrating single adhesion event and lipid breakthrough of ∼4.9 nm (b). Force–distance curve taken on protein adsorbed on to bilayer (c) illustrating a protein breakthrough event of ∼2.3 nm as well as a sawtooth pattern, indicative of protein unfolding. Fit is to the wormlike chain model. Height distribution of GP160 features taken immediately after protein adsorption (e) and after 18 hours (overnight) (f). Average heights were measured initially as 3.02 ± 0.05 nm (mean = 3.02; SD = 0.71; data = 321) and as 0.93 ± 0.04 nm (mean = 0.93; SD = 0.65; data = 212) after 18 hours confirming sinking of the protein into the bilayer. | ||
Adsorption of a 1 μg mL−1 solution of GP160 for 30 minutes followed by surface washing and subsequent imaging highlights protein features upon the bilayer (Fig. 5b–f). The protein exists mostly as aggregates of relatively uniform size, showing a higher degree of self assembly than the pores or molecular trimers observed on mica. However in some instances, molecular trimers can be observed, such as that illustrated in Fig. 5e. Force spectroscopy reveals isolated curves which display a sawtooth pattern, Fig. 6c. Interestingly the curve displayed in Fig. 6c also shows a protein breakthrough event of ∼2.3 nm, which is illustrated more clearly in Fig. 6d. We have previously reported spectra in which unfolding as well as protein breakthrough events are observed.18
Images and subsequent height measurements at time intervals after protein adsorption reveal that the protein ‘sinks’ into the underlying bilayer, forming holes surrounding the individual protein structures. The height of protein features relative to the underlying bilayer is 3.02 ± 0.05 nm immediately after protein adsorption, falling to 0.93 ± 0.04 nm when the system is left overnight (18 hours). Representative line profiles illustrating the height of features in both instances are given in the ESI.† The height difference observed is most likely due to the GP41 section of the protein fulfilling its' role as a fusion protein, and embedding in the lipid surface.38
To mimic the GP160 incorporation in a viral envelope, the final set of experiments reconstituted GP160 into phospholipid bilayers. Reconstitution was achieved via addition of GP160 to an aqueous solution of DOPC vesicles followed by extrusion. DOPC vesicles with encapsulated GP160 were then adsorbed on to a mica surface and annealed (45 °C for 20 minutes). Cooling to ambient temperature resulted in vesicle fusion to form a bilayer. Imaging of these bilayers revealed one of two self assembled structures. The first of these shares many of the characteristics of large scale self assembly on mica, Fig. 7. Large, flat terraced areas are punctuated by sunken holes, ranging from a few hundred nanometres to several microns in size. Representative height profiles are given in the ESI.† Within these ‘holes’, which are 1.88 ± 0.02 nm deep, smaller islands are observed, illustrating intermediate stages of the self assembly process. Zoom ins to higher magnification, Fig. 7e, highlight pores within the sunken hole regions, which are consistent with the self assembled pore structures observed on mica (Fig. 2).
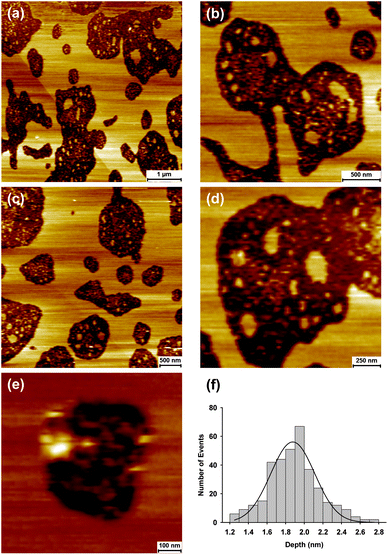 | ||
| Fig. 7 Atomic force microscopy images illustrating GP160 reconstituted into DOPC bilayers. Self assembly of the protein into large flat terraces is consistent with structures observed on mica (Fig. 3). Terraces are interspaced with holes with zoom ins showing intermediate stages of self assembly. The average depth of the holes is 1.88 ± 0.02 nm (mean = 1.88, SD = 0.27; data = 350). | ||
In order to confirm, the location of GP160 within the structured bilayer force spectra were preformed on the raised terraces and in the sunken hole regions. Representative spectra taken on the terraces and in the holes are given in Fig. 8a and b, respectively. Approximately three times as many curves showing protein unfolding were obtained upon the terraces than in the holes, suggesting the protein preferentially forms such self assembled structures. However, the rupture force measured on the terraces (282.5 ± 9.7 pN) is higher than that in the holes (222.4 ± 9.3 pN) suggesting a more stable structure.
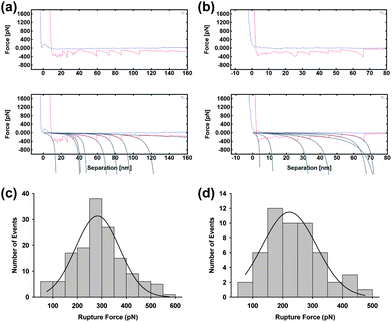 | ||
| Fig. 8 Force spectra taken on flat terraced areas (a) and within holes (b) for GP120 reconstituted into a DOPC bilayer, with fitting to the wormlike chain model. All curves which could be fitted to the wormlike chain model were analysed and fitted to a Gaussian function from which the average rupture force was obtained. Rupture forces were determined to be 282.5 ± 9.7 pN (mean = 282.5; SD = 105.6; data = 149) and 222.4 ± 9.3 pN (mean = 222.4; SD = 88.0; data = 52) on the raised terraces and in the holes, respectively. | ||
It is believed that the terraces consist entirely of protein which is partially embedded into the bilayer. Incorporation of part of the protein structure into the bilayer would account for the difference in terrace height between bilayer and mica substrates; The terraces on mica are approximately double the height of those observed within the DOPC bilayer.
GP160 can also self assemble into an alternative structure when reconstituted into DOPC bilayers, Fig. 9a and b. Such structures were observed when the annealing step used to prepare the supported bilayers was cut from 20 to 5 minutes and the bilayers imaged immediately. The self assembled structures are 0.46 ± 0.01 nm in height (relative to the surrounding DOPC bilayer) however bright features are also observed on top of the main protein structures which are 1.2 ± 0.05 nm in height (also relative to the bilayer). The raised bright features are likely individual GP160 molecules sitting atop the bulk, self assembled protein structures.
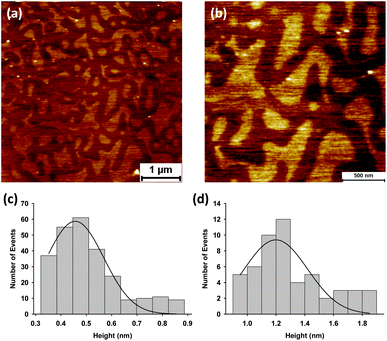 | ||
| Fig. 9 Atomic force microscopy images showing self assembly of GP160 reconstituted into a DOPC bilayer (a and b). The self assembled protein structures are 0.46 ± 0.01 nm (mean = 0.46; SD = 0.13; data = 257) in height, (c). Individual raised features (white dots) upon protein structure are 1.20 ± 0.05 nm (mean = 1.20; SD = 0.25; data = 53) in height relative to the underlying DOPC bilayer. | ||
A schematic summary of the various assembly modes of GP160 is presented in Fig. 10. On mica individual molecules and molecular trimers, 1 nm in height are visible at low concentration (Fig. 10a). At higher concentrations approximately monolayer protein coverage may be observed, punctuated either by 1 nm deep ‘pores’ (b) or multilayer protein assemblies, several nm in height (c). GP160 reconstituted into a DOPC bilayer can either show self assembly characteristic of spinodal decomposition, in which the majority of the protein structure is embedded within the bilayer (e) or more complex multilayer protein assemblies which are partially embedded within the bilayer, punctuated by holes in which monolayer protein coverage and intermediate stages of self assembly can be observed (d).
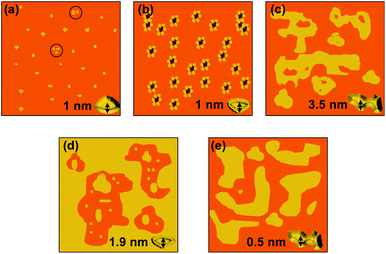 | ||
| Fig. 10 Schematic showing the self assembly modes of GP160 on mica and within DOPC bilayers. On mica at low concentration individual molecules of GP160 and molecular trimers, ∼1 nm in height are observed (a). Higher concentrations of GP160 self assemble into two alternate structures. Monolayer protein coverage may be punctuated by 1 nm ‘pores’ (b) or multilayer protein assemblies (c) which are observed as uniform terraces ∼3.5 nm in height. When reconstituted into DOPC bilayers either embedded self assembled structures, characteristic of spinodal decomposition and ∼0.5 nm in height (e) or partially embedded multilayer protein assemblies, punctuated by ∼1.9 nm deep holes in which monolayer protein coverage and the intermediate stages of self assembly can be observed. | ||
Conclusions
Initial experiments showed that at low concentration individual molecules of GP160 and molecular trimers may be observed. Force spectroscopic analysis reveals a sawtooth pattern, characteristic of protein unfolding. At higher concentration one of two self assembled structures is observed. The first of these contains ‘pores’ surrounded by a zig-zag structure whilst the alternative shows a morphology characteristic of spinodal decomposition with raised terraces of uniform height surrounded by zig-zag structures. Both morphologies were observed under identical adsorption conditions showing the versatility of GP160 self assembly on mica. When adsorbed on top of a DOPC bilayer the protein was shown to ‘sink’ into the lipid substrate over time whilst GP160 incorporated DOPC bilayers undergoes self assembly. One of two self assembled structures are observed, the first showing large terraces interspaced with holes similar to that observed on mica. Protein within the holes shows intermediate stages of self assembly and zig-zag structures. The second structure clearly demonstrates spinodal decomposition morphology formed from GP160 partially embedded into the bilayer. The wide variety of self assembly modes may play a key role in the behaviour of GP160 within the viral envelope and in the infection process, with a greater understanding of protein–lipid interactions providing crucial information for the development of new treatment strategies.Acknowledgements
This work was supported by EPSRC grant EP H019081/1.Notes and references
- D. G. Myszka, R. W. Sweet, P. Hensley, M. BrighamBurke, P. Kwong, W. Hendrickson, R. Wyatt, J. Sodroski and M. L. Doyle, Proc. Natl. Acad. Sci. U. S. A., 2000, 97, 9026–9031 CrossRef CAS
.
- N. Sullivan, Y. Sun, Q. Sattentau, M. Thali, D. Wu, G. Denisova, J. Gershoni, J. Robinson, J. Moore and J. Sodroski, J. Virol., 1998, 72, 4694–4703 Search PubMed
.
- R. Wyatt and J. Sodroski, Science, 1998, 280, 1884–1888 CrossRef CAS
.
- P. D. Kwong, R. Wyatt, J. Robinson, R. W. Sweet, J. Sodroski and W. A. Hendrickson, Nature, 1998, 393, 648–659 CrossRef CAS
.
- G. Frey, S. Rits-Volloch, X. Q. Zhang, R. T. Schooley, B. Chen and S. C. Harrison, Proc. Natl. Acad. Sci. U. S. A., 2006, 103, 13938–13943 Search PubMed
.
- J. M. Kovacs, J. P. Nkolola, H. Peng, A. Cheung, J. Perry, C. A. Miller, M. S. Seaman, D. H. Barouch and B. Chen, Proc. Natl. Acad. Sci. U. S. A., 2012, 109, 12111–12116 Search PubMed
.
- V. Buzon and J. Cladera, Biochemistry, 2006, 45, 15768–15775 Search PubMed
.
- A. Bitler, N. Lev, Y. Fridmann-Sirkis, L. Blank, S. R. Cohen and Y. Shai, Ultramicroscopy, 2010, 110, 694–700 CrossRef CAS
.
- N. Lev, Y. Fridmann-Sirkis, L. Blank, A. Bitler, R. F. Epand and Y. Shai, Biochemistry, 2009, 48, 3166–3175 CrossRef CAS
.
- O. Korazim, K. Sackett and Y. Shai, J. Mol. Biol., 2006, 364, 1103–1117 Search PubMed
.
- D. M. Eckert and P. S. Kim, Annu. Rev. Biochem., 2001, 70, 777–810 CrossRef CAS
.
- B. D. Welch, A. P. Van Demark, A. Herouz, C. P. Hill and M. S. Kay, Proc. Natl. Acad. Sci. U. S. A., 2007, 104, 16828–16833 CrossRef CAS
.
- D. Muller, Biophys. J., 2006, 91, 3133–3134 Search PubMed
.
- A. R. Burns, D. J. Frankel and T. Buranda, Biophys. J., 2005, 89, 1081–1093 CrossRef CAS
.
- P. E. Milhiet, F. Gubellini, A. Berquand, P. Dosset, J.-L. Rigaud, C. Le Grimellec and D. Lévy, Biophys. J., 2006, 91, 3268–3275 CrossRef CAS
.
- P. Y. Meadows, J. E. Bemis and G. C. Walker, Langmuir, 2003, 19, 9566–9571 CrossRef CAS
.
- A. Dolatshahi-Pirouz, T. Jensen, M. Foss, J. Chevallier and F. Besenbacher, Langmuir, 2009, 25, 2971–2978 CrossRef CAS
.
- D. Nordin, O. Yarkoni, N. Savinykh, L. Donlon and D. Frankel, Soft Matter, 2011, 7, 10666–10675 RSC
.
- D. Nordin, L. Donlon and D. Frankel, Soft Matter, 2012, 8, 6151–6160 RSC
.
- M. Rief, M. Gautel, F. Oesterhelt, J. M. Fernandez and H. E. Gaub, Science, 1997, 276, 1109–1112 CrossRef CAS
.
- E. Evans, Faraday Discuss., 1998, 111, 1–16 Search PubMed
.
- G. I. Bell, Science, 1978, 200, 618–627 CrossRef CAS
.
- J. R. Hull, G. S. Tamura and D. G. Castner, Biophys. J., 2007, 93, 2852–2860 CrossRef CAS
.
- E. Velzenberger, I. Pezron, G. Legeay, M.-D. Nagel and K. El Kirat, Langmuir, 2008, 24, 11734–11742 CrossRef CAS
.
- C. M. Stroh, A. Ebner, M. Geretschlager, G. Freudenthaler, F. Kienberger, A. S. M. Kamruzzahan, S. J. Smith-Gill, H. J. Gruber and P. Hinterdorfer, Biophys. J., 2004, 87, 1981–1990 CrossRef CAS
.
- L. Donlon, D. Nordin and D. Frankel, Soft Matter, 2012, 8(38), 9933–9940 RSC
.
- P. E. Marszalek, A. F. Oberhauser, H. Li and J. M. Fernandez, Biophys. J., 2003, 85, 2696–2704 Search PubMed
.
- P. E. Marszalek and Y. F. Dufrene, Chem. Soc. Rev., 2012, 41, 3523–3534 RSC
.
- H. Schonherr, J. M. Johnson, P. Lenz, C. W. Frank and S. G. Boxer, Langmuir, 2004, 20, 11600–11606 CrossRef
.
- R. Wang, J. Shi, A. N. Parikh, A. P. Shreve, L. Chen and B. I. Swanson, Colloids Surf., B, 2004, 33, 45–51 CrossRef CAS
.
- A. Slade, J. Luh, S. Ho and C. M. Yip, J. Struct. Biol., 2002, 137, 283–291 CrossRef CAS
.
- J. L. Hutter and J. Bechhoefer, Rev. Sci. Instrum., 1993, 64, 1868–1873 CrossRef CAS
.
- P. Y. Meadows and G. C. Walker, Langmuir, 2005, 21, 4096–4107 CrossRef CAS
.
- F. Cardinaux, T. Gibaud, A. Stradner and P. Schurtenberger, Phys. Rev. Lett., 2007, 99, 1183011–1183014 Search PubMed
.
- T. Gibaud and P. Schurtenberger, J. Phys.: Condens. Matter, 2009, 21, 322201–322208 CrossRef
.
- F. Cardinaux, T. Gibaud, A. Stradner and P. Schurtenberger, Phys. Rev. Lett., 2007, 99, 1183011–1183014 Search PubMed
.
- S. Garcia-Maynes and F. Sanz, Biochim. Biophys. Acta, 2010, 1798, 741–749 Search PubMed
.
- D. L. Floyd, J. R. Ragains, J. J. Skehel, S. C. Harrison and A. M. van Oijen, Proc. Natl. Acad. Sci. U. S. A., 2008, 105, 15382–15387 CrossRef CAS
.
Footnote |
| † Electronic supplementary information (ESI) available. See DOI: 10.1039/c2sm26980e |
| This journal is © The Royal Society of Chemistry 2013 |
