“Turn-on-off-on” fluorescence switching of quantum dots–cationic porphyrin nanohybrid: a sensor for DNA†
Ellappan
Vaishnavi
and
Rajalingam
Renganathan
*
School of Chemistry, Bharathidasan University, Tiruchirappalli-620 024, Tamil Nadu, India. E-mail: rrengas@gmail.com; Fax: ++91-431-2407045; Tel: ++91-431-2407053
First published on 8th October 2013
Abstract
In this article, we describe a new platform for probing double stranded DNA (dsDNA) by tracing the “on-off-on” fluorescence signals of quantum dots–cationic porphyrin utilizing fluorescence and synchronous fluorescence measurements. Electrostatic interaction between the negatively charged thioglycolic acid capped CdTe quantum dots (CdTe-TGA QDs) and positively charged porphyrin surfaces leads to drastic quenching (turning off) of the donor by an effective electron transfer process. Interestingly, after the addition of calf thymus DNA (CtDNA), the porphyrins peel off from the quantum dot surface and bind to dsDNA, resulting in the restoration of fluorescence intensity of quantum dots (turning on). Consequently, this can be utilized for the selective sensing of dsDNA via optical responses. Experimental results show that the increase in fluorescence intensity is proportional to the concentration of CtDNA within the range of 6.5 × 10⁻⁹ M to 29.6 × 10⁻⁸ M under the optimized experimental conditions. Furthermore, the peel off mechanism was confirmed by atomic force measurement.
1. Introduction
The design of fluorescent probes for the qualitative and quantitative analysis of DNA has been studied extensively.1 According to cell biology, DNA, being a genetic carrier, plays a significant role in life processes such as gene expression, gene transcription, mutagenesis etc., and serves as a primary target molecule for anticancer, antiviral therapies.2,3 Considering the key role of DNA, currently intensive interest has flourished in applying azine, imidazole and cyanine dyes as fluorescence probes for sensing biomolecules.4–6 However, these traditional organic fluorophores afford many difficulties in terms of long term photostability and solubility. In general, for biological applications, it is imperative to use water soluble materials with superior properties. Therefore, in comparison with organic fluorophores, highly luminescent semiconductor quamtum dots (QDs), an essential class of emerging nanomaterials with excellent photostability and unique optical properties are expected to find application as powerful fluorescent probes for novel biosensors.7–9 Recently, the development of nanoparticles based biosensors has been a hot area of research. Extraordinary sensitivity and selectivity offered by fluorescence and synchronous fluorescence detection methods has led to their major implementation in bio-analytical applications. More specifically, the development of novel fluorescent semiconductor probes has stimulated a variety of technological applications in sensing important biomolecules like antioxidants, enzymes, vitamins etc.,10–13 On the other hand, there has been substantial progress in the design and study of FRET-based biosensors for the detection and diagnosis of different kinds of analytes and diseases, such as studding DNA hybridization14,15 and cleavage, nutrients,10,16 nucleic acid detection,17 protein structure, functioning and interactions,18,19etc. In contrast, only few reports explain the significance of the electron transfer mechanism. Raymo et al. developed a photoinduced electron transfer (PET) based sensor to signal receptor–substrate interactions.20 The reaction of CdTe QDs with an anticancer drug and some dyes in the presence of DNA have been reported.21,22 Many results reveal the light induced interaction of QDs–porphyrin, QDs–phthalocyanine nanocomposite for their potential applications in photo dynamic therapy.23,24 Quite recently, the assembly and design of QDs–porphyrin–cucurbit[7]uril was discussed based on the FRET mechanism.25 Despite this success, there is still a pressing need for developing these combined materials in molecular recognizing process. Thus, inspired by literature reports, we designed a sensor for double stranded DNA using cationic porphyrin and QDs. Moreover, to the best of our knowledge, no endeavor has been made to employ the QDs–porphyrin as PET-based nanobiosensors for monitoring dsDNA.In the present work, we have undertaken this mission to reveal the applicability of QDs–cationic porphyrin nanohybrid for a DNA sensor utilizing spectroscopic and microscopic techniques. As a light absorbing material, CdTe-TGA QDs provide a “turn on” state in fluorescence measurement and this bright fluorescence is quenched in the presence of cationic porphyrins (“turn off” state). After the addition of CtDNA to the CdTe-TGA-cationic porphyrin system, cationic porphyrin becomes detached from the QDs surface and becomes attached to the negatively charged CtDNA creating a “turn on” state. The specificity of choosing positively charged porphyrins was confirmed by varying the surface charges of both the QDs and porphyrins. These “turn-on-off-on” studies will open new opportunities for engineering optically based advance switches for sensing biomolecules.
2. Experimental section
2.1. Materials and methods
Porphyrins namely mesotetrakis(4-sulfonatophenyl)porphyrin[TSPP], meso-tetrakis(4-carboxyphenyl)porphyrin[TCPP], mesotetrakis(4-N-methylpyridyl)porphyrin [TMPyP], zinc-mesotetrakis(4-N-methylpyridyl)porphyrin [ZnTMPyP], magnesium mesotetrakis(4-N-methylpyridyl)porphyrin [MnTMPyP] and meso-tetraphenylporphyrin [TPP] were purchased from Sigma-Aldrich. Biomolecules such as lysozyme (Lyso), calf thymus DNA, herring sperm DNA (hsDNA), ssDNA E6, E7 reverse primer (CTTC CCCA TTG GTA CCTG CAG) and bovine serum albumin (BSA) were purchased and used without further purification. Doubly distilled water was used to prepare the solutions. All the measurements were performed at room temperature (25 °C). DNA concentration was determined by UV spectrophotometry using the molar absorption coefficient 6600 l mol−1 cm−1 at 260 nm and the stock solutions were stored at 4 °C.
2.2. Methods
3. Preparation of negatively and positively charged CdTe QDs
QDs were synthesized and characterized according to the ref. 26. Briefly, in a three-necked flask attached to a condenser, the Cd precursor solutions were prepared by mixing a solution of CdCl2 (0.2279 g, 0.0125 M) in the presence of TGA (0.2763 g, 0.03 M) as a stabilizing agent and then the solution pH was adjusted to 8.5–9 by using 1 M NaOH. The resulting solution was de-aerated with N2 for 30 minutes. Under vigorous stirring, the prepared oxygen-free NaHTe solution was injected. In our experiments the typical molar ratio of Cd2+: NaHTe: TGA was 1: 0.2: 2.4. The resulting yellow colloidal CdTe was refluxed under nitrogen flow at 100 °C at different times to obtain CdTe QDs of different sizes. Aliquots of the reaction solution were pipetted out at different time intervals (4, 6 and 8 h) for optical measurements. The resulting products were precipitated by acetone and superfluous TGA, and Cd2+ that did not participate in the reaction were removed by centrifugation at 4000 rpm for 5 min. The resultant precipitate was re-dispersed in water, and was re-precipitated again by acetone more than twice, then kept at 4 °C in the dark (stable for more than three months) for further use. At pH 5–6, instead of TGA, DEA was utilized for synthesizing positively charged QDs. All the other experimental procedures were carried out under the same conditions as described above.4. Results and discussion
4.1. Characterization of QDs
Semiconductor QDs exhibiting broad absorption spectra ranging from visible light to infrared are depicted in Fig. S1(A)† and the sizes of the synthesized QDs were also calculated according to an empirical size fitting formula (1),27| D = (9.8127 × 10⁻⁷)λ3 − (1.7147 × 10⁻³)λ2 + (1.0064)λ − 194.84 | (1) |
Additionally, FTIR measurements clearly reveal the successful chemical attachment of ligands at the surface of the QDs. The similarity in the peak positions of DEA capped CdTe QDs and TGA capped CdTe QDs with the corresponding pure organic ligands DEA and TGA illustrates the presence of the parent ligands in the QDs (shown in Fig. S2†). The absence of the –SH peak in the 2500–2600 cm−1 region for the QDs, indicates the cleavage of the thiol moiety and the formation of a new S–Cd bond with the Cd–thiolate complex on the surface.30 For CdTe-DEA, sharp absorption peaks occurred at 3500–3000 cm−1 and at 1630–1560 cm−1 due to the stretching and bending vibration of the –NH bond, consequently this amide creates a positive charge around the surface. In the case of CdTe-TGA, the presence of a broad peak at 3445 cm−1 indicates the stretching vibration of –OH (COOH). These carboxylic ligands donate electrons to the surface of the QDs and make CdTe-TGA negatively charged. The high resolution (HR) TEM images presented in Fig. 1a, illustrate that the QDs are spherically shaped with an average size of 3.9 nm and good monodispersity. Fig. 1b, highlights their lattice fringe and the interplanar spacing was measured to be 389 pm, which corresponds to the characteristic (220) plane in cubic zinc blend CdTe, these values correspond well to our XRD data and earlier reports.31
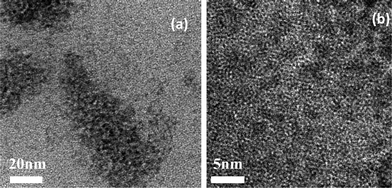 | ||
| Fig. 1 (a) TEM image (at 20 nm scale bars) of CdTe-TGA prepared by hydrothermal synthesis. (b) HRTEM image (5 nm scale bars) lattice fringes of QDs. | ||
4.2. Optimization of experimental conditions
4.3. Quenching of fluorescence of QDs by cationic porphyrin
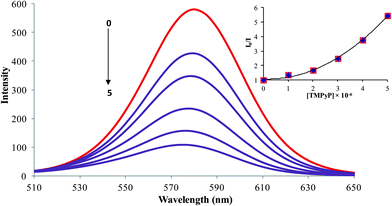
The fluorescence method is crucial for DNA sensing owing to its sensitivity. In fluorescence measurement, a narrow emission peak at 585 nm was observed for the QDs (Fig. 2) Typically, it is evident from previous reports that the efficiency of the electron–hole recombination of QDs is effectively reduced by the adsorption of electron acceptor molecules on the surface of the QDs.33 Similarly in our case, varying the concentrations of porphyrin (0–5 × 10⁻⁶ M) led to surface adsorptions, resulting in a regular decrease of the fluorescence intensity of the QDs. The inset of Fig. 2 shows the Stern–Volmer plots for the quenching of QDs by the cationic porphyrin and the upward curvature of the Stern–Volmer plot suggests that the mechanism behind the quenching is either static or dynamic. Moreover, we carried out the time resolved measurements to confirm the quenching behavior (Fig. S4†), the luminescence decay curve of the QDs altered in the presence of the cationic porphyrin.23,34 Besides, the studies of the quenching process emphasizes the dynamic quenching by the cationic porphyrin.35The interaction of the porphyrins derivatives with QDs was studied by spectrofluorimetry at room temperature. To further clarify the binding affinity of cationic porphyrin, the binding constant K was calculated by following the Lineweaver–Burk double-reciprocal depicted in eqn (2),36
 | (2) |
4.4. Fluorescence restoration of CdTe-TGA-cationic porphyrin by dsDNA
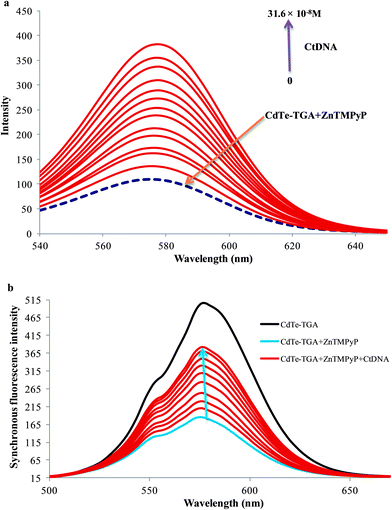
In the presence of CtDNA, the fluorescence intensity of CdTe-TGA-cationic porphyrin probe gradually enhanced as shown in Fig. 3a. No shift in emission peak was observed even at relatively high concentrations of CtDNA. This interesting enhancement behavior in fluorescence is proportional to the concentration of CtDNA ranging from 6.5 × 10⁻⁹ M to 31.2 × 10⁻⁸ M and can be utilized for monitoring the concentration of CtDNA. (Similar fluorescence recovery was observed in the presence of hsDNA). Therefore, from the results it is assumed that cationic porphyrin bound to CdTe-TGA peel off in the presence of dsDNA. Similar results were obtained for MnTMPyP.4.5. Synchronous and three dimensional fluorescence measurement
To test the sensitivity of our probe, synchronous fluorescence analysis was carried out following similar experimental conditions as fluorescence measurements.37 Among the fluorescence spectroscopy techniques, synchronous fluorescence spectroscopy (SFS) has some superiority, in terms of high selectivity, low interference and simple spectra. Often, synchronous fluorometry is carried out by scanning simultaneously the excitation and emission monochromators at the same rate while keeping the wavelength difference (or offset) between them constant.38 As shown in Fig. 3b, the synchronous fluorescence peak of the CdTe-TGA is located at 576 when Δλ = 80 nm. The satisfactory results revealed that the emission maxima of the synchronous fluorescence spectra of CdTe-TGA was significantly quenched and recovered by porphyrin and CtDNA respectively. Finally, the three dimensional charts have been introduced in order to compare the quenching and recovery information obtained from the fluorescence studies of QDs. Comparing Fig. S6a and S6b,† we could clearly note that upon addition of the MnTMPyP the intensity of CdTe-TGA QDs decreased and the fluorescence recovery of the QDs in the presence of CtDNA can also be noted from Fig. S6c.† Similar kinds of results were obtained for the other two systems (not shown here). Indeed we speculated from the results, that the fluorimetric strategy offers high sensitivity for probing DNA, utilizing the CdTe-TGA-cationic porphyrin system.5. Mechanism of the reactions
5.1. Interaction between CdTe-TGA and cationic porphyrin
The combination of QDs and macrocyclic molecules and their importance in various applications has long been studied.39,40 The driving force responsible for such a great affinity arises from the electrostatic forces involved in the interaction of the porphyrin moiety and the alkyl ligands (thioglycolic acid) on the surface of QDs. When the electrolyte NaCl was added into the probe system, the intensity of the fluorescence increased because of desorption of cationic porphyrin from the QDs. It is obvious that a nanohybrid is formed between the CdTe QDs–cationic porphyrin molecules by electrostatic forces. In contrast, the interaction of similarly charged QDs (CdTe-DEA) and cationic porphyrin resulted in a poor quenching effect, as shown in Fig. 4A.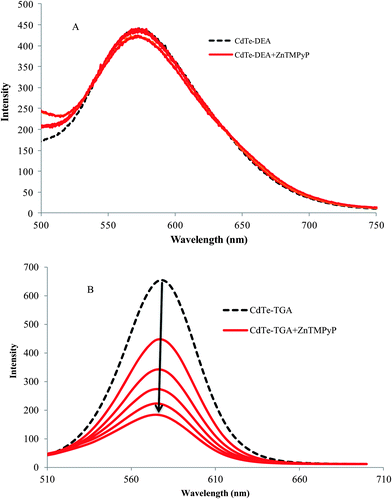 | ||
| Fig. 4 The effect of ZnTMPyP on the fluorescence intensity of (A) positively charged and (B) negatively charged QDs at a concentration of 1 × 10⁻⁷ M (broken line). | ||
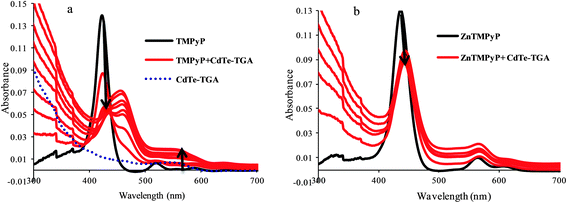
From the absorption data presented in Fig. 5a, the gradual addition of CdTe-TGA on the TMPyP can be seen to result in a red shift followed by hypochromism (indicated be an arrow). This may be due to interaction of the free –NH group of pyrrole ring and CdTe atoms of QDs leading to a great shift and disappearance of the characteristic porphyrin peak at 420 nm and appearance of new peak at around 450 nm. The reverse experiment was carried out where, porphyrin was added to a QDs solution, only a slight shift of the QDs peak was observed (the figure is not shown here). Furthermore, when we introduced metal porphyrin (where pyrrole ring–NH was blocked) instead of free porphyrin, no such drastic changes in peak position was observed (Fig. 5b). Hence metal substituted cationic porphyrins are preferable for our studies. From the above results we can understand the importance of the presence of anchoring groups in porphyrins and their interaction with CdTe-TGA QDs (Fig. 4B).
The question now is which porphyrins are more preferable for the nanohybrid formation. The specificity of choosing positively charged porphyrins was confirmed by varying the surface charges of both the QDs and porphyrins. It is noteworthy that the effect of quenching and the enhancement of QDs solely depend on the anchoring groups on the surface of the porphyrin and the metal present.41 The quenching phenomenon was diminished in the presence of neutral porphyrins like TPP due to the absence of anchoring groups at the surfaces of the porphyrins. dsDNA caused significant enhancement of the fluorescence of the CdTe-TGA QDs porphyrin system. However, in the presence of other anionic porphyrins like TCPP and TSPP (–SO3 and COOH) such recovery in fluorescence was unseen (results not shown here).
5.2. Mechanism of the “turn-on” fluorescent probe
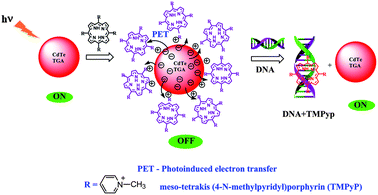
Scheme 1, displays the sensing strategy of the QDs–cationic porphyrin probe towards the target DNA. Choice of porphyrin as an active molecular platform, in our system is due to the fact that they intensively quench the fluorescence intensity of CdTe-TGA and it also serves as a receptor for CtDNA to provide an “ON state”. It has been well reviewed in literature that both metallo and non metallo planar cationic porphyrin intercalate or externally bind with DNA.41 Therefore, the enhancement of fluorescence intensity in the presence of CtDNA at pH 7.5 in Fig. 6 could be attributed to the association of CtDNA with TMPyP, ZnTMPyP and MnTMPyP by electrostatic interactions between the positively charged substituent on the porphyrin periphery and the negatively charged phosphate oxygen atoms of DNA. The photograph reveals turn on-off-on switching under the UV light.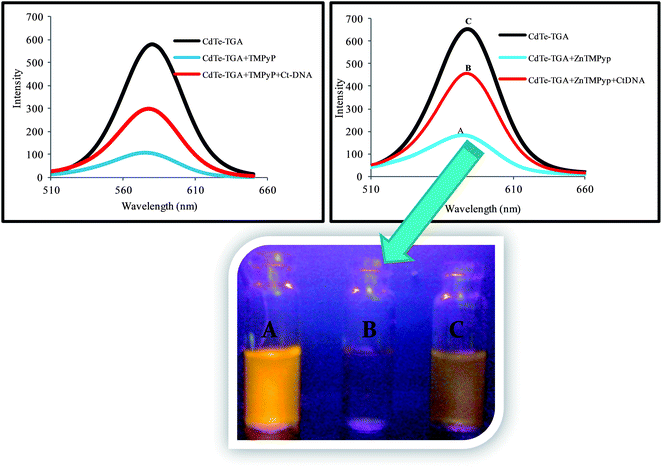 | ||
| Fig. 6 Turn on-off-on behavior of CdTe-TGA QDs at pH 7.5 with combinational quenching and recovery fluorescence spectra and corresponding photographic image under a UV lamp. | ||
5.3. QDs–PET for sensing CtDNA
The quenching and restoration of fluorescence intensity were found to be linearly proportional to the amount of porphyrin and CtDNA respectively; the overall spectrum illustrating the turn on-off-on switching of QDs is shown in Fig. 6. The combined turn on-off-on fluorescence switching of QDs has been authentically explained using fluorimetric methods. Several mechanisms can be attributed to the quenching phenomenon such as inner filter effect, fluorescence resonance energy transfer (FRET), electron transfer etc. One of the necessary factors for FRET is the spectral overlap between the absorption spectrum of acceptors and emission spectrum of donors. The least overlap in absorption and emission spectra of QDs and TMPyP (1 × 10⁻⁵ M) observed is illustrated in Fig. S7,† and rules out the energy transfer process. Evidently, the observed quenching is less likely to be caused by energy transfer, whilst the Rehm–Weller eqn (3), was implicated to prove the other plausible mechanism.| ΔGet = E(ox)1/2 − E(red)1/2 − Es + C | (3) |
E (oxd)1/2 is the oxidation potential of the CdTe-TGA (0.63 V), E(red)1/2 is the reduction potential of the porphyrins, ES is the excited state energy of the fluorophore (2.01 eV) and C is the columbic term. Since one of the species is neutral and the solvent used is polar in nature, the columbic term in the above expression is neglected. The calculated values of ΔGet for the electron transfer process are negative (−0.93, −0.53,−0.62 for TMPyP, ZnTMPyP and MnTMPyP respectively) thus the electron transfer process is thermodynamically feasible.42,43 In order to study the interaction between QDs and porphyrins, we measured the transient absorption spectra. For ZnTMPyP (Fig. S8†) we observed a shift in the wavelength of transient absorption (like a new peak formation) which confirms the interaction of positively charged ZnTMPyP with CdTe-TGA through an electron transfer mechanism.23
5.4. AFM analysis
Inspired by the fluorescence results, we carried out AFM analysis to understand the surface morphology of the sensor system. Fig. 7, presents two and three dimensional AFM images of the semiconductor QDs (a) CdTe-TGA and nanostructured hybrids of CdTe-TGA with (b) ZnTMPyP and (c) ZnTMPyP-CtDNA.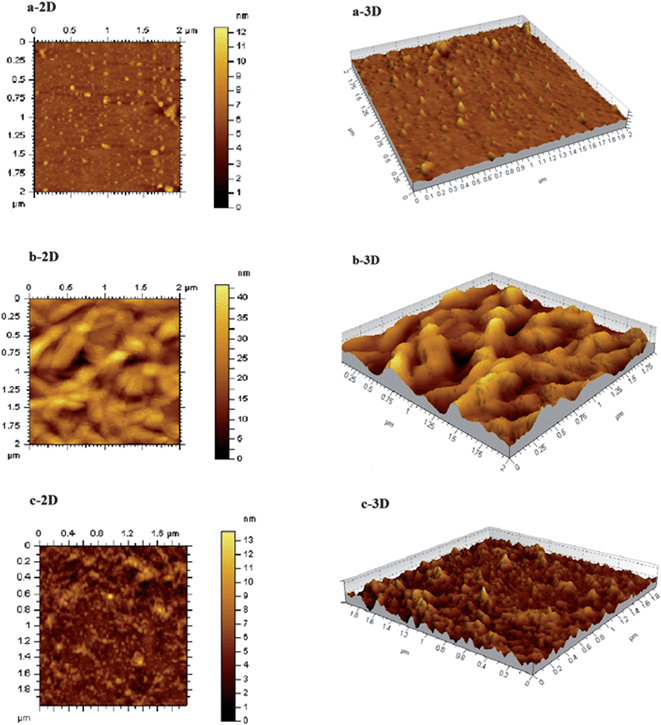 | ||
| Fig. 7 AFM topographic images of (a) CdTe-TGA alone and (b) in the presence of ZnTMPyP and (c) CdTe-TGA + ZnTMPyP + CtDNA nanohybrid as two (left side) and three (right side) dimensional views. | ||
The AFM data provides the information about the change in size of the QDs in the presence of ZnTMPyP and CtDNA. The particle size was determined by measuring the Z-axis height of an imaged particle.44 Initially the QDs exhibited a size of ≈2.5 nm, the addition of porphyrin into the QDs solution enhanced their particle size (the leaf like structures indicate the presence of porphyrin) as shown in Fig. 7. The formation of a complex between the QDs and porphyrin is elucidated from the AFM image and the change in the mean diameter of the QDs was observed and is depicted in Table 1. After the introduction of CtDNA, the particle size of the complex decreased. It is worth emphasizing that our results showed that the porphyrin peeled off from the surface of the QDs and started binding with CtDNA. Hence, the AFM data supports the proposed turn on-off-on behavior.
| Sample no. | System | Particle size/nm |
|---|---|---|
| 1. | CdTe-TGA | ∼2 to 4 |
| 2. | CdTe-TGA + ZnTMPyP | ∼10 |
| 3. | CdTe-TGA + ZnTMPyP + CtDNA | ∼2 to 5 |
5.5. Sensitivity of the CdTe-TGA-cationic porphyrin system for CtDNA
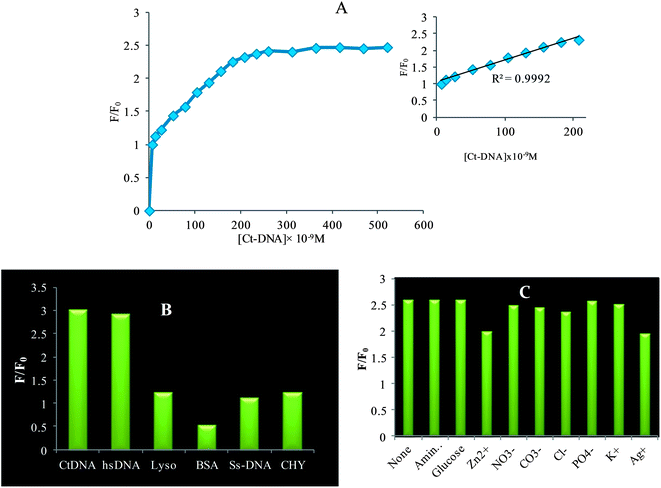
Under the optimal detection conditions, the calibration curve of relative fluorescence intensity versus the concentration of CtDNA was plotted and a linear relationship was obtained for the concentration ranging from 6.5 × 10⁻⁹ M to 29.6 × 10⁻⁸ M with a correlation coefficient R2 = 0.992, the graph is shown in the inset of Fig. 8A. The limit of detection (LOD) was assessed according to the equation, LOD = 3∂/K, where ∂ is the standard deviation of the blank measurements (n = 5), K is the slope of the calibration graph, and the LOD value is 2.72 × 10⁻⁹ M. The least detection limit acquired in the present sensor system can be attributed to the subsequent points, firstly this “turn on” sensor is more sensitive than the “turn off”45 and secondly to their extreme stability in the system. The results summarized in Table 2, clearly explain that the QDs–cationic porphyrin based on-off-on probe possessed an advantage in its sensitivity over other methods.46–51| Sample no. | Systems for sensing CtDNA | Sensitivity range and LOD values | Ref. |
|---|---|---|---|
| 1 | QDs–ruthenium | 17 μM–15 mM and 5.7 μM | 46 |
| 2 | QDs–methylene blue | 1.25 × 10⁻⁷ to 1.25 × 10⁻⁶ M and 4.23 × 10− 8 M | 47 |
| 3 | QDs–anticancer drug | 0–16 × 10−6 M | 22 |
| 4 | ZnS QDs | 0.1–1.2 μg ml−1 and 32.9 μg ml−1 | 48 |
| 5 | CdS nanoparticles | 0–3.5 μg ml−1 and 0.01 μg ml−1 | 49 |
| 6 | Acridine orange–safrin–T | 0–1.1 × 10⁻⁵ mol l−1 and 2.6 × 10⁻⁷ mol l−1 | 50 |
| 7 | CdS–poly(N-hydroxymethyl)acrylamide | 0.05–35 μg ml−1 and 2.2 ng ml−1 | 51 |
| 8 | QDs–cationic porphyrin | 6.5 × 10⁻⁹ M to 29.6 × 10⁻⁸ M and 2.72 × 10⁻⁹ M | This Work |
5.6. Interference of foreign ions in QDs porphyrin system
To gain more insight into the selectivity of the probe, the interference of foreign ions was studied. In order to further investigate the impacts of other biomolecules on the fluorescence recovery of QDs, we carried out identical experiments in the presence of hsDNA, BSA, lysozyme, enzyme and ssDNA instead of CtDNA. The ssDNA which lacks the double helix structure was less efficient in binding with biosensor ensembles, which is reflected in the present study. Moreover large protein molecules like lysozyme and BSA did not show much interference. From the bar diagram shown in Fig. 8B, it can be inferred that the biomolecules have less influence on the emission recovery, which indicates that dsDNA was superior in binding with cationic porphyrin. Thus, the selectivity profile for dsDNA over other biomolecules is high. For adopting this fluorescence probe for CtDNA, it is worthwhile to investigate the influence of other naturally abundant foreign substances in the environment on the stabilized probe. As shown in Fig. 8C, the influence of cations and anions K+, Na2+, Cl−, NO2− and PO4− SO3− is less even at relatively higher concentration that is in the range of 5 × 10⁻² M but Zn2+ and Ag+ on the other hand exhibit more influence even at a lower concentration of 1 × 10⁻⁶ M (error of ±5% in the relative fluorescence intensity was tolerable) While monitoring dsDNA in biological systems, it is important to consider the possible interference from species like amino acids and glucose; on examining it turned out that they exhibit only 2–3% perturbation on the recovery response. Henceforth, the present probe provides a more sensitive, simple fluorescence sensor for the detection of CtDNA in buffer media at physiological pH.6. Conclusion
A thorough photophysical investigation of the QDs–cationic porphyrins system has been undertaken using steady state, life time and transient measurements. By combining the QDs and cationic porphyrin, we successfully detected CtDNA. In addition, it was clarified from the results that the metal substituted cationic porphyrin was more preferable for dsDNA. AFM results clearly reveal information on the construction of the presented probe. Moreover, we believe that our findings present a possible approach for future research in designing highly sensitive biosensors.Acknowledgements
EV thanks the UGC SAP Fellowship for Meritorious Students, EV and RR thank DST and the Government of India (Ref: SR/NM/NS-16/2007, dt.: 26–09–08) and (Ref: SR/S1/PC-12/2011, 20.9.2011) for the project. Authors thank Professor K. Jeganathan, Bharathidasan University for AFM measurements.References
- M. Hong, J. Zhu and H.-D. Yin, Chin. J. Anal. Chem., 2011, 39, 146–154 CrossRef CAS.
- K. Jiao, Q. X. Wang, W. Sun and F. F. Jian, J. Inorg. Biochem., 2005, 99, 1369–1375 CrossRef CAS PubMed.
- P. Kalaivani, R. Prabhakaran, F. Dallemer, P. Poornima, E. Vaishnavi, E. Ramachandran, V. V. Padma, R. Renganathan and K. Natarajan, Metallomics, 2012, 4, 101–113 RSC.
- C. Z. Huang, Y. F. Li and P. Feng, Talanta, 2001, 55, 321–328 CrossRef CAS.
- R. M. El-Shishtawy, A. M. Asiri, S. A. Basaif and T. Rashad Sobahi, Spectrochim. Acta, Part A, 2010, 75, 1605–1609 CrossRef PubMed.
- T. Bando and H. Sugiyama, Acc. Chem. Res., 2006, 39, 935–944 CrossRef CAS PubMed.
- D. Mutavdžić, J. Xu, G. Thakur, R. Triulzi, S. Kasas, M. Jeremić, R. Leblanc and K. Radotić, Analyst, 2011, 136, 2391–2396 RSC.
- R. Freeman and I. Willner, Chem. Soc. Rev., 2012, 41, 4067–4085 RSC.
- J. Guo, W. Yang and C. Wang, J. Phys. Chem. B, 2005, 109, 17467–17473 CrossRef CAS PubMed.
- E. Vaishnavi and R. Renganathan, Spectrochim. Acta, Part A, 2013, 115, 603–609 CrossRef CAS PubMed.
- A. Rameshkumar, T. Sivasudha, R. Jeyadevi, B. Sangeetha, D. A. Ananth, G. S. B. Aseervatham, N. Nagarajan, R. Renganathan and A. Kathiravan, Colloids Surf., B, 2013, 101, 74–82 CrossRef CAS PubMed.
- J. Peng, S. Liu, S. Yan, X. Fan and Y. He, Colloids Surf., A, 2010, 359, 13–17 CrossRef CAS PubMed.
- C. Spangler, M. Schaeferling and O. S. Wolfbeis, Microchim. Acta, 2007, 161, 1–39 CrossRef.
- W. R. Algar and U. J. Krull, Anal. Bioanal. Chem., 2007, 391, 1609–1618 CrossRef PubMed.
- P. Ray, G. Darbha, A. Ray, J. Walker and W. Hardy, Plasmonics, 2007, 2, 173–183 CrossRef CAS.
- G. Jiang, A. S. Susha, A. A. Lutich, F. D. Stefani, J. Feldmann and A. L. Rogach, ACS Nano, 2009, 3, 4127–4131 CrossRef CAS PubMed.
- W. C. Chan and S. Nie, Science, 1998, 281, 2016–2018 CrossRef CAS.
- K. E. Sapsford, L. Berti and I. L. Medintz, Angew. Chem., Int. Ed., 2006, 45, 4562–4589 CrossRef CAS PubMed.
- M. Suzuki, Y. Husimi, H. Komatsu, K. Suzuki and K. T. Douglas, J. Am. Chem. Soc., 2008, 130, 5720–5725 CrossRef CAS PubMed.
- I. Yildiz, M. Tomasulo and F. M. Raymo, Proc. Natl. Acad. Sci. U. S. A., 2006, 103, 11457–11460 CrossRef CAS PubMed.
- A. R. Clapp, I. L. Medintz, J. M. Mauro, B. R. Fisher, M. G. Bawendi and H. Mattoussi, J. Am. Chem. Soc., 2004, 126, 301–310 CrossRef CAS PubMed.
- J. Yuan, W. Guo, X. Yang and E. Wang, Anal. Chem., 2009, 81, 362–368 CrossRef CAS PubMed.
- M. A. Jhonsi and R. Renganathan, J. Colloid Interface Sci., 2010, 344, 596–602 CrossRef CAS PubMed.
- J. Britton, E. Antunes and T. Nyokong, J. Photochem. Photobiol., A, 2010, 210, 1–7 CrossRef CAS PubMed.
- S. Mandal, M. Rahaman, S. Sadhu, S. K. Nayak and A. Patra, J. Phys. Chem. C, 2013, 117, 3069–3077 CAS.
- N. Gaponik, D. V. Talapin, A. L. Rogach, K. Hoppe, E. V. Shevchenko, A. Kornowski, A. Eychmüller and H. Weller, J. Phys. Chem. B, 2002, 106, 7177–7185 CrossRef CAS.
- W. W. Yu, L. Qu, W. Guo and X. Peng, Chem. Mater., 2003, 15, 2854–2860 CrossRef CAS.
- R. K. Ĉapek, I. Moreels, K. Lambert, D. De Muynck, Q. Zhao, A. Van Tomme, F. Vanhaecke and Z. Hens, J. Phys. Chem. C, 2010, 114, 6371–6376 Search PubMed.
- H. Gonçalves, C. Mendonça and J. C. E. da Silva, J. Fluoresc., 2008, 19, 141–149 CrossRef PubMed.
- R. Kuang, X. Kuang, S. Pan, X. Zheng, J. Duan and Y. Duan, Microchim. Acta, 2010, 169, 109–115 CrossRef CAS.
- V. Sgobba, C. Schulz-Drost and D. M. Guldi, Chem. Commun., 2007, 565–567 RSC.
- S. HabibáKazemi, Analyst, 2012, 137, 5553–5559 RSC.
- S. A. Gallagher, S. Comby, M. Wojdyla, T. Gunnlaugsson, J. M. Kelly, Y. K. Gun'ko, I. P. Clark, G. M. Greetham, M. Towrie and S. J. Quinn, Inorg. Chem., 2013, 52, 4133–4135 CrossRef CAS PubMed.
- P. M. Keane, S. A. Gallagher, L. M. Magno, M. J. Leising, I. P. Clark, G. M. Greetham, M. Towrie, Y. K. Gun'ko, J. M. Kelly and S. J. Quinn, Dalton Trans., 2012, 41, 13159–13166 RSC.
- Joseph R. Lakowicz, Princ. Fluoresc. Spectrosc., 2006, 97–155 CrossRef.
- A. Kathiravan and R. Renganathan, J. Colloid Interface Sci., 2009, 331, 401–407 CrossRef CAS PubMed.
- D. Patra and T. H. Ghaddar, Talanta, 2009, 77, 1549–1554 CrossRef CAS PubMed.
- L. Wang, A. N. Liang, H.-Q. Chen, Y. Liu, B.-b. Qian and J. Fu, Anal. Chim. Acta, 2008, 616, 170–176 CrossRef CAS PubMed.
- S. Moeno and T. Nyokong, J. Photochem. Photobiol., A, 2009, 201, 228–236 CrossRef CAS PubMed.
- E. I. Zenkevich, T. Blaudeck, A. Milekhin and C. Von Borczyskowski, Int. J. Spectrosc., 2011, 2012, 1–14 CrossRef PubMed.
- K. Zupán, L. Herényi, K. Tóth, Z. Majer and G. Csík, Biochemistry, 2004, 43, 9151–9159 CrossRef PubMed.
- K. Kalyanasundaram and M. Neumann-Spallart, J. Phys. Chem., 1982, 86, 5163–5169 CrossRef CAS.
- S. Moeno, M. Idowu and T. Nyokong, Inorg. Chim. Acta, 2008, 361, 2950–2956 CrossRef CAS PubMed.
- V. Poderys, M. Matulionyte, A. Selskis and R. Rotomskis, Nanoscale Res. Lett., 2010, 6, 1–6 Search PubMed.
- Y. Shang, L. Qi and F. y. Wu, Microchim. Acta, 2012, 177, 333–339 CrossRef CAS.
- D. Gao, Z. Sheng and H. Han, Microchim. Acta, 2010, 168, 341–345 CrossRef CAS.
- J.-S. Shen, T. Yu, J.-W. Xie and Y.-B. Jiang, Phys. Chem. Chem. Phys., 2009, 11, 5062–5069 RSC.
- Y. Li, J. Chen, C. Zhu, L. Wang, D. Zhao, S. Zhuo and Y. Wu, Spectrochim. Acta, Part A, 2004, 60, 1719–1724 CrossRef PubMed.
- L.-Y. Wang, L. Wang, F. Gao, Z.-Y. Yu and Z.-M. Wu, Analyst, 2002, 127, 977–980 RSC.
- Y. Cao, X. He, Z. Gao and L. Peng, Talanta, 1999, 49, 377–383 CrossRef CAS.
- L. Wang, J. Fu, H. Chen, A. Liang, B. Qian, B. Ling and C. Zhou, J. Lumin., 2010, 130, 845–850 CrossRef CAS PubMed.
Footnote |
| † Electronic supplementary information (ESI) available. See DOI: 10.1039/c3an01871g |
| This journal is © The Royal Society of Chemistry 2014 |

