A general method for optimizing the parameter of α/β discrimination in liquid scintillation counting
Xiao-gui
Feng
,
Qian-ge
He
,
Jian-chen
Wang
and
Jing
Chen
*
Institute of Nuclear and New Energy Technology, Tsinghua University, P.O. Box 1021, 102201 Beijing, PR China. E-mail: jingxia@tsinghua.edu.cn; Fax: +86-10-62771740; Tel: +86-10-89796064
First published on 15th October 2013
Abstract
In the application of liquid scintillation counting (LSC), the α/β discrimination is carried out with the function of pulse shape analysis (PSA), which requires the setting of the optimum PSA level. The optimum PSA is usually determined by the generation of cross-over plots (referred as Conventional Method), whereby a pair of pure α and β emitters is essential. However, in some cases, a pure α or β emitter is not available. In order to deal with this problem, we have developed a new approach (referred as Present Method) to set the optimum PSA by measuring the sample itself of mixed α/β emitters. The results from Present Method are in good agreement with those from Conventional Method when a pair of pure α and β emitters is available. Besides the obvious advantage that Present Method can be applied no matter whether a pure α emitter or a pure β emitter is available or not, Present Method has another important advantage that it is not necessary to prepare the quench curves for the measurement of samples with different quench levels. Therefore, Present Method is a general method for optimizing the parameter of α/β discrimination in LSC. In addition, the application of Present Method can be broadened by combining the method with α spectrometry.
1. Introduction
Liquid scintillation counting (LSC) is widely used in the field of radionuclide metrology.1–4 One advantage of LSC is the capability to determine α and β emitters simultaneously. The simultaneous determination of α and β emitters is based on the α/β discrimination, which is carried out with the function of pulse shape analysis (PSA). PSA is a special function of LSC spectrometers which discriminates α from β radiations and directs them separately into α- or β-multi-channel analyzers (MCA). Under common conditions, there would be a few α events erroneously directed into β-MCA, and vice versa. The discrimination results vary with the PSA level set by the user. The optimum PSA and misclassification at the optimum are usually determined by the generation of cross-over plots, which requires a pair of vials, one containing a pure α emitter and the other a pure β emitter.5–7 Naturally, this method (referred as Conventional Method) cannot be applied when a pure α emitter or a pure β emitter is not available. Therefore, in our previous study on the determination of 237Np/233Pa, we developed a new approach (referred as Present Method) to set the optimum PSA by measuring the mixed sample itself.8 However, the relation between Present Method and Conventional Method has not been clarified in the previous study. The main purpose of this work is to study the relation and to demonstrate that Present Method is a general method, which can be used to set the optimum PSA no matter whether a pure α emitter or a pure β emitter is available or not.2. Experimental
2.1. Equipment
The LSC measurements were carried out in an LSC spectrometer (Quantulus 1220, Perkin Elmer), the PSA parameter of which can be set between 1 and 256. Quenching is monitored with the aid of the external standard's Compton electron spectrum end point (SQP(E)) when the value of SQP(E) is needed.Alpha spectrometer (Alpha Analyst 7200) with passivated implanted planar silicon (PIPS) detectors of 300 mm2 active area was produced by Canberra Industries, Inc.
2.2. Materials
We prepared LSC samples with two commercially available cocktails, i.e. Ultima Gold AB and OptiPhase Hisafe 3 (Perkin Elmer), in 20 mL polyethylene vials (Perkin Elmer). 241Am, 90Sr/90Y and 137Cs in nitric acid were provided by China Institute of Atomic Energy. Uranium standard solution with the concentration of 408.5 μg g−1 was prepared from standard reagent U3O8, according to the procedure as described in ref. 9.The quenching agent employed in this study was the simulated solution (referred as SimS) which reflects the quenching effect of acid and salt. SimS was a mixture of 1.0 mol L−1 HNO3 and metallic ions, the concentrations of which were 18.3, 6.0, 5.7, 2.9 and 1.5 g L−1 for Na, Fe, Al, Ni and Nd, representing the main composition of Chinese high level liquid waste.
2.3. Method
Several pairs of vials, one containing a pure α emitter (241Am) and the other a pure β emitter (90Sr/90Y or 137Cs), were counted sequentially at a series of PSAs. Every optimum PSA was determined with two methods: Conventional Method and Present Method.For Conventional Method, the optimum PSA is determined by the generation of cross-over plot, whereby the percentage misclassification is defined as eqn (1)–(4). In eqn (1)–(4), “C” stands for count rate, and “E” the percentage misclassification; the subscript “A” stands for α emitter, “B” β emitter, “α” α-MCA, and “β” β-MCA; the superscript “PK” stands for the peak area of α emitter in this study (Fig. 1). For example, CAα denotes the count rate of the α emitter on the α-MCA; CAβ denotes the count rate of the α emitter on the β-MCA; and EA denotes the percentage of α particles misclassified into the β-MCA when an α emitter is measured. The region of interest for any “C” usually refers to the whole spectrum, except that with the superscript “PK”, which refers to the peak area of α emitter in α-MCA only. As shown in Fig. 1 and eqn (4), the count rate in α-MCA outside the PK area is still assigned to β emitter, because this portion of count rate will not interfere with the count rate of α emitter.
| CA = CAα + CAβ | (1) |
| CB = CBα + CBβ | (2) |
 | (3) |
 | (4) |
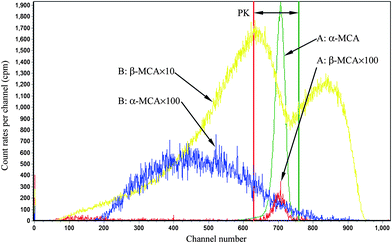 | ||
| Fig. 1 An example of LSC spectra. A: 241Am, B: 90Sr/90Y, in 10 mL Ultima Gold AB + 0.3 mL SimS, PSA = 80. | ||
For Present Method, the optimum PSA is obtained according to the following steps: (1) summarizing the count rates of any pair of α and β emitters within the PK area at a series of PSAs as eqn (5), which gives the value of Cα; (2) graphing the relation between Cα and PSA, which will always have an inflection point related to the optimum PSA; (3) fitting the data near the inflection point with the function y = ax3 + bx2 + cx + d, from which the value of optimum PSA can be simply obtained as −b/(3a) when the second derivative of the function, y′′, is equal to zero; (4) calculating the Cα at the optimum PSA with the function y = ax3 + bx2 + cx + d, while the relative error of Cα, Eα, is defined as eqn (6).
| Cα = CPKAα + CPKBα | (5) |
 | (6) |
The above statements focus on how to obtain Cα. The count rate of β emitter can be easily obtained from the difference between (CA + CB) and Cα.
3. Results and discussion
3.1. Measurements for different pairs of α and β emitters in two cocktails
Two groups of vials, one in 10 mL Ultima Gold AB and the other in 10 mL OptiPhase Hisafe 3, were measured to study the relation between Conventional Method and Present Method. For each group, any vial of β emitter can be paired with the vial of α emitter, resulting in the eight pairs as listed in Table 1.| Group | Pair ID | α emitter | β emitter | Cocktail |
|---|---|---|---|---|
| 1 | G1P1 | 1375 Bq 241Am | 1281 Bq 90Sr/90Y | 10 mL Ultima Gold AB |
| G1P2 | 1416 Bq 137Cs | |||
| G1P3 | 12692 Bq 90Sr/90Y | |||
| G1P4 | 13805 Bq 137Cs | |||
| 2 | G2P1 | 1441 Bq 241Am | 1277 Bq 90Sr/90Y | 10 mL OptiPhase Hisafe 3 |
| G2P2 | 1421 Bq 137Cs | |||
| G2P3 | 12542 Bq 90Sr/90Y | |||
| G2P4 | 13666 Bq 137Cs |
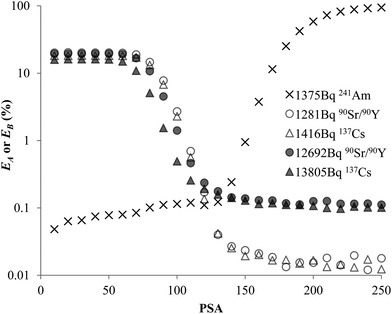
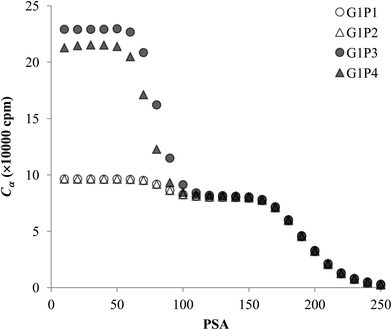
The experimental data for each pair of α and β emitters can be processed with both Conventional Method and Present Method. Due to the difference of the cocktail, the PK areas for the two groups have a little difference, which are channels 710–820 for the first group and channels 680–790 for the second group. Considering that the figures for the two groups are very similar to each other, we only present the figures for the first group as examples (Fig. 2–4). Fig. 2 shows the cross-over plots for Conventional Method, from which four optimum PSAs are obtained as shown by the corresponding cross-over points (between 120 and 140). Fig. 3 and 4 show the data process for Present Method. Fig. 3 shows that Cα changes monotonically with the increase of the PSA, and there is always an inflection point near the Cα of 8 × 10![[thin space (1/6-em)]](https://www.rsc.org/images/entities/char_2009.gif) 000 cpm. For clarity, the data near the inflection point are redrawn in Fig. 4. By fitting the data displayed in Fig. 4 with the function y = ax3 + bx2 + cx + d, the parameters (a, b, c, d) related to the function are obtained as listed in Table 2, from which three parameters at the optimum are derived: x = PSA parameter, y = count rate (cpm) and y′ = the derivative of y. All the absolute value of y′ at the optimum PSA is very small relative to y, which implies the error of y resulting from the uncertainty of PSA near the optimum (e.g., the uncertainty of PSA is 5) can usually be ignored. From this point of view, the optimum PSAs obtained from Present Method are in good agreement with those from Conventional Method. This result can also be confirmed by the small measurement error listed in the last column of Table 2 (less than 3%).
000 cpm. For clarity, the data near the inflection point are redrawn in Fig. 4. By fitting the data displayed in Fig. 4 with the function y = ax3 + bx2 + cx + d, the parameters (a, b, c, d) related to the function are obtained as listed in Table 2, from which three parameters at the optimum are derived: x = PSA parameter, y = count rate (cpm) and y′ = the derivative of y. All the absolute value of y′ at the optimum PSA is very small relative to y, which implies the error of y resulting from the uncertainty of PSA near the optimum (e.g., the uncertainty of PSA is 5) can usually be ignored. From this point of view, the optimum PSAs obtained from Present Method are in good agreement with those from Conventional Method. This result can also be confirmed by the small measurement error listed in the last column of Table 2 (less than 3%).
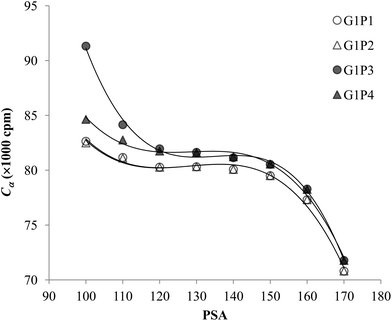 | ||
| Fig. 4 The enlargement of Fig. 3 near the optimum PSA. | ||
| Pair ID | a | b | c | d | R 2 | Parameters at the optimum | E α (%) | ||
|---|---|---|---|---|---|---|---|---|---|
| x | y | y′ | |||||||
| G1P1 | −0.1449 | 55.787 | −7130.3 | 382![[thin space (1/6-em)]](https://www.rsc.org/images/entities/char_2009.gif) 936 936 |
0.9904 | 128.3 | 80![[thin space (1/6-em)]](https://www.rsc.org/images/entities/char_2009.gif) 404 404 |
29.1 | −2.54 |
| G1P2 | −0.1432 | 55.052 | −7022.4 | 377![[thin space (1/6-em)]](https://www.rsc.org/images/entities/char_2009.gif) 690 690 |
0.9901 | 128.1 | 80![[thin space (1/6-em)]](https://www.rsc.org/images/entities/char_2009.gif) 487 487 |
32.4 | −2.44 |
| G1P3 | −0.2427 | 98.466 | −13![[thin space (1/6-em)]](https://www.rsc.org/images/entities/char_2009.gif) 294 294 |
678![[thin space (1/6-em)]](https://www.rsc.org/images/entities/char_2009.gif) 575 575 |
0.9970 | 135.2 | 81![[thin space (1/6-em)]](https://www.rsc.org/images/entities/char_2009.gif) 300 300 |
22.2 | −1.45 |
| G1P4 | −0.1466 | 56.684 | −7292.6 | 393![[thin space (1/6-em)]](https://www.rsc.org/images/entities/char_2009.gif) 849 849 |
0.9932 | 128.9 | 81![[thin space (1/6-em)]](https://www.rsc.org/images/entities/char_2009.gif) 676 676 |
13.2 | −1.00 |
| G2P1 | −0.1313 | 44.299 | −4947.8 | 268![[thin space (1/6-em)]](https://www.rsc.org/images/entities/char_2009.gif) 798 798 |
0.9988 | 112.5 | 85![[thin space (1/6-em)]](https://www.rsc.org/images/entities/char_2009.gif) 880 880 |
34.2 | −0.67 |
| G2P2 | −0.1295 | 43.557 | −4847.7 | 264![[thin space (1/6-em)]](https://www.rsc.org/images/entities/char_2009.gif) 342 342 |
0.9987 | 112.1 | 85![[thin space (1/6-em)]](https://www.rsc.org/images/entities/char_2009.gif) 845 845 |
35.7 | −0.71 |
| G2P3 | −0.1938 | 69.716 | −8369.9 | 422![[thin space (1/6-em)]](https://www.rsc.org/images/entities/char_2009.gif) 428 428 |
0.9985 | 119.9 | 87![[thin space (1/6-em)]](https://www.rsc.org/images/entities/char_2009.gif) 065 065 |
−10.2 | 0.70 |
| G2P4 | −0.1530 | 53.201 | −6170.4 | 325![[thin space (1/6-em)]](https://www.rsc.org/images/entities/char_2009.gif) 992 992 |
0.9998 | 115.9 | 87![[thin space (1/6-em)]](https://www.rsc.org/images/entities/char_2009.gif) 282 282 |
−4.1 | 0.95 |
The above result is also supported by the data for the second group. The parameters for Present Method are listed in the second half of Table 2. And the four optimum PSAs obtained from Conventional Method are between 110 and 130 (as mentioned above, the cross-over plots are omitted).
3.2. The effect of quenching on the optimum PSA setting
By using Conventional Method, some researchers have reported that quenching will have impact on the optimum PSA.10–13 There is no doubt that we can use Present Method to reprocess the experimental data which have been processed with Conventional Method. As an example for comparing Conventional Method and Present Method in measuring samples with different quench levels, we reprocessed the data concerning the pair of 241Am and 90Sr/90Y in Cocktail C, which refers to one batch of Ultima Gold AB in ref. 12. In the experiment, a pair of vials, one containing 10 μL 241Am solution and the other 10 μL 90Sr/90Y solution mixed with 10 mL Ultima Gold AB, were taken to study the effect of quenching on the optimum PSA, by gradually adding quenching agent SimS from 0 to 1300 μL for eight runs (Table 3). As mentioned in Section 2.1, quenching is monitored with the parameter SQP(E), the detail of which is described in ref. 12.| Run no. | 1 | 2 | 3 | 4 | 5 | 6 | 7 | 8 |
|---|---|---|---|---|---|---|---|---|
| Volume of SimS (μL) | 0 | 100 | 300 | 500 | 700 | 900 | 1100 | 1300 |
| PK area (channels) | 725–825 | 690–795 | 630–760 | 600–735 | 575–715 | 490–690 | 475–680 | 475–680 |
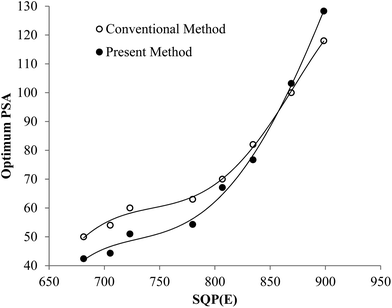
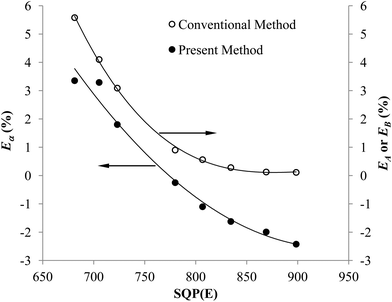
Fig. 5 shows that the trend of the optimum PSA vs. SQP(E) from Present Method is the same as that from Conventional Method. With the volume of SimS added in each vial increasing from 0 to 1300 μL, the SQP(E) decreases, resulting in the decrease of the optimum PSA. Fig. 6 shows the percentage misclassification for Conventional Method and the relative error of Cα for Present Method at the optimum. Even though the general trend is the same, the line for Present Method is obviously positioned below that for Conventional Method. This is resulting from the different definition of EA, EB and Eα. From eqn (1)–(6), we can obtain eqn (7):
 | (7) |
Eqn (7) shows the relation between Eα and EB, the latter of which is equal to EA at the cross-over point (Fig. 2). Under the condition of this experiment, CA = 68![[thin space (1/6-em)]](https://www.rsc.org/images/entities/char_2009.gif) 873 cpm, CB = 66
873 cpm, CB = 66![[thin space (1/6-em)]](https://www.rsc.org/images/entities/char_2009.gif) 872 cpm, Eα is mainly affected by EB and the ratio of CPKAα to CA. The difference between Eα and EB, EB − Eα, can be estimated as 1 − CPKAα/CA, which varies with the selection of PK area. The PK areas listed in Table 3 are selected with the following considerations: (1) including the peak of α emitter as more as possible; (2) excluding the interference from β emitter as more as possible. Due to these two contrary requirements, the selection of PK area will often lead to loss of counts for α emitter, especially when the LSC spectrum of α emitter has obvious tailing interference (refer to Fig. 1). Incidentally, as listed in Table 2, the Eα for the first group is less than that for the second group. This is because the LSC spectrum of α emitter in Ultima Gold AB has larger tailing interference than that in OptiPhase Hisafe 3.
872 cpm, Eα is mainly affected by EB and the ratio of CPKAα to CA. The difference between Eα and EB, EB − Eα, can be estimated as 1 − CPKAα/CA, which varies with the selection of PK area. The PK areas listed in Table 3 are selected with the following considerations: (1) including the peak of α emitter as more as possible; (2) excluding the interference from β emitter as more as possible. Due to these two contrary requirements, the selection of PK area will often lead to loss of counts for α emitter, especially when the LSC spectrum of α emitter has obvious tailing interference (refer to Fig. 1). Incidentally, as listed in Table 2, the Eα for the first group is less than that for the second group. This is because the LSC spectrum of α emitter in Ultima Gold AB has larger tailing interference than that in OptiPhase Hisafe 3.
To sum up, both Fig. 5 and 6 have manifested that the results from Present Method are in good agreement with those from Conventional Method.
3.3. Application of Present Method
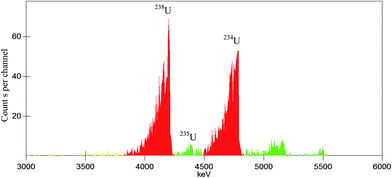
Besides the application in the determination of ordinary sample such as the mixture of 237Np/233Pa,8 in which only one kind of α emitter is present, Present Method can also be applied in the determination of samples including more than one kind of α emitter, by using the technique described in ref. 7. The main idea of the technique is to obtain the radioactivity of each α emitter by multiplying the total radioactivity of all α emitters obtained from LSC and the radioactivity percentage of each α emitter obtained from α spectrometry.We take the absolute measurement of uranium concentration in solution as an example. One sample was prepared by pipetting 0.7967 g (about 0.8 mL) uranium standard solution into a 20 mL polyethylene vial and adding 10 mL OptiPhase Hisafe 3. The sample was measured at PSA = 50, 60, 70, 80, 90, 100, 110 and 120. Fitting the count rate in channels 550–720 of α-MCA as described above can obtain that the count rate at the optimum (PSA = 82.2) is 505.5 cpm. Fig. 7 shows the LSC spectra of the sample near the optimum (PSA = 80). The LSC spectrum in α-MCA is assigned to the mixture of 234U, 235U and 238U, the radioactivity percentage of which can be obtained from α spectrometry (Fig. 8). Considering the half-life of 234U (2.445 × 10⁵ years), 235U (7.038 × 10⁸ years) and 238U (4.468 × 10⁹ years),14 we can neglect the contribution of 234U to the uranium mass concentration.
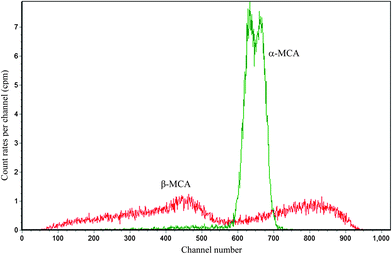 | ||
| Fig. 7 The LSC spectra for 0.8 mL uranium standard solution in 10 mL OptiPhase Hisafe 3 at PSA = 80. | ||
By combining the data shown in Fig. 7 and 8 (peaks unlabelled in Fig. 8 are assigned to 239-240Pu and 241Am which are often measured in our laboratory and may contaminate the detector or chamber), the mass concentration of 235U and 238U can be calculated as 3.2 and 404.6 μg g−1 (the calculation method is similar to that described in ref. 9). As a result, the total uranium mass concentration is 407.8 μg g−1, which is very close to the nominal value 408.5 μg g−1.
One thing should be emphasized here that Present Method eliminates the need to prepare the quench curves for the measurement of samples with different quench levels, leading to that only one sample is needed for this kind of application. But for ref. 9, where Conventional Method was applied, a series of uranium samples with different quench levels had to be prepared and measured. Therefore, the present measurement method is much easier than that in ref. 9.
4. Conclusions
The optimum PSA can be determined with both Conventional Method and Present Method. The results from Present Method are in good agreement with those from Conventional Method when a pair of pure α and β emitters is available. Moreover, Present Method can also be applied in the absence of a pure α emitter or a pure β emitter, while Conventional Method is not applicable. Present Method can eliminate the need to prepare the quench curves for the measurement of samples with different quench levels, for the optimum PSA is obtained by measuring the mixed sample itself. The application of Present Method can be broadened by combining the method with α spectrometry.Acknowledgements
This work is supported by the National Natural Science Foundation of China, grant 21271113.References
- D. L. Horrocks, Applications of Liquid Scintillation Counting, Academic Press, New York, London, 1974 Search PubMed.
- J. W. McKlveen and W. J. McDowell, Nucl. Instrum. Methods Phys. Res., Sect. A, 1984, 223, 372 CrossRef CAS.
- D. Z. Yang, Y. J. Zhu and S. Möbius, J. Radioanal. Nucl. Chem. Art., 1991, 147(1), 177 CrossRef CAS.
- D. Z. Yang, Y. J. Zhu and R. Z. Jiao, J. Radioanal. Nucl. Chem. Art., 1994, 183(2), 245 CrossRef CAS.
- L. Pujol and J.-A. Sanchez-Cabeza, Analyst, 1997, 122, 383 RSC.
- J. M. Pates, G. T. Cook, A. B. MacKenzie and C. J. Passo, Jr, Analyst, 1998, 123, 2201 RSC.
- X. G. Feng and Q. G. He, Nucl. Instrum. Methods Phys. Res., Sect. A, 2009, 609, 165 CrossRef CAS PubMed.
- X. G. Feng, Q. G. He, J. C. Wang and J. Chen, Liquid Scintillation Spectrometry, Appl. Radiat. Isot., 2013 Search PubMed , under review.
- X. G. Feng, Q. G. He, Z. G. Chen, Z. Y. Wang and J. F. Guo, Atomic Energy Science and Technology, also known as Yuanzineng Kexue Jishu, 2010, 44(S), 63 Search PubMed.
- D. Z. Yang, in Liquid Scintillation Spectrometry 1994, ed. G. T. Cook, D. D. Harkness, A. B. MacKenzie, B. F. Miller and E. M. Scott, Radiocarbon, Tucson, AZ, 1996, pp. 339–344 Search PubMed.
- J.-A. Sanchez-Cabeza and L. Pujol, Analyst, 1998, 123, 399 RSC.
- X. G. Feng, Q. G. He, J. C. Wang and J. Chen, Appl. Radiat. Isot., 2012, 70, 1536 CrossRef CAS PubMed.
- X. G. Feng, Q. G. He, J. C. Wang and J. Chen, J. Radioanal. Nucl. Chem., 2013, 295, 1495 CrossRef CAS PubMed.
- C. Hacker, Radiation decay (free software), version 3.6, Griffith University, Australia, 2005 Search PubMed.
| This journal is © The Royal Society of Chemistry 2014 |

