Structure effect of carbon nanovectors in regulation of cellular responses†
Shashwat S. Banerjeea,
Archana Jalota-Badhwarb,
Prateek Watec,
Sneha Asaia,
Khushbu R. Zopea,
Russel Mascarenhasa,
Dimple Bhatiab and
Jayant Khandare‡*a
aNCE-Polymer Chemistry Group, Piramal Life Science Ltd., Goregaon, Mumbai-400063, India. E-mail: jayant.khandare@mitpune.edu.in
bCancer Biology Group, Piramal Healthcare Ltd., Goregaon, Mumbai-400063, India
cMaterials Science and Engineering, University of Florida, Gainesville, FL 32608, USA
First published on 21st August 2013
Abstract
Carbon nanostructures such as multiwalled carbon nanotubes (CNT) and graphene (G) are potential candidates in a large number of biomedical applications. However, there is limited understanding and connection between the physicochemical properties of diverse carbon nanostructures and biological systems, particularly with regard to cellular responses. It is also crucial to understand how the structure and surface composition of carbon nanostructures affect the cellular internalization process. Here, through in vitro cellular entry kinetics and cytotoxicity studies using MCF-7 breast cancer cells and H460 human lung cancer cells, we show that the structure and surface composition of CNT and G conjugates with various molecules such as PAMAM dendrimers (G4) and G4-poly(ethylene glycol) (PEG) are directly related to their cellular internalization ability and toxicity. Interestingly, the cellular association of CNT and G nanoconjugates was observed to be structure and surface composition dependent. We found that CNT conjugates internalized more compared to G conjugates. Furthermore, G4 conjugated CNT internalized more compared to G4-PEG conjugated CNT, whereas, higher internalization was found for G4-PEG conjugated G than G4 conjugated G. We have also correlated the cytotoxicity and cellular uptake mechanisms of CNT, G, and their conjugates through zeta potential measurements, fluorescence quenching studies and by fluorescence-activated cell sorting. Altogether these studies suggest different biological activities of the carbon nanostructures, with the shape and surface composition playing a primary role.
Introduction
Carbon allotropes such as carbon nanotubes (CNT) and more recently graphene (G) have attracted a great deal of interest in the field of biomedical applications such as drug delivery or as probes for imaging.1–4 However, their delivery capability in the biological environment is still largely unknown. Limited knowledge on the effect of their structure and surface composition in tuning the biological outcomes has hindered their widespread acceptance in the field of biomedicine in general, and as unique bioactive nanocarrier systems in particular.4CNTs are among the most promising nanoparticles for applications in the biomedical field due to their quasi-one-dimensional (1D) nanostructure, ultra high surface area, unique optical and electronic properties, and better biocompatibility, thus making a “smart” nanoparticle-based system for drug delivery and in vivo bioimaging.5–7 The use of CNTs in the targeted delivery of biomolecules into biological systems carries enormous medical and commercial potential. However, a detailed understanding of their cellular internalization mechanism, intracellular dynamics, and biological toxicity is of paramount importance for the development of these nanomaterials as drug delivery vehicles.
Similarly, G, a two-dimensional (2D) nanomaterial, has attracted tremendous attention due its novel physical properties and potential applications in nanoelectronic devices, transparent conductors, and nanocomposite materials.8–13 Apart from the interest in electrical applications, G based materials are exciting candidates for exploration in biology and medicine, including biodevices, disease diagnosis, and drug delivery systems.2,14,15 A key issue that needs to be understood in the implementation of carbon allotrope nanomaterials such as G and CNTs in a large range of biological applications are their biological responses. Although the two materials have a similar crystalline structure and chemical composition, their interactions with cell systems are expected to be governed by different mechanisms due to their different structures (flat atomic sheets for G and tubular for CNTs). The cellular kinetics, intracellular dynamics, and potential toxicity of G are expected to be significantly different when compared to those of 1D CNTs.16,17 Such studies would provide an insight into the interaction between physically diverse carbon nanostructures and various biological systems both in vitro and in vivo. Furthermore, the new nanomaterials that are being designed and considered for the systemic delivery applications essentially must be evaluated for their structure–activity and biocompatibility relationship even for the possible interactions with plasma proteins.18 Such studies will reflect more light on the biocompatibility profile, and the fate of the nanocarriers in circulation. Recently, we have reported the implications of enhanced cell interactions using 3D surfaces and magneto-dendritic nanoparticles enriched with transferrin as an interacting ligand for accounting cell morphology and capturing circulating tumor cells.19,20 Cellular delivery, tissue distribution and cytotoxicity studies of CNTs and G have directed their use as novel drug delivery nanosystems.1,4 Conjugation of G4 and PEG polymers may enhance the dispersion ability of CNTs and G. However, the enhanced solution properties of these materials may alter the cellular uptake kinetics and may further impart additional cytotoxicity.
In order to fill this knowledge gap, we have systematically investigated the effects of structure and surface composition of physically diverse carbon nanostructures, CNTs and G, on a series of cellular responses including their cellular uptake, internalization mechanisms, intracellular trafficking, and toxicity. To further understand the effect of structure along with surface composition we manipulated CNTs and G by conjugating with G4 and PEG (Fig. 1). To the best of our knowledge, this is the first study to address the cellular uptake and internalization fate for CNTs, G and their conjugates with PAMAM G4 dendrimers and PEG in an identical set of in vitro milieu, combined with a range of cytotoxicity studies. Furthermore, we investigated the difference in cellular internalization of CNTs, G and conjugated nanocomponents by a series of fluorescence-activated cell sorting (FACS) studies. We correlated the cellular internalization of these materials to rationalize the cellular uptake differences with their free forms.
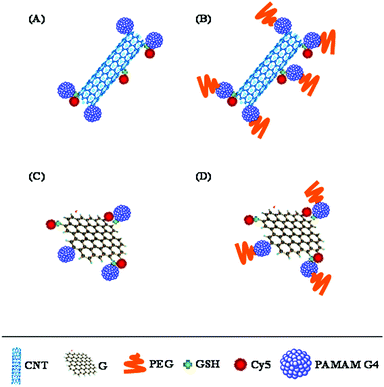 | ||
| Fig. 1 Schematic illustration of CNT–G4, CNT–G4–PEG, G–G4, and G–G4–PEG nanoparticles. | ||
Experimental
Materials
Graphene (SSA: 220 m2 g−1; thickness: 8–10 nm; diameter: 5–20 μm; purity: >99.5%) and CNTs (outer diameter of 10–20 nm; length 10–30 μm; and purity >95%) were procured from J. K. Impex, Mumbai (India). PAMAM-G4-NH2 (G4) 10 wt% in methanol (MW 14![[thin space (1/6-em)]](https://www.rsc.org/images/entities/char_2009.gif) 214.7 Da, 64 end groups), 1-ethyl-3-(3-dimethylaminopropyl) carbodiimide hydrochloride (EDC·HCl), N,N-diisopropyl ethylamine (DIEA), and sephadex G10 were purchased from Sigma-Aldrich (St Louis, MO). PEG NHS ester (MW 5000 Da) was purchased from Sunbright (UK). MCF-7 cells were procured from ATCC. Dulbecco modified Eagle's medium (DMEM), Roswell Park Memorial Institute medium (RPMI), fetal bovine serum (FBS), penicillin, and streptomycin were procured from Invitrogen. Ultrapure water obtained from a WaterPro water purification system (Labconco Corporation, Kansas City, MO) was used throughout. All other chemicals were of analytical grade and used without further purification.
214.7 Da, 64 end groups), 1-ethyl-3-(3-dimethylaminopropyl) carbodiimide hydrochloride (EDC·HCl), N,N-diisopropyl ethylamine (DIEA), and sephadex G10 were purchased from Sigma-Aldrich (St Louis, MO). PEG NHS ester (MW 5000 Da) was purchased from Sunbright (UK). MCF-7 cells were procured from ATCC. Dulbecco modified Eagle's medium (DMEM), Roswell Park Memorial Institute medium (RPMI), fetal bovine serum (FBS), penicillin, and streptomycin were procured from Invitrogen. Ultrapure water obtained from a WaterPro water purification system (Labconco Corporation, Kansas City, MO) was used throughout. All other chemicals were of analytical grade and used without further purification.
Functionalization of CNTs
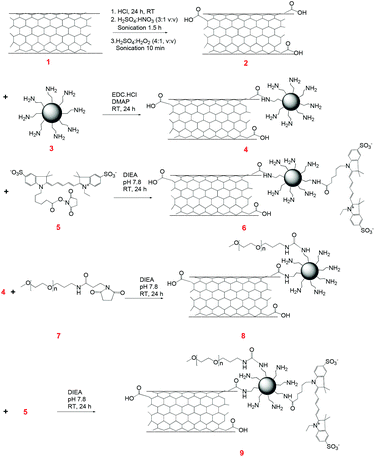
The purification and oxidation of CNTs were carried out using a modified literature procedure.21 CNT (5 mg) was added to a mixture of 35% HCl, sonicated for 2 h and then the solution was kept standing for 24 h at room temperature. The solution was diluted with deionized (DI) water and filtered. The HCl treated CNTs were then sonicated in 2 mL of 98% H2SO4–65% HNO3 (v![[thin space (1/6-em)]](https://www.rsc.org/images/entities/char_2009.gif) :
:![[thin space (1/6-em)]](https://www.rsc.org/images/entities/char_2009.gif) v 3
v 3![[thin space (1/6-em)]](https://www.rsc.org/images/entities/char_2009.gif) :
:![[thin space (1/6-em)]](https://www.rsc.org/images/entities/char_2009.gif) 1) for 1.5 h. The mixture was diluted with 25 mL of DI water and filtered. The treated CNTs were dried at room temperature and sonicated in a mixture of 98% H2SO4–H2O2 (v
1) for 1.5 h. The mixture was diluted with 25 mL of DI water and filtered. The treated CNTs were dried at room temperature and sonicated in a mixture of 98% H2SO4–H2O2 (v![[thin space (1/6-em)]](https://www.rsc.org/images/entities/char_2009.gif) :
:![[thin space (1/6-em)]](https://www.rsc.org/images/entities/char_2009.gif) v 4
v 4![[thin space (1/6-em)]](https://www.rsc.org/images/entities/char_2009.gif) :
:![[thin space (1/6-em)]](https://www.rsc.org/images/entities/char_2009.gif) 1) for 10 min and then kept standing for 2 h. After dilution with 25 mL of distilled water, the mixture was thoroughly washed with deionized water, filtered and dried under vacuum at room temperature. The amount of acidic sites generated on the CNTs by the titration method was determined to be ∼11%.21
1) for 10 min and then kept standing for 2 h. After dilution with 25 mL of distilled water, the mixture was thoroughly washed with deionized water, filtered and dried under vacuum at room temperature. The amount of acidic sites generated on the CNTs by the titration method was determined to be ∼11%.21
Preparation of graphene oxide (G)
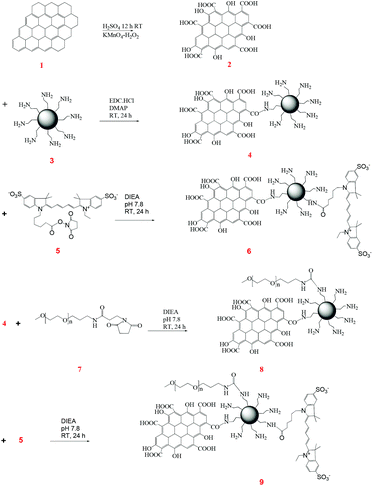
Oxidation of graphene was carried out by a modified Hummer's method.22,23 In a typical reaction, 10 mg of graphene was allowed to react with 5 mL of H2SO4 (98%) for 12 h at room temperature, followed by simultaneous cooling in an ice bath and addition of 60 mg of KMnO4. The reaction mixture was then stirred at 40 °C for 30 min and subsequently at 90 °C for 90 min. The reaction was then performed at an elevated temperature of 105 °C for 25 min and 500 μL of DI water was added. The reduction was completed with the addition of 1.4 mL of DI water and 100 μL of 30% H2O2. The activated graphene was washed repeatedly with HCl and DI water. The carboxylic groups generated by this treatment accounted for 130 mM g−1 of the graphene entity.Synthesis of CNT–G4
To synthesize the CNT–G4 conjugate, 1.0 mg of functionalized CNTs was sonicated in the presence of EDC·HCl at pH ∼ 6.0 for 30 min at room temperature. 8.0 mg of PAMAM–NH2 G4 was then added to the CNT solution. The reaction was continuously stirred for 24 h at room temperature on a magnetic stirrer. The modified CNTs were collected and washed with DI water by ultracentrifugation to remove unbound PAMAM–NH2 G4, then dried at room temperature to obtain CNT–G4. The yield of the CNT–G4 was ∼80%.Synthesis of CNT–G4–Cy5
To 1.0 mg of the CNT–G4 conjugate, 0.2 mg of Cy5 NHS dissolved in 0.1 mL of DI water was added in the presence of DIEA and the pH was maintained at 7.8. The reaction was carried out with continuous stirring for 24 h at room temperature. Further, the CNT–G4–Cy5 conjugate was collected and washed with DI water by ultracentrifugation to remove unbound Cy5. The yield of the product was ∼90%.Synthesis of CNT–G4–PEG
To synthesize the CNT–G4–PEG conjugate, 2 mg of CNT–G4 was added with 11.24 mg of methoxy PEG NHS in the presence of DIEA and the pH was maintained at 7.8. The solution was continuously stirred for 24 h at room temperature on a magnetic stirrer. The modified CNT–G4–PEG was collected and washed with DI water by ultracentrifugation to remove unbound PEG, then dried at room temperature to obtain CNT–G4–PEG. The yield of the product was ∼78%.Synthesis of CNT–G4–PEG–Cy5
To the above CNT–G4–PEG, 0.2 mg of Cy5 NHS dissolved in 0.1 mL of DI water was added in the presence of DIEA and the pH was maintained at 7.8. The reaction was continuously stirred for 24 h at room temperature on a magnetic stirrer. Further, the conjugate was collected and washed with DI water by ultracentrifugation to remove unbound Cy5. The yield of the product was ∼70%.Synthesis of G–G4
To synthesize the G–G4 conjugate, 1.0 mg of G was sonicated in the presence of EDC·HCl at pH ∼ 6.0 for 30 min at room temperature. 8 mg of PAMAM–NH2 G4 was then added to the G solution. The reaction was continuously stirred for 24 h at room temperature on a magnetic stirrer. The modified G was collected and washed with DI water by ultracentrifugation to remove unbound PAMAM–NH2 G4, then dried at room temperature to obtain G–G4. The yield of the product was ∼70%.Synthesis of G–G4–Cy5
To 1 mg of the G–G4 conjugate, 0.2 mg of Cy5 NHS dissolved in 0.1 mL of DI water was added in the presence of DIEA at pH 7.8. The reaction was carried out with continuous stirring for 24 h at room temperature. Further, the G–G4–Cy5 conjugate was collected and washed with DI water by ultracentrifugation to remove unbound Cy5. The yield of the product was ∼65%.Synthesis of CNT–G4–PEG
To synthesize the G–G4–PEG conjugate, 2 mg of G–G4 was added with 17.58 mg of methoxy PEG NHS in the presence of DIEA and the pH was maintained at 7.8. The solution was continuously stirred for 24 h at room temperature on a magnetic stirrer. The modified G–G4–PEG was collected and washed with DI water by ultracentrifugation to remove unbound PEG, then dried at room temperature to obtain G–G4–PEG. The yield of the product was ∼60%.Synthesis of G–G4–PEG–Cy5
To the above G–G4–PEG, 0.2 mg of Cy5 NHS dissolved in 0.1 mL of DI water was added in the presence of DIEA and the pH was maintained at 7.8. The reaction was continuously stirred for 24 h at room temperature on a magnetic stirrer. Further, the conjugate was collected and washed with DI water by ultracentrifugation to remove unbound Cy5. The yield of the product was ∼90%.Fluorescence study
Fluorescence spectra were acquired using a Perkin Elmer LS55 fluorescence spectrophotometer, USA. Emission spectra were recorded in phosphate buffered saline (PBS: 140 mM NaCl, 1.9 mM NaH2PO4, 8.1 mM Na2HPO4, pH 7.4) from 300 to 430 nm after excitation at 295 nm. Excitation and emission slits were set at 5 and 7.5 nm, respectively. BSA stock solution of 2.5 mM was freshly prepared by dissolving the albumin in 150 mM PBS. To ensure proper mixing and dispersion all the samples were stirred thoroughly by using a laboratory vortex shaker. The samples were then incubated for 60 min at 25 °C before measuring the fluorescence. All measurements were carried out at 25 °C. Increasing concentrations of the nanosystems were added to BSA from a stock solution and the fluorescence emission spectra of tryptophan residues were measured at different concentrations.Confocal microscopy
MCF-7 cells were cultured in RPMI-1640, respectively, supplemented with 10% FBS and 100 units per mL penicillin, 100 μg mL−1 streptomycin. MCF-7 cells were plated at 2 × 10⁵ mL−1 on cover slips in 35 mm culture dishes. After 24 h, cells were treated with 100 μg mL−1 of the multicomponent system in a time dependent manner (2 h, 6 h and 24 h). Cover slips were removed after consecutive time points and processed for confocal microscopy. Cells were fixed with 2.0% paraformaldehyde for 15 min at room temperature followed by permeabilization with 0.1% Triton X-100 in phosphate buffered saline (PBS) for 5 min. Cells were then washed three times in PBS and cover slips were mounted in ultracruz mounting media with 4′-6-diamidino-2-phenylindole (DAPI) (Santa Cruz) and examined under confocal laser microscope (LSM 510 version 2.01; Zeiss, Thornwood, NY).Flow cytometry assay
MCF-7 breast cancer cells and H460 human lung cancer cells were seeded at a density of 50![[thin space (1/6-em)]](https://www.rsc.org/images/entities/char_2009.gif) 000 cells per well per 2 mL of RPMI medium with 10% FCS in a 6 well plate. Following incubation at 37 °C/5% CO2 for a period of 24 h, the cells were treated with a 10 μg mL−1 concentration of the compounds for 4, 8, 16, 24 and 48 h. At the end of treatment, cells were harvested by trypsinization, washed two times with PBS and acquired by flow cytometry. Parameters FL4 AND FL2 were analysed by cell quest Pro software.
000 cells per well per 2 mL of RPMI medium with 10% FCS in a 6 well plate. Following incubation at 37 °C/5% CO2 for a period of 24 h, the cells were treated with a 10 μg mL−1 concentration of the compounds for 4, 8, 16, 24 and 48 h. At the end of treatment, cells were harvested by trypsinization, washed two times with PBS and acquired by flow cytometry. Parameters FL4 AND FL2 were analysed by cell quest Pro software.
Cell viability assay
MCF-7 breast cancer cells and H460 human lung cancer cells were cultured in RPMI supplemented with 10% FBS and 100 units per mL penicillin, 100 μg mL−1 streptomycin. The cytotoxic activity of compounds was quantitatively determined by a fluorimetric assay utilizing propidium iodide (PI), as described previously. Briefly, cells were seeded at 3000 cells per well in 96-well plates and maintained in culture for 24 h at 37 °C in RPMI supplemented with 10% FBS. The compounds for toxicity were added in varying concentrations (1–10 μg mL−1) and incubated for 72 h, following which PI termination was done. Cells were washed with PBS and PI was added (7 μg mL−1) to each well. Cells were subjected to freeze–thaw cycles at −70 °C following which the fluorescence was measured at Ex 536 and Em 590 using a POLARstar optima plate reader. Background readings (blank) were obtained from cell-free wells containing media and PI.Percentage viability was calculated as:
| (A × 100)/C |
Characterization
Transmission electron microscopy (TEM) analysis was carried out using a HITACHI (Model no. 7600, Japan) set at an accelerating voltage of 125 kV. The samples were obtained by placing a drop of the suspensions in DI water onto a Formvar-covered copper grid and evaporated in air at room temperature. The hydrodynamic diameter was measured by dynamic light scattering using a Malvern Autosizer 4700/PCS100 spectrometer equipped with an Ar ion laser operating at 488 nm.X-Ray diffraction (XRD) analyses were performed using a Bruker AXS A8 (Germany) X-ray diffractometer with Cu-Kα radiation (1.5405 Å). The Zeta potential was measured using a Beckman coulter (Delsa Nano C, USA) instrument and 0.01 M phosphate buffers at pH 7.4. Solutions of the CNT and G nanosystems were freshly prepared by dissolving an appropriate amount of sample in buffer solution. The sample solutions were then stirred thoroughly to ensure proper mixing of the samples. Zeta potential was measured by applying an electric field across the solutions using the technique of laser Doppler anemometry. Each sample was measured three times, combining 64 runs per measurement. All measurements were carried out at 25 °C.
Statistical analysis
The statistical significance of differences between control groups and experimental results was determined using a student's t-test. P values <0.05 were considered significant, and significant differences are shown by asterisks in the figures.Results and discussion
Preparation and characterization of CNT and G conjugates
The structural differences at the molecular level (1D vs. 2D) of CNTs and G are varied, and, therefore, we hypothesized that they would exhibit differences in their protein interactions, as well as cellular internalization profiles. Furthermore, as a matter of architectural difference, it will be interesting to note the concentration dependent cell viability. The structural complexity of these materials was further added to by conjugating with PAMAM dendrimers and PEG polymers (Fig. 2 and 3).CNT–G4–Cy5 and CNT–G4–PEG–Cy5 were synthesized from carboxylated CNT (CNT–COOH). Oxidation treatment, an effective approach to eliminate the contaminants and concomitantly generate abundant carboxylic groups at the defect sites of CNTs to result in CNT–COOH, was adopted as the primary step.21 After that, PAMAM G4 dendrimers (64 amine groups per dendrimer molecule) were conjugated through amide linkage by EDC coupling method to yield CNT–G4. Dendrimers are known to form stable, dense, well-organized, and close-packed arrays on the substrate surface, and can significantly improve the dispersibility of CNT and other materials.4 They also provide useful reactive groups for further functionalization. Next, CNT–G4–PEG was synthesized by treating CNT–G4 with the NHS ester of PEG, which is known to make the nanosystem biocompatible and dispersible in aqueous media, at pH 7.8. To impart fluorescence imaging capability, Cy5 was covalently bonded with the excess amine groups of G4 present on CNT–G4–PEG by co-condensation reaction to form the CNT–G4–PEG–Cy5 conjugate. Similarly, Cy5 was conjugated to CNT–G4 to yield CNT–G4–Cy5. At every step, the CNT based reactants were isolated by centrifugation, thereby eliminating unreacted G4, PEG, and Cy5.
On the other hand, G–G4–Cy5 was synthesized by conjugating PAMAM G4 dendrimers to G with surface carboxyl groups via amide formation using the excess terminal amine groups present on PAMAM G4 (Fig. 3). G–G4–PEG was synthesized by conjugating G–G4 with PEG through the NHS ester group to yield the multicomponent system. Further, Cy5 was covalently bonded with excess amine groups of G4 present on G–G4 and G–G4–PEG by co-condensation reaction to form the G–G4–Cy5 and G–G4–PEG–Cy5 conjugates.
CNT and G nanosystems were evaluated to determine their physicochemical properties. The structures of CNT, G and G–G4 (representative figure) were investigated by TEM. Fig. 4A shows the average diameter of CNT to be ∼8 nm, while the TEM image of G (Fig. 4B) shows overlaid side-by-side sheets, varying between 100 and 110 nm in diameter. The TEM image of G–G4–Cy5 (Fig. 4C) did not show any major change compared to G revealing that the conjugation of G4 and Cy5 did not result in agglomeration or degradation of the G. The content of G4 was not analyzed, due to unsuitable method in the literature. Analysis by dynamic light scattering (DLS) showed that the average diameters of CNT, G, CNT–G4–Cy5, G–G4–Cy5, CNT–G4–PEG–Cy5 and G–G4–PEG–Cy5 in water were 146, 296, 296, 336, 327 and 398 nm (Fig. 5A). Because most of the CNT and G-based materials are not spherical particles, the model derived diameters are not their real sizes. DLS results only show size differences among the four materials. It revealed that the size of CNTs and G increased on conjugating with G4, PEG and Cy5. The increase in the size was in the order of G–G4–PEG–Cy5 > G–G4–Cy5 > G > CNT–G4–Cy5 > CNT–G4 > CNT.
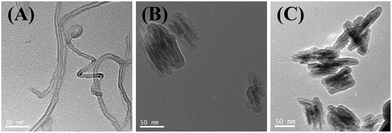 | ||
| Fig. 4 TEM images of oxidized (A) CNTs, (B) graphene and (C) G–G4–Cy5. | ||
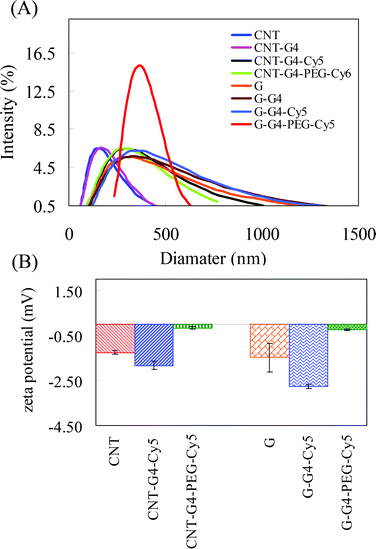 | ||
| Fig. 5 (A) Hydrodynamic size distribution and (B) zeta potential measurements performed for CNT and G nanosystems. | ||
Besides the sample's morphologies, their zeta potentials were measured in PBS of pH 7.4 at room temperature. The zeta potential is a measure of electrostatic interactions between colloidal particles and has been used in the literature to investigate the surface charge and the stability of colloidal nanoparticles. Herein, CNTs, G and their conjugates were investigated to account for the effect of conjugation on surface charge. Fig. 5B shows that in both CNTs and G the zeta potential is negative i.e. −1.26 ± 0.09, and −1.48 ± 0.063 mV, respectively. However, on conjugation with G4 and PEG the zeta potential values of the nanomaterials changed to −1.84 ± 0.18, −2.77 ± 0.10, −0.17 ± 0.04 and −0.26 ± 0.04 mV for CNT–G4–Cy5, G–G4–Cy5, CNT–G4–PEG–Cy5 and G–G4–PEG–Cy5, respectively. The results showed that the zeta potential of CNT–G4–PEG–Cy5 is less negative than that of CNTs and CNT–G4–Cy5. Similarly, in the case of G and G conjugates the zeta potential of G–G4–PEG–Cy5 is less negative than that of G and G–G4–Cy5. The change in zeta potential of the CNT and G conjugates compared to CNT and G confirms the conjugation. Passivation molecules such as PEG are neutral.24 Also, the NH2 groups of G4 were utilized during conjugation of PEG. Hence, the PEG conjugated nanosystems showed a lower zeta potential compared to other CNT and G nanosystems.
Protein binding studies using functionalized CNTs and G
The nanoparticle–protein association and dissociation, and concurrent exchange with free proteins in the media, play an important role in determining the particle's interactions with biological surfaces and hence its fate. Bovine serum albumin (BSA) fluorescence quenching assay is widely used to study the protein interactions with small ligand molecules.25–27 The affinity of drugs with plasma proteins is a very well known process, which directly influences the pharmacokinetics of the drug in blood.28 On the other hand, the role of PEG and other delivery nanocomponents with surface modifications can provide “stealth” characteristics to nanomaterials.29 Hence, a key question, which is a subject of intensive research currently, is whether protein interactions for carbon allotropes and its modified carriers depends on the nature of particles such as size, charge, shape, coatings that exert steric or electrosteric effects.To study the interactions of CNT and G nanosystems with protein in vitro, BSA was considered as a suitable protein candidate as it is found in abundance in plasma and due to its complimentary structural similarity with human serum albumin.25,26,30 A BSA fluorescence quenching assay system was used to investigate the protein interaction with CNT and G4 and also the effect of G4 and PEG functionalization. BSA exhibits a characteristic emission spectrum of the tryptophan fluorophore. For CNT and G and their conjugates with BSA, changes in the intensity of the emission spectra of BSA upon addition of CNT and G nanosystems were determined. The effect of CNT and G nanosystems on BSA fluorescence intensity is depicted in Fig. 6. When different amounts of CNT and G were added to a fixed concentration of BSA, a significant decrease in the fluorescence intensity of BSA was observed, indicating a strong interaction between BSA and CNT or G. In contrast, the decrease in fluorescence intensity for the CNT and G conjugates suggested a much weaker binding interaction to BSA.
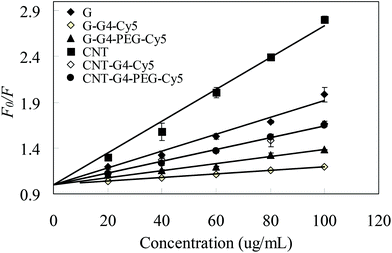 | ||
| Fig. 6 Stern–Volmer curves of F0/F vs. concentration of CNT and G nanosystems at different temperatures. The concentration of BSA was 2.5 μM. | ||
As is evident from Fig. S1,† the distinct decrease in the fluorescence intensity upon addition of CNT and G nanosystems can be employed in studying their interaction with BSA. In order to gain a further insight into the binding affinity, fluorescence quenching data were analyzed by the Stern–Volmer equation:20,31–33
| F0/F = 1 + kqτ0[Q] = 1 + Ksv[Q] | (1) |
The quenching process was considered to be diffusion controlled with a distinct peak maximum at around 340 nm in buffered aqueous solution. As the quenching process is diffusion controlled and completely dynamic, one can calculate the individual bimolecular quenching constants, kq, by taking the ratio of Ksv and τ0. For BSA, the excited state lifetime of the fluorophore is ∼5 ns.34 The kq values determined for CNT, CNT–G4–Cy5, CNT–G4–PEG–Cy5, G, G–G4–Cy5, and G–G4–PEG–Cy5 were 3.24 × 10⁹, 1.28 × 10⁹, 1.28 × 10⁹, 1.84 × 10⁹, 0.38 × 10⁹ and 0.76 × 10⁹ L g−1 s−1, respectively. The maximum kq value of BSA for diffusion-limited quenching (dynamic mechanism) possible in water is ∼1.5−5 M−1 L g−1 s−1.35 The kq values determined were larger than the limiting diffusion rate constant of the albumin molecule. A higher kq value reveals that static quenching may be present in the system. However, it is difficult to state whether the fluorescence quenching of the tryptophan fluorophore by the nanosystems is predominantly static or dynamic in nature. Earlier, we reported the influence of surface functionalities and zeta potential by fluorescence quenching studies to address the binding interactions of dendritic polyglycerols (dPG) and other delivery polymers with BSA in order to explore the applicability of dPG derivatives for systemic delivery.20 In general, the interaction of nanocarriers with plasma proteins are highly associated as either +ve type or −ve type and with the total surface charge. Furthermore, the high protein interactions are associated with the change in the physical nature and conformation of the protein and may result in extended pharmacokinetics of these nanomaterials.20 The correlation of such protein interactions either as dynamic or static (or mixed), may be implicated in reversible or irreversible plasma protein binding.
As revealed from the fluorescence measurements, the effect of CNT and G nanosystems on the quenching of tryptophan was clearly ranked in the order CNT–G4–PEG–Cy5 > G–G4–Cy5 > G–G4–PEG–Cy5. Our spectroscopic results, therefore, imply that the interaction of the negatively charged BSA with CNT and G nanosystems is mainly due to electrostatic interactions.
Cellular uptake of functionalized CNTs and G
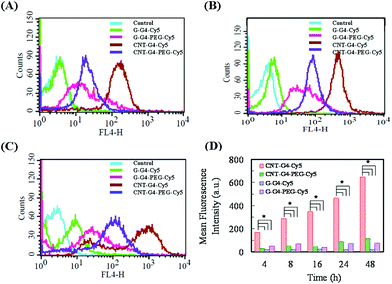
To demonstrate the relevance of the size and surface of the CNTs/G with cells, we performed cellular internalization experiments using the MCF-7 cell line, all of which were performed under identical conditions for all nanomaterials. Staining using a near infrared fluorescence probe, Cy5, was applied to investigate the internalization of the nanomaterials in cells using confocal laser scanning microscopy (CLSM) and FACS.The cellular internalization kinetics of CNTs, G and their conjugates were followed for 2–24 h. The cellular association of CNT and G conjugates were found to be time dependent, with red fluorescence due to Cy5 being detectable in the cells as soon as after 2 h of incubation at 37 °C (Fig. 7). During the first 6 h, these particles were observed in the cytoplasm (Fig. 8). However, at 24 h (Fig. 9), a higher amount of CNT and G nanosystems were observed in the cells compared to 6 h. The cellular internalization of the nanosystems was also confirmed by Z-stack imaging (Fig. S2 of CNT–G4–PEG–Cy5 in ESI†) of MCF-7 cells. To further understand the cell internalization kinetics of the CNT and G conjugates, the extent of cellular uptake of the various conjugates was quantified by determining the fluorescence of Cy5 from the treated MCF-7 and H460 cells using flow cytometry. The cellular internalization kinetics were followed for 4, 8, 16, 24 and 48 h (Fig. 10 and S3†). Both CNT and G conjugates were internalized in the cells within 4 h of treatment, which correlates well with the CLSM study. All the cells were found to be stained within 4 h of treatment. The median fluorescence intensity (MFI) for these nanoparticles was in the order CNT–G4–Cy5 > CNT–G4–PEG–Cy5 > G–G4–Cy5 > G–G4–PEG–Cy5 for all the time points (Fig. 10D). This observation shows that the CNT conjugates were internalized more than the G conjugates. This can be explained on the basis of the physical properties of CNT and G conjugate nanosystems. While the cellular uptake is influenced by the size, more recent studies have also demonstrated the significant impact of shape on the cell dynamics.36–38 The rate and the intracellular fate of the nanosystems uptake by cells depends on factors such as charge and structure. CNT, due to the “snaking” effects, because of their tubular shape, promotes penetration of membranes, uptake by cells, and strong interactions with various protein systems.8 Hence, a higher uptake of CNT conjugates compared to G conjugates are observed over time. This is an important observation and underlines the implications of the shape of nanoparticles in modulating biological phenotype.
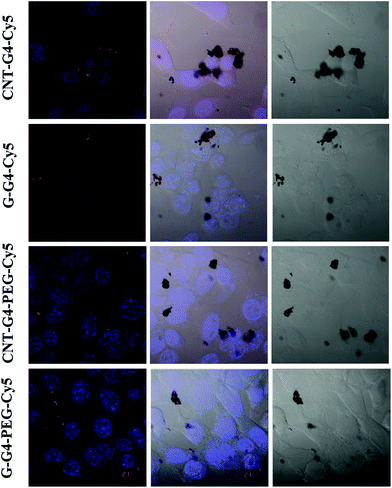 | ||
| Fig. 7 Confocal laser scanning microscopic images of MCF-7 cells incubated with CNT–G4, CNT–G4–PEG, G–G4, and G–G4–PEG nanoparticles for 2 h. (A) Left: merged images of the nuclei stained with blue DAPI and Cy5 conjugated CNT–G4, CNT–G4–PEG, G–G4, and G–G4–PEG nanoparticles. Middle: merged images of the nuclei stained with blue DAPI, Cy5 conjugated CNT–G4, CNT–G4–PEG, G–G4, and G–G4–PEG nanoparticles and differential interference contrast (DIC). Right: differential interference contrast (DIC) images. | ||
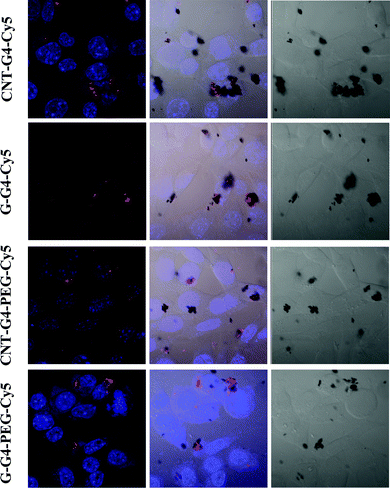 | ||
| Fig. 8 Confocal laser scanning microscopic images of MCF-7 cells incubated with CNT–G4, CNT–G4–PEG, G–G4, and G–G4–PEG nanoparticles for 6 h. (A) Left: merged images of the nuclei stained with blue DAPI and Cy5 conjugated CNT–G4, CNT–G4–PEG, G–G4, and G–G4–PEG nanoparticles. Middle: merged images of the nuclei stained with blue DAPI, Cy5 conjugated CNT–G4, CNT–G4–PEG, G–G4, and G–G4–PEG nanoparticles and differential interference contrast (DIC). Right: differential interference contrast (DIC) images. | ||
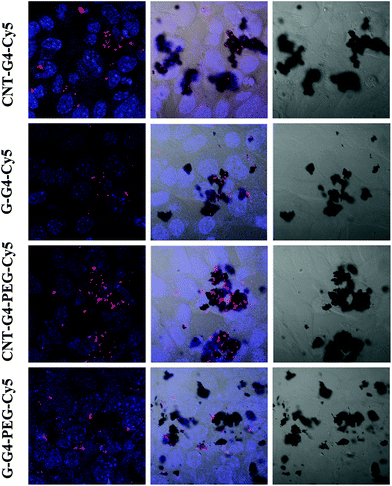 | ||
| Fig. 9 Confocal laser scanning microscopic images of MCF-7 cells incubated with CNT–G4, CNT–G4–PEG, G–G4, and G–G4–PEG nanoparticles for 24 h. (A) Left: merged images of the nuclei stained with blue DAPI and Cy5 conjugated CNT–G4, CNT–G4–PEG, G–G4, and G–G4–PEG nanoparticles. Middle: merged images of the nuclei stained with blue DAPI, Cy5 conjugated CNT–G4, CNT–G4–PEG, G–G4, and G–G4–PEG nanoparticles and differential interference contrast (DIC). Right: differential interference contrast (DIC) images. | ||
Furthermore, the results also revealed that CNT–G4–PEG–Cy5 internalized less compared to the CNT–G4–Cy5 conjugate, as seen in Fig. 10. This observation can be explained on the basis of the electrostatic force between the nanosystem and the cell surface. Since CNT–G4–PEG–Cy5 has a higher negative surface charge (Fig. 5), it encounters strong electrostatic repulsions with the cell wall. Hence, less internalization of CNT–G4–PEG–Cy5 was observed compared to CNT–G4–Cy5. On the other hand, G–G4–PEG–Cy5 was internalized more because it has less negative charge than G–G4–Cy5. This observation reinforces that, along with structure, the charge of the conjugate is crucial for cell uptake.
The cellular internalization for the CNT and G nanoconjugates was found to be at a maximum at 24 h as evident from Fig. 10 and S3.† The number of positively labeled cells were represented as the percentage of total cell counts in Fig. 10. More than 90% of the cells were positively labeled at 24 h for CNT and G conjugates except for G–G4–Cy5 (Fig. S4†). Similar results were also seen for H460 cells (Fig. S5†).
Cytotoxicity characterization
Few studies have addressed the biological relevance and the toxicity of functionalized CNT and G nanoparticles. The cytotoxicity of CNTs, G and their conjugates were measured and compared by propidium iodide assay, a common method of evaluating the adverse effect of nanomaterials in cell culture. The studies were focused on understanding the shape and charge effect of these nanomaterials on their corresponding cellular cytotoxicity. After 72 h, the cellular activity of MCF-7 cells decreased in a concentration dependent manner on exposure to either graphene or CNT conjugates (Fig. 11). We found that the concentration-dependent toxicity of these two nanomaterials and their conjugates did not present a similar pattern, indicating a different toxic mechanism even though they are of relatively identical chemical structure. The results indicate that CNTs and G induce a similar toxic response. Our results are consistent with a recent study on the effects of CNTs and G on biological systems, which found that both G and CNT induce cytotoxic effects, and that these effects are concentration, shape and surface charge dependent.38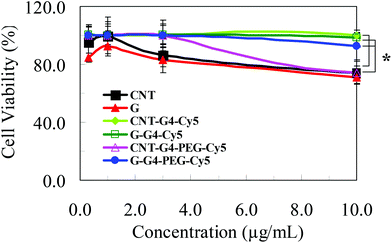 | ||
| Fig. 11 Results of the PI (propidium iodide) cytotoxicity assay on MCF-7 breast cancer cells after an incubation period of 72 h with various samples of CNT at concentrations ranging from 0–10 μg mL−1; *P < 0.05. | ||
Interestingly, the CNT and G conjugates exhibited less cytotoxicity pattern than that exhibited by CNT and G. These toxicity findings can be elucidated by the structure of these nanomaterials and their biological interaction with the cellular systems. As previously discussed, CNTs promote the rapid penetration of membranes, uptake by cells, and strong interactions with various protein systems due to the “snaking” effects.8 The G nanostructures, due to their flat shapes, have stronger interaction with the cellular membrane thus enabling higher cell internalization.38 However, by conjugating other nanocomponents to CNT and G, the cellular internalization differed. Although CNT and G conjugates have a core with same chemical formula i.e. CNT and G, they differ only in hydrodynamic size and Z-potential values. Hence, the difference in the cell entrance pattern can be mainly attributed to structure and surface composition of the functionalized CNT and G. Similar results were also seen for H460 cells (Fig. S6†).
Conclusions
In this study the cellular responses of CNT and G nanoconjugates were systematically investigated to help fill an essential knowledge gap for developing CNT and G nanoconjugates in bio-applications. The extensive study on interactions and insights with plasma proteins highlighted the associated changes by fluorescence quenching. The fluorescence quenching was found to be highest for CNT–G4–PEG–Cy5 and least for G–G4–PEG–Cy5. Our cellular kinetic study showed higher uptakes of G conjugates compared to CNT conjugates. The cytotoxicity results indicated that at low concentrations, G induced a more intense toxic response than the CNTs. However, at higher concentration, the induced cytotoxic effects reversed with G showing a lower activity. Interestingly, the CNT and G conjugates exhibited a reverse cytotoxic pattern compared to the unconjugated CNTs and G. Furthermore, in the case of the conjugates, the cellular distribution differed. Altogether, our study has clearly demonstrated that the shape and surface composition of carbon nanomaterials plays an extremely important role in the way they interact with cells and potentially other biological systems, such as tissues and organisms.Acknowledgements
Authors would like to thank Atul Lohade for zeta potential measurement and Piramal Life Science Ltd. for providing financial support.Notes and references
- A. Hirsch, Nat. Mater., 2010, 9, 868 CrossRef CAS PubMed.
- Z. Liu, J. T. Robinson, X. Sun and H. Dai, J. Am. Chem. Soc., 2008, 130, 10876 CrossRef CAS PubMed.
- J. J. Khandare, A. Jalota-Badhwar, S. D. Satavalekar, S. G. Bhansali, N. D. Aher, F. Kharas and S. S. Banerjee, Nanoscale, 2012, 4, 837 RSC.
- P. S. Wate, S. S. Banerjee, A. Jalota-Badhwar, R. Mascarenhas, K. Zope, J. Khandare and R. D. K. Misra, Nanotechnology, 2012, 23, 415101 CrossRef PubMed.
- F. Lu, L. Gu, M. J. Meziani, X. Wang, P. G. Luo, L. M. Veca, L. Cao and Y.-P. Sun, Adv. Mater., 2009, 21, 139 CrossRef CAS.
- S. Dhar, Z. Liu, J. Thomale, H. Dai and S. J. Lippard, J. Am. Chem. Soc., 2008, 130, 11467 CrossRef CAS PubMed.
- A. A. Bhirde, V. Patel, J. Gavard, G. Zhang, A. A. Sousa, A. Masedunskas, R. D. Leapman, R. Weigert, J. S. Gutkind and J. F. Rusling, ACS Nano, 2009, 3, 307 CrossRef CAS PubMed.
- Z. Liu, X. Li, S. M. Tabakman, K. Jiang, S. Fan and H. Dai, J. Am. Chem. Soc., 2008, 130, 13540 CrossRef CAS PubMed.
- A. Balandin, S. Ghosh, W. Bao, I. Calizo, D. Teweldebrhan, F. Miao and C. N. Lau, Nano Lett., 2008, 8, 902 CrossRef CAS PubMed.
- B. Tian, C. Wang, S. Zhang, L. Feng and Z. Liu, ACS Nano, 2011, 5, 7000 CrossRef CAS PubMed.
- F. Wang, Y. Zhang, C. Tian, C. Girit, A. Zettl, M. Crommie and Y. R. Shen, Science, 2008, 320, 206 CrossRef CAS PubMed.
- L. Feng, S. Zhang and Z. Liu, Nanoscale, 2011, 3, 1252 RSC.
- H. Bao, Y. Pan, Y. Ping, N. G. Sahoo, T. Wu, L. Li, J. Li and L. H. Gan, Small, 2011, 7, 1569 CrossRef CAS PubMed.
- L. Xin, H. Yi, L. Zhibo, T. Jianguo, W. Yan, M. Yanfeng, L. Jiajie, F. Shipeng, W. Xiangjian and C. Yongsheng, Small, 2009, 5, 1682 CrossRef PubMed.
- L. Zhang, J. Xia, Q. Zhao, L. Liu and Z. Zhang, Small, 2010, 6, 537 CrossRef CAS PubMed.
- C. Peng, W. Hu, Y. Zhou, C. Fan and Q. Huang, Small, 2010, 6, 1686 CrossRef CAS PubMed.
- V. L. Colvin, Nat. Biotechnol., 2003, 21, 1166 CrossRef CAS PubMed.
- J. Khandare, A. Mohr, M. Calderón, P. Welker, K. Licha and R. Haag, Biomaterials, 2010, 31, 4268 CrossRef CAS PubMed.
- S. S. Banerjee, A. Jalota-Badhwar, S. D. Satavalekar, N. D. Aher, S. G. Bhansali and J. J. Khandare, Adv. Healthcare Mater., 2013, 2, 800 CrossRef CAS PubMed.
- S. S. Banerjee, D. Paul, S. G. Bhansali, N. D. Aher, A. Jalota-Badhwar and J. Khandare, Small, 2012, 8, 1657 CrossRef CAS PubMed.
- F. Forohar, C. Whitaker and W. M. Koppes, US Patent 7807127B1, 2010 Search PubMed.
- X. Yang, X. Zhang, Z. Liu, Y. Ma, Y. Huang and Y. Chen, J. Phys. Chem. C, 2008, 112, 17554 CAS.
- Z. Liu, J. T. Robinson, X. Sun and H. Dai, J. Am. Chem. Soc., 2008, 130, 10876 CrossRef CAS PubMed.
- M. Moros, B. Hernáez, E. Garet, J. T. Dias, B. Sáez, V. Grazú, Á. González-Fernández, C. Alonso and J. M. de la Fuente, ACS Nano, 2012, 6, 1565 CrossRef CAS PubMed.
- U. Kragh-Hansen, Pharmacol. Rev., 1981, 33, 17 CAS.
- D. C. Carter and J. X. Ho, Adv. Protein Chem., 1994, 45, 153 CrossRef CAS PubMed.
- O. K. Abou-Zied and O. I. K. Al-Shihi, J. Am. Chem. Soc., 2008, 130, 10793 CrossRef CAS PubMed.
- X. Liu, C. An, P. Jin, X. Liu and L. Wang, Biomaterials, 2013, 34, 817 CrossRef CAS PubMed.
- A. S. Karakoti, S. Das, S. Thevuthasan and S. Seal, Angew. Chem., Int. Ed., 2011, 50, 1980 CrossRef CAS PubMed.
- X. M. He and D. C. Carter, Nature, 1992, 358, 209 CrossRef CAS PubMed.
- O. Stern and M. Volmer, Über die Abklingzeit der Fluoreszenz, Phys. Z, 1919, 20, 183 CAS.
- M. J. Eftink, Fluorescence quenching reactions: probing biological macromolecular structures, ed. T. G. Dewey, Biophysical and biochemical aspects of fluorescence spectroscopy, Plenum Press, New York, 1991, p. 1 Search PubMed.
- J. R. Lakowicz, Principles of fluorescence spectroscopy, Kluwer Academic/Plenum Publishers, New York, 2nd edn, 1999 Search PubMed.
- L. Giehm, C. Christensen, U. Boas, P. M. H. Heegaard and D. E. Otzen, Biopolymers, 2008, 89, 522 CrossRef CAS PubMed.
- Y. Geng, P. Dalhaimer, S. Cai, R. Tsai, M. Tewari, T. Minko and D. E. Discher, Nat. Nanotechnol., 2007, 2, 249 CrossRef CAS PubMed.
- J. A. Champion, Y. K. Katare and S. Mitragotri, J. Controlled Release, 2007, 121, 3 CrossRef CAS PubMed.
- S. Mitragotri and J. Lahann, Nat. Mater., 2009, 8, 15 CrossRef CAS PubMed.
- Y. Zhang, S. F. Ali, E. Dervishi, Y. Xu, Z. Li, D. Casciano and A. S. Biris, ACS Nano, 2010, 4, 3181 CrossRef CAS PubMed.
Footnotes |
| † Electronic supplementary information (ESI) available. See DOI: 10.1039/c3bm60082c |
| ‡ Present address: Maharashtra Institute of Pharmacy MIT Campus, Paud Road, Kothrud, Pune-411038, India. |
| This journal is © The Royal Society of Chemistry 2014 |

