 Open Access Article
Creative Commons Attribution 3.0 Unported Licence
A novel method for monitoring mineralisation in hydrogels at the engineered hard–soft tissue interface†
Susanne
Koburger
ab,
Alistair
Bannerman
ac,
Liam M.
Grover
a,
Frank A.
Müller
b,
James
Bowen
a and
Jennifer Z.
Paxton
*a
aSchool of Chemical Engineering, University of Birmingham, Edgbaston, Birmingham B15 2TT, UK. E-mail: jzpaxton.research@gmail.com
bInstitute of Materials Science and Technology (IMT), Friedrich-Schiller-University of Jena, Löbdergraben 32, D-07743 Jena, Germany
cCentre for Physical Sciences of Imaging in the Biomedical Sciences (PSIBS), School of Chemistry, University of Birmingham, Edgbaston, Birmingham B15 2TT, UK
First published on 8th October 2013
Abstract
The capacity to study the deposition of mineral within a hydrogel structure is of significant interest to a range of therapies that seek to replace the hard tissues and the hard–soft tissue interface. Here, a method is presented that utilises Confocal Raman microscopy as a tool for monitoring mineralisation within hydrogels. Synthetic hard–soft material interfaces were fabricated by apposing brushite (a sparingly soluble calcium phosphate) and biopolymer gel monoliths. The resulting structures were matured over a period of 28 days in phosphate buffered saline. Confocal Raman microscopy of the interfacial region showed the appearance of calcium phosphate salt deposits away from the original interface within the biopolymeric structures. Furthermore, the appearance of octacalcium phosphate and carbonated hydroxyapatite was observed in the region of the brushite cement opposing the biopolymer gel. This study describes not only a method for analysing these composite structures, but also suggests a method for recapitulating the graduated tissue structures that are often found in vivo.
Introduction
Interfacial tissue engineering aims to regenerate the intricate structure of musculoskeletal interfaces.1 These interfaces possess complex matrix heterogeneity2 and their specific arrangement has evolved to assist force transmission through tissues with very different mechanical properties. For example, at the junction between the soft tissue sinews tendon/ligament and bone (the osteotendinous junction), the interface is comprised of four interconnected regions, namely the tendon/ligament proper, unmineralised fibrocartilage, mineralised fibrocartilage and bone.3–5 Similarly, the junction between bone and cartilage (the osteochondral junction) has a multiphasic structure, with 5 different regions; bone, mineralised cartilage, and deep, middle and superficial layers of cartilage.6,7 In both tissue transitions, the gradient of mineralisation, along with changes in cell type, matrix composition and collagen fibre alignment, affects the mechanical properties across the soft to hard tissue transition.6–8 In fact, a study on the ligament to bone interface identified that mineralisation was a key regulator in determining the compressive modulus of the tissue across the soft to hard tissue junction9 and therefore demonstrates an important structure–function relationship at the attachment points of dissimilar tissues.There are several different approaches to engineering graded tissue transitions in vitro. Some groups have focussed on the manufacture of bi- or multiphasic plugs, by layering different materials and cell types together and designed to be implanted with native tissue at the bone-tendon10–12 or bone-cartilage7,13–17 interfaces. A vast array of both natural and synthetic materials have been utilised to mimic the hard and soft tissue regions (for reviews see ref. 7 and 8) but these typically involve the use of a form of calcium phosphate for the bone region and a hydrogel for the soft tissue region. Two commercial osteochondral scaffolds are available; TruFit® Bone Graft Substitute (BGS) resorbable porous plugs (Smith & Nephew) and Osseofit® (Kensey Nash).18 Both these biphasic plugs are bioresorbable and have a bone and cartilage-mimicking region. The TruFit® BGS has a chondral region manufactured from polyglycolic acid and a bone region consisting of porous poly-D,L-lactide-co-glycolide (PGLA) and calcium sulphate whereas the Osseofit® consists of a type I collagen chondral region and a porous tricalcium phosphate–polylactic acid mix underneath.18 Despite their use in the repair of damaged cartilage, it is unknown whether mineral deposition across the bone-cartilage region occurs in a graded fashion. In the case of osteotendinous junction regeneration, rather than the manufacture of an isolated plug, others have utilised cellular co-culture to create whole tissue constructs with an intact interfacial region.19,20 Similar to this approach, we have reported the creation of a whole bone-ligament-bone construct from a cell-seeded hydrogel and artificial bone blocks manufactured from a bioresorbable calcium phosphate cement.21–23 While an intact interface can be produced in vitro,21,22 the processes governing interface formation in the system are not well understood.
Although the importance of recapitulating the hard–soft tissue interface is widely recognised and a number of the above implants have found clinical application, little is currently known of how these materials are structured on a nanoscopic level and how this structuring changes with time. The principal reason for this is that imaging material interfaces in composites formed from hard materials and soft hydrated materials is challenging. The difficulty encountered in imaging is as a result of the different approaches taken to histologically process mineralised and non-mineralised tissues – the former usually requiring dehydration and the latter demineralisation. Clearly, these processing steps result in disruption of the apposing phase. This is particularly challenging when the mineral component formed within the gel is nanoscopic in nature.
Several methods have been used to visualise mineralisation in hydrogel scaffolds, with many recent studies reporting the use of techniques such as Fourier Transform Infrared spectroscopy (FTIR),24–26 scanning electron microscopy (SEM),24–28 Energy-dispersive X-ray spectroscopy (EDS),25–27 high resolution spectral ultrasound imaging (SUSI)29 and the staining technique of von Kossa.25–27,29,30 These studies have enhanced our understanding the structure of interfaces, however, each method requires a special means of characterisation or is more sensitive to one or other of the phases, meaning that the information on the whole structure is difficult to determine.
Confocal Raman microscopy (CRM) is a technique that provides information about the vibrational properties of chemical bonds within a sample, and therefore allows the presence of a certain molecular bond to be ascertained. CRM has several advantages over the techniques describes above, such as the ability to observe both hard and soft structures easily. Furthermore, since CRM does not require the fixation or staining of samples, preparation time and complications arising from processing are reduced. Raman microscopy has been used previously to identify deterioration in the quality of native bone, by studying the ratio of the phosphate peaks (PO43−) to matrix protein peaks,31–33 and to quantify mineralisation across the native bone–tendon interface34,35 but, to our knowledge, has not been used to identify and/or quantify mineralisation within hydrogel scaffolds.
The aim of this study was to develop a method using CRM that enabled us to determine the chemical and physical nature of the interface between a sparingly soluble calcium phosphate cement and a biopolymeric gel. In addition to providing visual information, this method will enable us to quantify mineralisation and to identify the phase changes occurring within the structures during in vitro maturation.
Experimental
Production of the hard–soft material interface composite
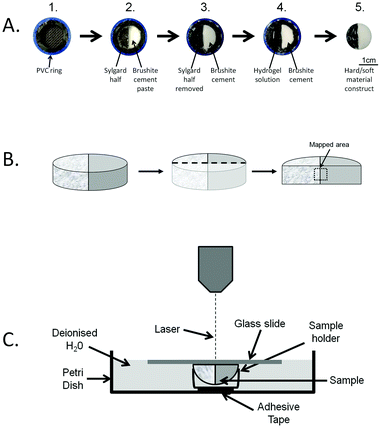
Two natural polymers were chosen to represent the soft portion of the composite construct, alginate and gellan. A 4% (w/w) alginate solution (Alginic acid, sodium salt, Sigma-Aldrich, UK) and a 1% (w/w) gellan solution (Gelrite® Gellan Gum, Sigma-Aldrich, UK) were prepared by dissolving the respective powders in double distilled water by stirring for at least 1 h at >85 °C. Both alginate and gellan solutions were sterilised using an autoclave and stored at room temperature before use. Brushite (CaHPO4·2H2O) cement was chosen for the hard portion of the composite. The preparation procedure used for the manufacture of moulds and cement samples is schematically displayed in Fig. 1A (parts 1–3). For the cement mould preparation, PVC tube rings of 5 mm in height were placed into a polystyrene (PS) 24-well plate (diameter 1.6 cm), prior to filling with a Sylgard silicone polymer (Sylgard 184, Dow Corning, US). After polymerisation for four days at 60 °C, the Sylgard layer was halved along its long-axis and one half was removed from the tube ring, leaving a gap to be replaced by the brushite cement. The brushite cement was made by mixing β-tricalcium phosphate (β-TCP) with H3PO4. The β-TCP was manufactured by reactive sintering of a powder containing CaHPO4 (Mallinckdrodt-Baker, Germany) and CaCO3 (Merck, Germany) with a theoretical calcium to phosphate molar ratio of 1.5. The powder mixture was suspended in absolute ethanol and mixed for 12 h. The suspension was then filtered and the resulting cake heated in an alumina crucible to 1400 °C for 12 h and 1000 °C for 6 h prior to quenching in a dessicator in ambient conditions. The resulting sinter cake was then crushed using a pestle and mortar and was passed through a 125 μm sieve. Then, the brushite cement halves were fabricated by combining β-TCP with 3.5 M H3PO4 (with 200 mM citric acid + 200 mM sodium pyrophosphate) at a powder to liquid ratio of 1.75 g mL−1 and the resulting cement slurry was cast into the mould before setting occurred (Fig. 1A, part 3). The brushite cement samples were then dried for four days at 37 °C and subsequently sterilised by immersion in 70% ethanol for 20 min, followed by UV radiation overnight. The resulting composite samples containing an interface between brushite cement and alginate/gellan hydrogel were prepared in a sterile environment in a laminar flow hood. Furthermore, all of the solutions used were sterilised prior to composite preparation by either immersion in 70% ethanol, UV irradiation overnight or filtration through a 0.22 μm filter to prevent fungal and bacteria growth. Preparation of the composite samples was carried out in 24-well plates. PVC tube rings were placed into the wells and the brushite disc halves were added to the moulds leaving the remaining half to be filled with the hydrogel (Fig. 1, part 3). For the alginate/brushite samples, 250 μL of the 4 wt% alginate solution were pipetted next to the cement and covered with a sterile filter paper. Afterwards, the filter paper was covered with 0.1 M CaCl2 solution. The alginate was left to crosslink for 2 h, followed by rinsing the alginate/cement sample with sterile deionised water and placing it into a new PS well plate. In case of the gellan/brushite samples, the gellan gum solution was heated to <85 °C, prior to combining 1 mL of the solution with 50 μL of sterile 0.1 M CaCl2 solution. 250 μL of the solution was pipetted into the mould next to a brushite cement half, before being transferred to a sterile 24-well plate. Once prepared, the hard–soft material composites were covered with 1 mL of sterile PBS (Sigma-Aldrich, UK). Two different protocols were employed, either the static protocol, where the PBS was not exchanged or the dynamic protocol, where the PBS was exchanged every 2–3 days throughout the duration of the experiment. The samples were kept under high humidity at 37 °C for a total of 28 days.Sample preparation
Prior to analysis, the samples were rinsed with double distilled water and cut vertically (perpendicular to the phase interface) using a scalpel. Then, one half was mounted on a sample holder and frozen in a cryostat chamber (Starlet 2212, Bright, UK) with cryospray to −52 °C (Cryospray 134, Bright, UK). After this, the sample was cut at using a cryotome −25 °C to create a flat surface suitable for CRM observation (Fig. 1B). In order to avoid shrinkage of the gel during the CRM mapping, the sample was immersed in deionised water throughout the CRM analysis. The assembly of the immersed sample is shown in Fig. 1C. To hold the sample in place, it was positioned in a microcentrifuge tube lid, which was fixed to the Petri dish using adhesive tape. The lid containing the sample was covered with a glass slide, allowing the laser beam to be focussed on the immersed sample surface. Utilisation of this technique allowed for the simultaneous visualisation of a hydrated hard–soft material sample, more representative of the hydrogels used for cell culture in tissue engineering applications.Characterisation
For the hard–soft material composite samples, image mapping was performed over 500 μm × 1000 μm/1200 μm × 1470 μm (width height) areas about the interface using 92/221 data points along each horizontal line and 184/271 lines with an integration time of 0.53 s/0.23 s at each data point. After each mapping processing was performed (Witec Project 2.02, Witec Germany) a sum integration was performed over the peaks of interest (115–200 cm−1 autofluorescence, 940–1020 cm−1 orthophosphate group) to produce heat map images. Count line scans over the interface for the orthophosphate group and whole spectra at various points along cross section were collected and normalised to their maximum peak and plotted in Microsoft Excel.
 | (1) |
Statistical analysis
Where appropriate, results are presented as mean ± SEM. Mean values were compared using ANOVA followed by Tukey HSD test using Brightstat.36 The significance level was set at 0.05.Results and discussion
Raman spectra of individual components
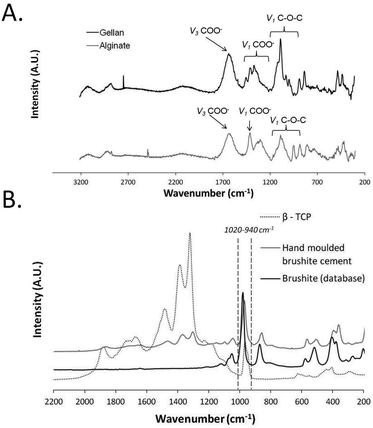
Prior to investigation of the hard–soft interface composite samples, the individual components of the composites were analysed using CRM to identify their chemical composition (Fig. 2). The Raman spectra of the soft components (Fig. 2A) and hard components (Fig. 2B) show characteristic peaks for each individual material as previously reported in the literature.37,38 For the alginate hydrogel, the asymmetric stretching of the COO– group (ν3) appears around 1614 cm−1, while the symmetrical stretching of this side group (ν1) is present at 1414 cm−1. Also, C–O–C stretching modes (ν1) are seen at wavenumbers around 1290 cm−1 and 820–1140 cm−1. In case of gellan, the asymmetrical COO– stretching mode (ν3) is located at 1616 cm−1 and the symmetrical carboxyl group stretching (ν1) at 1330–1430 cm−1. In addition, the peaks at around 820–1140 cm−1 are caused by the symmetrical stretching of the C–O–C bonds (ν1) (Fig. 2A). Fig. 2B displays the Raman spectrum acquired for brushite cement in comparison to brushite and β-TCP reference spectra. The strongest brushite peak around 985 cm−1 (due to P–O stretching of the PO43−-ion) is present in all three displayed spectra. The shoulder peak at 891 cm−1 represents the HPO42−-ions in the hydrated sample and appears in both β-TCP and brushite cement. Also, weak shoulder peaks around 1079–1166 cm−1 (ν1, ν2 and ν3 P–O modes) are present in these both materials. O–H stretching modes around 388 cm−1 and P–O bending of the PO43− ion at 413 and 549 cm−1 are present in all the three spectra. Despite these similarities, the peaks around 1318–1376 cm−1 are only characteristic for β-TCP but not for pure brushite and could be assigned to P![[double bond, length as m-dash]](https://www.rsc.org/images/entities/char_e001.gif) O stretching, sometimes appearing as a doublet around the 1150–1350 cm−1 region.38 The presence of these characteristic β-TCP peaks in the brushite cement reveal the presence of β-TCP in the prepared brushite cement samples. Indeed, brushite cements formed using this stoichiometry of reactants have previously been shown to consist of around 66 wt% β-TCP.39
O stretching, sometimes appearing as a doublet around the 1150–1350 cm−1 region.38 The presence of these characteristic β-TCP peaks in the brushite cement reveal the presence of β-TCP in the prepared brushite cement samples. Indeed, brushite cements formed using this stoichiometry of reactants have previously been shown to consist of around 66 wt% β-TCP.39
Investigation of the hard–soft material interface
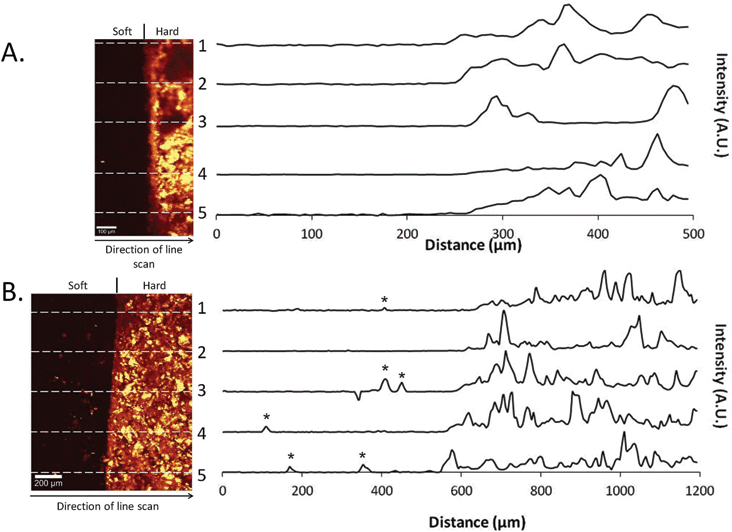
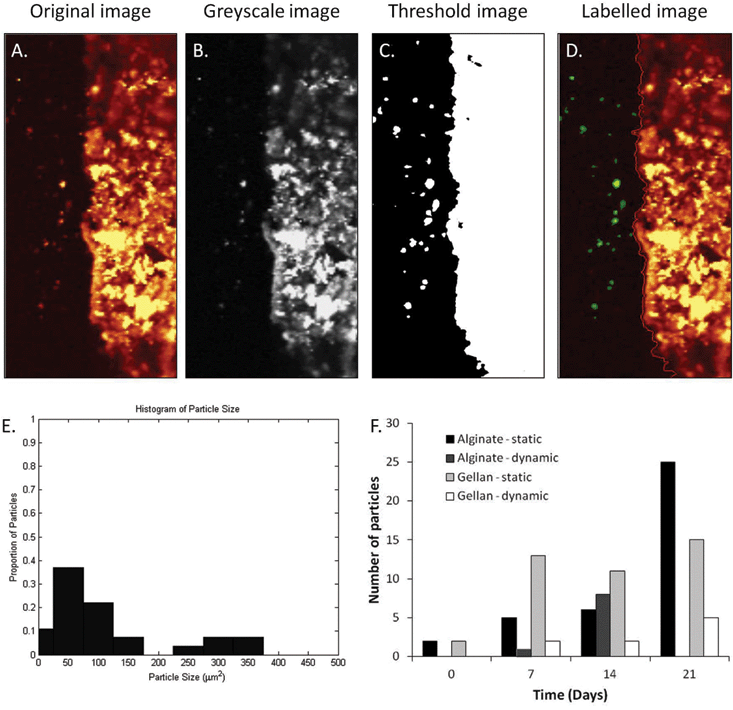
The intensity of the P–O peak was mapped across the hard–soft material interface on day 0 and day 28 in samples manufactured from gellan hydrogels (Fig. 3). At day 0, a clear demarcation was observed between the hydrogel and the cement portions of the construct, with no obvious areas of intensity in the hydrogel portion (Fig. 3A). Multiple line-scans measuring the intensity of the P–O peaks were plotted perpendicular to the material interface and demonstrated a lack of intensity up until approximately 250 μm across the interface where, as expected, intensity increases at the brushite cement. Conversely, after static ageing in PBS for 28 days, intense areas of P–O can be observed in the soft portion of the construct (Fig. 3B). These areas of increased intensity can also been seen in the line scans taken at several points across the interface, indicating that phosphate deposition is occurring within the soft material portion of the composite.In order to identify changes in chemical composition across the hard–soft material composite, individual Raman spectra were collected at designated points across the sample surface in both alginate (ESI Fig. 1A–C†) and gellan composites (ESI Fig. 1D–E†). As expected in un-aged samples, Point 1 shows the typical spectrum obtained for brushite cement, consisting of a single peak around 980 cm−1, indicative of brushite and peaks around 1200–1500 cm−1, indicative of β-TCP as described previously (Fig. 2B). Spectra obtained from further across the interface (points 2–3) contained phosphate peaks around 940 cm−1, however points 4–6 show no appreciable peaks pertaining to the vibrational modes of any phosphate groups. After ageing for 28 days with the static or dynamic protocol (ESI Fig. 1B, C, E, F†), points 1 and 2 on the cement portion of the construct display peaks around 980 cm−1 and 1200–1500 cm−1 as seen previously. In general, these peaks disappear as the points of interest go across the interface into the soft material but reappear in points 6 and 7, at discrete areas in the body of the soft material portion of the construct. This confirms the presence of phosphate within the soft material that was not seen in the un-aged sample. To quantify the presence of mineral within the soft material portion of the composites, each Raman mapping was analysed to provide details on the number and size of particles present following ageing using image analysis software (Fig. 4A–E). The Raman mappings used for image analysis are displayed in ESI Fig. 2A and 2B.† The number of particles present in the soft material portion is displayed in Fig. 4F, and shows a general trend of increasing particle numbers with ageing, best observed in the statically aged alginate group (Fig. 4F). In addition to the number of particles appearing the soft material portion of the composite, the maximum, minimum and mean size of particles was also determined (Table 1). Maximum particle size obtained increased from day 0 to day 21 in static ageing conditions in both alginate and gellan composites. This was coupled with a reduction in minimum particle size in both alginate and gellan hydrogels. Mean particle size spanned a large range, demonstrated by the large standard deviations present, but shows that both the number of and the size of particles in the soft material portion are important features to be monitored and can easily be assessed using the method presented here. Conversely, in the dynamically aged groups, there was no trend to increasing or decreasing particle sizes, although notably, no particles were observed in the alginate day 21, dynamically aged samples (Fig. 4F, Table 1).
| Maximum particle size (μm2) | Minimum particle size (μm2) | Mean particle size ± st. dev. (μm2) | ||||
|---|---|---|---|---|---|---|
| Alginate/brushite | Static | Dynamic | Static | Dynamic | Static | Dynamic |
| Day 0 | 83.92 | n/a | 72.93 | n/a | 78.42 ± 7.78 | n/a |
| Day 7 | 61.94 | 71.93 | 19.98 | 71.93 | 36.56 ± 18.35 | 71.93 |
| Day 14 | 134.86 | 616.38 | 20.98 | 41.96 | 58.27 ± 41.09 | n/a |
| Day 21 | 556.44 | n/a | 27.97 | n/a | 157.32 ± 130.57 | 186.56 ± 207.52 |
| Gellan/brushite | Static | Dynamic | Static | Dynamic | Static | Dynamic |
|---|---|---|---|---|---|---|
| Note: minimum recordable particle size is set at 9.2752 μm2. Weaker particles or parts of particles outside of focal plane may be missed or ignored by the threshold. Mean particle size without st. dev. is a result of only 1 particle visible in image. | ||||||
| Day 0 | 83.92 | n/a | 72.93 | n/a | 133.37 ± 140.71 | n/a |
| Day 7 | 414.58 | 42.96 | 19.98 | 42.96 | 124.11 ± 124.10 | 42.96 |
| Day 14 | 405.59 | 115.88 | 22.98 | 77.92 | 166.38 ± 126.10 | 96.91 ± 26.88 |
| Day 21 | 575.42 | 52.95 | 19.98 | 19.98 | 186.87 ± 176.13 | 33.57 ± 14.67 |
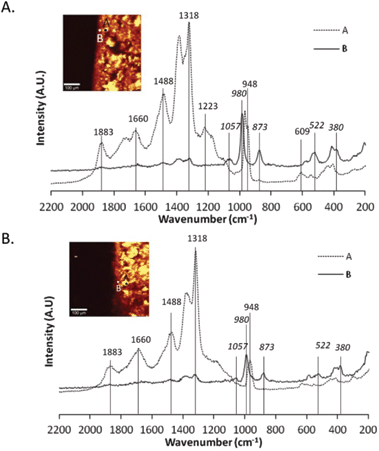
Although the chemical composition of the brushite cement portion of the composite had been characterised prior to combination with the gellan or alginate hydrogels (Fig. 2B), the composition following combination was also acquired (Fig. 5). Fig. 5A displays the Raman spectra for two distinct areas within the cement matrix only a few hours after combination with the alginate hydrogel as described in Fig. 1A. Point A demonstrates the peaks assigned to the components of the brushite cement matrix, namely a single peak around 980 cm−1, indicative of brushite and peaks around 1200–1500 cm−1, indicative of β-TCP (Fig. 5A, point A). However, at point B, the spectrum contains different peaks (Fig. 5A, point B). Point B lies on the boundary of the hard and soft materials and at this point, the intensity of the peaks indicative of β-TCP was reduced and there is the presence of peaks at 522 cm−1, 873 cm−1 and 609 cm−1 of note (Fig. 5A, point B). This shows the appearance of another phase within the cement matrix as it transitions into the soft material. Peaks at 522 cm−1 (ν2PO4–3) and 580 cm−1 (ν4PO4−3) can be assigned to octacalcium phosphate (OCP)40–42 and peaks at 609 cm−1 (ν4PO4−3), 873 cm−1 (P–OH stretching) and 1057 cm−1 (ν3PO4−3) can be assigned to carbonated hydroxyapatite (HA).41,43,44 This compositional change within the brushite cement matrix also is observed in hard material portion of the gellan composite construct (Fig. 5B, point B). Since OCP is known to be an intermediate in the precipitation of HA,45 hydrolysis of brushite to OCP occurs within a pH range 6.2–7.4 and a temperature range 25–37 °C46 and OCP is formed on β-TCP crystals within hours,47 its presence here is not surprising. Similarly, carbonated apatites (type A and type B) can be produced via precipitation via the reactions between carbonates, phosphates and hydroxyl groups.45 Perhaps the presence of the hydrogel at the boundary of the cement allows the transformation of brushite into OCP or carbonated apatite.
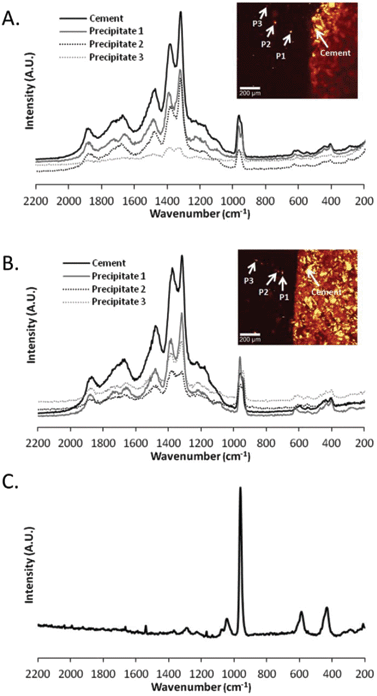
After ageing of the composite constructs with the static ageing protocol, it has already been described that precipitates are observed within the soft material portion of the composite construct. The chemical composition of three of these precipitates was identified in both alginate (Fig. 6A) and gellan (Fig. 6B) composite constructs. Interestingly, the Raman spectra for the cement bulk and each individual precipitate revealed similar compositions, with peaks present that are indicative of β-TCP and brushite as described previously for the brushite cement. In fact, little difference was observed between the spectra for the precipitates and the cement bulk, only the intensity was decreased (Fig. 6). The Raman spectra not only contained peaks indicating the P–O stretching (980 cm−1) and bending of the orthophosphate group but also modes characteristic for β-TCP (peaks around 1317–1376 cm−1). These spectra can be compared to the Raman spectrum obtained for HA (Fig. 6C). The spectrum for HA displayed a very strong peak around 961 cm−1, assigned to P–O stretching, and other peaks around 425 cm−1, 576 cm−1 and 1025 cm−1, assigned to v2, v4 and v3 PO4 modes respectively,42,45 and thus it can be concluded that the deposits in the soft material are not composed of HA. The origin of these deposits is likely to be from the cement itself, especially when the CRM mappings of the experimental conditions of static and dynamic ageing conditions are compared. However, the method by which precipitation occurs within the hydrogel is not clear i.e. does it originate from the cement bulk at the interface or from the ageing medium. The fact that both the alginate and the gellan hydrogel portions of the composite constructs possess higher amounts of phosphate deposits when the PBS is not exchanged throughout the experiment (static ageing) than in the dynamic state, suggests that the medium itself plays a more important role in the mineralisation of the hydrogel than the actual hydrogel–cement interface. This is a trend that is observed in both hydrogel species at several time points up until 28 days (ESI Fig. 2,†Fig. 4F, Table 1) with the exception of 1 time point (ESI Fig. 2,† alginate, day 14, compare static to dynamic). While this trend exists, it is important to note that the produced CRM mapping depends entirely on the particular location of the scanned area of the interface, of which it is only a small sampled area, rather than the entire interface. It is suggested that the calcium phosphate particles found in the hydrogel derive from the medium instead of directly from the brushite interface. The similarity of the Raman spectra of the particles compared to the cement material further allows the assumption that the particles initially originate from the brushite cement–PBS interface, where the cement dissolves and disintegrates, rather than form reprecipitations of HA as would perhaps be expected.39 When placed in aqueous medium, brushite cements will either remain stable, dissolve, disintegrate or transform into hydroxyapatite.39 If the surrounding medium is under-saturated with calcium and phosphate ions, dissolution will occur. The transformation of brushite into hydroxyapatite can then ensue once saturation of calcium and phosphate ions occurs.39 Previous work has shown that a dynamic ageing protocol will lead to an increase in dissolution of brushite cements when compared to a static ageing protocol.39 This was attributed to the balance in calcium and phosphate ion concentration in the medium; when dissolution products were removed from the solution on a daily basis, a higher rate of dissolution was maintained when compared to statically aged samples.39 In this case, to identify the origin of the precipitates observed within the hydrogel matrices, both the surface roughness and porosity of the brushite cements were measured at day 0 and then at day 21 and day 28 respectively. Table 2 displays three different surface roughness measurements for the brushite cement segments in contact with gellan hydrogels for the duration of the study. Under a static ageing regime for 21 days, the average surface roughness (Sa) increases 3.3 fold from 6.3 ± 0.5 μm to 20.6 ± 12.8 μm (Table 2). A similar increase in the root mean square roughness (Sq) is observed, increasing 3.9 fold from 7.3 ± 1.0 μm to 28.8 ± 16.0 μm. Furthermore, the ten-point height roughness (Sz) increases 5.2 fold from 123 ± 16.3 μm to 635 ± 82 μm. A similar trend is observed in the dynamically aged samples with Sa, Sq and Sz increasing 2.8 fold (6.3 ± 0.5 to 17.8 ± 1.2), 3.2 fold (7.3 ± 1.0 to 23.1 ± 2.0) and 4.1 fold (123 ± 16.3 to 500 ± 73) respectively. This increase in surface roughness on the microscale can be attributed to the gradual breakdown of the cement as it degrades and suggests the creation of large pits/pores on the cement surface where it was in contact with the hydrogel. In addition to an increase in surface roughness, the porosity of the brushite cement portions of the composite constructs was measured. Table 3 displays the porosity measurements for cements on day 0 and day 28 following ageing with the static or dynamic protocol. As expected, the porosity of the brushite cement changed over time. On day 0, porosity was measured as 49.5 ± 1.07%. This was increased following static ageing to 52.9 ± 2.28%, and following dynamic ageing to 56.0 ± 3.5% (Table 3) although these were not considered significantly different (p = 0.3). The trends of increasing surface roughness, porosity and the presence of calcium phosphate precipitates within the gel matrices aged dynamically indicate an increase in brushite cement dissolution when compared to the statically aged group as has been described before.39 Despite this, the deposits in the hydrogel matrix are not HA (Fig. 6) as may be expected, but resemble the components of the cement matrix, β-TCP and brushite. β-TCP is impossible to precipitate at ambient temperatures,47 however it has been shown to be released from the surface of brushite cement in vitro.48 Incorporation of carboxyl acids into the brushite cement matrix leads to an increase in disintegration of the cement matrix, releasing solid β-TCP crystals into the surrounding media.48 The acid component of the hard material used here included citric acid, therefore could reduce cement cohesion and facilitate the release of entrapped β-TCP particles from the cement matrix. The β-TCP particles are less soluble than brushite particles, and so remain within the medium. As shown in Table 1, the particle sizes detected are varied, and this particular technique has a minimum particle size detection of around 9 μm. Mesh sizes for gellan hydrogels have been reported to be in the range of ∼0.5 μm,49 but it is feasible that smaller, undetectable particles may find their way into the gel network and provide nucleation sites for further growth.
| Day 0 | Day 21 | ||
|---|---|---|---|
| Static | Dynamic | ||
| S a: average roughness, Sq: root-mean-square roughness, Sz: ten-point height roughness. | |||
| S a (μm) | 6.3 ± 0.5 | 20.6 ± 12.8 | 17.8 ± 1.2 |
| S q (μm) | 7.3 ± 1.0 | 28.8 ± 16.0 | 23.1 ± 2.0 |
| S z (μm) | 123 ± 16.3 | 635 ± 87.0 | 500 ± 73.0 |
| Day 0 | Day 28 | ||
|---|---|---|---|
| Static | Dynamic | ||
| Porosity (%) | 49.45 ± 1.07 | 52.88 ± 2.28 | 56.02 ± 3.52 |
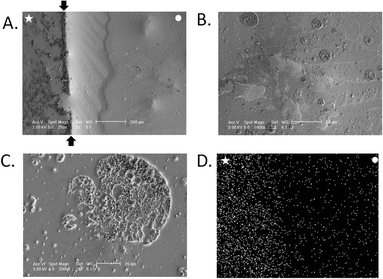
The use of CRM in the observation of the hard–soft material interface was compared with the use of Environmental Scanning Electron Microscopy (ESEM) and Energy dispersive X-ray spectroscopy (Fig. 7). Fig. 7A shows the hard–soft material interface after statically ageing in PBS for 21 days. The boundary between the brushite (star) and gellan (circle) is clearly observed (arrows), however, the presence of precipitates in the soft material portion is not obvious at lower magnification. Increased magnification allows the identification of precipitates within the gellan portion of the composite (Fig. 7B, C) having a diameter up to 90 μm, which is within the same range as measured by image analysis (Table 1). The precipitates are randomly distributed in the gel matrix are not seen to be predominantly located near the interfacial region as seen with the CRM. As expected, EDX mapping due to phosphorus in Fig. 7D reveals a greater occurrence of this element at the side of the brushite cement (Fig. 7, star) than the alginate gel portion (Fig. 7, circle). However, identification of a definite interfacial region of the composite construct remains impossible to detect as no precise change in distribution from one phase to the other is evident. Although both the choice of integration limits for the CRM mapping and the location of the laser focus affect the resulting image, CRM outplays cryo-ESEM as a technique for the investigation of the soft–hard material interface. Firstly, no artefacts caused by other materials were detected with CRM. At this juncture, molecular vibrations of Raman active bonds are excited, thus, if their distribution is plotted across the interface of the sample, the detection of other materials having other bonds is excluded. In contrast, the ESEM image is the result of the number of emitted electrons reaching the detector, which are in turn caused by a combination of topography and material contrast. Therefore, the ESEM image contains information which makes an exclusive consideration of a certain bond of a molecule in the sample impossible. Secondly, CRM yields a very specific material contrast, namely of one particular intramolecular bond, while ESEM yields an image showing the information of surface topography and material contrast, since the detector does not distinguish between secondary and backscattered electrons. As mentioned previously, the EDX mapping across the interface (Fig. 7D) failed to identify the interface between the cement and gel portions of the composite construct. Finally, the time taken to acquire individual images via CRM and ESEM differ. CRM mapping requires several hours depending on the resolution and size of the scanned area, whereas ESEM images can be obtained in several seconds. Despite this, the effort required for the sample preparation involved in cryo-ESEM is lengthy compared to CRM. Here, we have described a technique for being able to view hard–soft material construct almost immediately, where the only sample preparation conditions are an even sample surface and the immersion of the construct in liquid to prevent dehydration and shrinkage of the gel.
The fact that static ageing appears to result in the deposition of more mineral within the soft material portion of the composite construct will have significance in future studies. The long-term aim of the composite materials described here is to culture in the presence of cells, as described in our engineered bone-to-bone ligament model.22 With this in mind, a static ageing protocol would not be employed, since culture media will need to be removed and replenished throughout the experiment. Furthermore, since culture media often contains serum, and serum is known to affect both the dissolution of brushite39 and control of precipitation of calcium phosphates,39,50,51 the effect in this area will be interesting to explore. The long-term aim is to form a graded interface between the hard and soft materials to replicate what is seen in vivo, therefore a reproduction of this structure in vitro is an important step to achieve.
Conclusions
This study has demonstrated the ability to study mineralisation within the soft material portion of hard–soft material composite structures. A simple method for observing hydrogels in a hydrated state has been developed for use with CRM. CRM far outplays other methods used for the observation of mineral within soft material analogue such as histology or SEM. Furthermore, it allows the quantification and chemical composition of precipitates within the matrix to be analysed. The methodology and results of this study will be of interest to those studying composite structures for the manufacture of composite tissues, or bone analogues for tissue engineering applications.Acknowledgments
The WiTec Confocal Raman Microscope used in this research was obtained through Birmingham Science City: Innovative Uses for Advanced Materials in the Modern World (West Midlands Centre for Advanced Materials Project 2), with support from Advantage West Midlands (AWM) and part funded by the European Regional Development Fund (ERDF).Notes and references
- J. Z. Paxton, K. Baar and L. M. Grover, Orthop. Muscul. Syst.: Curr. Res., 2012 DOI:10.4172/2161-0533.S1-003.
- A. G. Mikos, S. W. Herring, P. Ochareon, J. Elisseeff, H. H. Lu, R. Kandel, F. J. Schoen, M. Toner, D. Mooney, A. Atala, M. E. Van Dyke, D. Kaplan and G. Vunjak-Novakovic, Tissue Eng., 2006, 12, 3307–3339 CrossRef CAS PubMed.
- M. Benjamin, T. Kumai, S. Milz, B. M. Boszczyk, A. A. Boszczyk and J. R. Ralphs, Comp. Biochem. Physiol., Part A: Mol. Integr. Physiol., 2002, 133, 931–945 CrossRef CAS.
- M. Benjamin and D. McGonagle, Scand. J. Med. Sci. Sports, 2009, 19, 520–527 CrossRef CAS PubMed.
- M. Benjamin and J. R. Ralphs, Ital. J. Anat. Embryol., 2001, 106, 151–157 CAS.
- N. J. Castro, S. A. Hacking and L. G. Zhang, Ann. Biomed. Eng., 2012, 40, 1628–1640 CrossRef PubMed.
- M. Keeney and A. Pandit, Tissue Eng., Part B, 2009, 15, 55–73 CrossRef CAS PubMed.
- P. J. Yang and J. S. Temenoff, Tissue Eng., Part B, 2009, 15, 127–141 CrossRef CAS PubMed.
- K. L. Moffat, W. H. Sun, P. E. Pena, N. O. Chahine, S. B. Doty, G. A. Ateshian, C. T. Hung and H. H. Lu, Proc. Natl. Acad. Sci. U. S. A., 2008, 105, 7947–7952 CrossRef CAS PubMed.
- J. P. Spalazzi, E. Dagher, S. B. Doty, X. E. Guo, S. A. Rodeo and H. H. Lu, J. Biomed. Mater. Res. A, 2008, 86, 1–12 CrossRef PubMed.
- J. P. Spalazzi, E. Dagher, S. B. Doty, X. E. Guo, S. A. Rodeo and H. H. Lu, Conf. Proc. IEEE Eng. Med. Biol. Soc., 2006, 1, 525–528 Search PubMed.
- J. P. Spalazzi, S. B. Doty, K. L. Moffat, W. N. Levine and H. H. Lu, Tissue Eng., 2006, 12, 3497–3508 CrossRef CAS PubMed.
- N. T. Khanarian, N. M. Haney, R. A. Burga and H. H. Lu, Biomaterials, 2012, 33, 5247–5258 CrossRef CAS PubMed.
- N. T. Khanarian, J. Jiang, L. Q. Wan, V. C. Mow and H. H. Lu, Tissue Eng., Part A, 2012, 18, 533–545 CrossRef CAS PubMed.
- B. A. Harley, A. K. Lynn, Z. Wissner-Gross, W. Bonfield, I. V. Yannas and L. J. Gibson, J. Biomed. Mater. Res. A, 2010, 92, 1066–1077 Search PubMed.
- B. A. Harley, A. K. Lynn, Z. Wissner-Gross, W. Bonfield, I. V. Yannas and L. J. Gibson, J. Biomed. Mater. Res. A, 2010, 92, 1078–1093 Search PubMed.
- A. K. Lynn, S. M. Best, R. E. Cameron, B. A. Harley, I. V. Yannas, L. J. Gibson and W. Bonfield, J. Biomed. Mater. Res. A, 2010, 92, 1057–1065 Search PubMed.
- S. Elguizaoui, D. C. Flanigan, J. D. Harris, E. Parsons, A. S. Litsky and R. A. Siston, Knee, 2012, 19, 812–817 CrossRef PubMed.
- J. Ma, K. Goble, M. Smietana, T. Kostrominova, L. Larkin and E. M. Arruda, J. Biomech. Eng., 2009, 131, 101017 CrossRef PubMed.
- J. Ma, M. J. Smietana, T. Y. Kostrominova, E. M. Wojtys, L. M. Larkin and E. M. Arruda, Tissue Eng., Part A, 2012, 8(1–2), 103–116 CrossRef PubMed.
- J. Z. Paxton, K. Donnelly, R. P. Keatch, K. Baar and L. M. Grover, Ann. Biomed. Eng., 2010, 38, 2155–2166 CrossRef PubMed.
- J. Z. Paxton, L. M. Grover and K. Baar, Tissue Eng., Part A, 2010, 16, 3515–3525 CrossRef CAS PubMed.
- J. Z. Paxton, U. Wudebwe, A. Wang, D. Woods and L. M. Grover, Tissue Eng., Part A, 2012, 18(15–16), 1596–1607 CrossRef CAS PubMed.
- M. R. Nejadnik, A. G. Mikos, J. A. Jansen and S. C. Leeuwenburgh, J. Biomed. Mater. Res. A, 2012, 100, 1316–1323 CrossRef PubMed.
- T. Douglas, M. Wlodarczyk, E. Pamula, H. Declercq, E. de Mulder, M. Bucko, L. Balcaen, F. Vanhaecke, R. Cornelissen, P. Dubruel, J. Jansen and S. Leeuwenburgh, J. Tissue Eng. Regen. Med., 2012 DOI:10.1002/term.1616.
- T. E. Douglas, P. B. Messersmith, S. Chasan, A. G. Mikos, E. L. de Mulder, G. Dickson, D. Schaubroeck, L. Balcaen, F. Vanhaecke, P. Dubruel, J. A. Jansen and S. C. Leeuwenburgh, Macromol. Biosci., 2012, 12, 1077–1089 CrossRef CAS PubMed.
- R. J. DeVolder, I. W. Kim, E. S. Kim and H. Kong, Tissue Eng., Part A, 2012, 18, 1642–1651 CrossRef CAS PubMed.
- G. Liu, D. Zhao, A. P. Tomsia, A. M. Minor, X. Song and E. Saiz, J. Am. Chem. Soc., 2009, 131, 9937–9939 CrossRef CAS PubMed.
- M. Gudur, R. R. Rao, Y. S. Hsiao, A. W. Peterson, C. X. Deng and J. P. Stegemann, Tissue Eng., Part C, 2012, 18(12), 935–946 CrossRef CAS PubMed.
- R. R. Rao, A. Jiao, D. H. Kohn and J. P. Stegemann, Acta Biomater., 2011, 8, 1560–1565 CrossRef PubMed.
- X. Bi, C. A. Patil, C. C. Lynch, G. M. Pharr, A. Mahadevan-Jansen and J. S. Nyman, J. Biomech., 2011, 44, 297–303 CrossRef PubMed.
- J. S. Nyman, A. J. Makowski, C. A. Patil, T. P. Masui, E. C. O'Quinn, X. Bi, S. A. Guelcher, D. P. Nicollela and A. Mahadevan-Jansen, Calcif. Tissue Int., 2011, 89, 111–122 CrossRef CAS PubMed.
- J. R. Maher, M. Takahata, H. A. Awad and A. J. Berger, J. Biomed. Opt., 2011, 16, 087012 CrossRef PubMed.
- B. Wopenka, A. Kent, J. D. Pasteris, Y. Yoon and S. Thomopoulos, Appl. Spectrosc., 2008, 62, 1285–1294 CrossRef CAS PubMed.
- A. G. Schwartz, J. D. Pasteris, G. M. Genin, T. L. Daulton and S. Thomopoulos, PLoS One, 2012, 7, e48630 CAS.
- D. Stricker, Comput. Methods Programs Biomed., 2008, 92, 135–143 CrossRef PubMed.
- N. Mehrban, J. Z. Paxton, J. Bowen, A. Bolarinwa, E. Vorndran, U. Gbureck and L. M. Grover, Adv. Appl. Ceram., 2010, 110, 162–167 CrossRef.
- G. Socrates, Infrared and Raman Characteristic Group Frequencies, Wiley, 2001 Search PubMed.
- L. M. Grover, J. C. Knowles, G. J. Fleming and J. E. Barralet, Biomaterials, 2003, 24, 4133–4141 CrossRef CAS PubMed.
- N. J. Crane, V. Popescu, M. D. Morris, P. Steenhuis and M. A. Ignelzi, Jr., Bone, 2006, 39, 434–442 CrossRef CAS PubMed.
- P. Jamshidi, R. H. Bridson, A. J. Wright and L. M. Grover, Biotechnol. Bioeng., 2013, 110(5), 1487–1494 CrossRef CAS PubMed.
- S. Koutsopoulos, J. Biomed. Mater. Res., 2002, 62, 600–612 CrossRef CAS PubMed.
- G. Penel, G. Leroy, C. Rey and E. Bres, Calcif. Tissue Int., 1998, 63, 475–481 CrossRef CAS PubMed.
- G. Penel, N. Leroy, P. Van Landuyt, B. Flautre, P. Hardouin, J. Lemaitre and G. Leroy, Bone, 1999, 25, 81S–84S CrossRef CAS PubMed.
- J. C. Elliot, Structure and Chemistry of the Apatites and other Calcium Phosphates, Elsevier, Amsterdam, 1994, pp. 111–189 Search PubMed.
- J. C. Elliot, Structure and Chemistry of the Apatites and other Calcium Phosphates, Elsevier Science, Amsterdam, 1994, pp. 1–62 Search PubMed.
- J. Heughbaert, S. J. Zawacki and G. H. Nancollas, J. Cryst. Growth, 1983, 63, 83–90 CrossRef.
- M. H. Alkhraisat, F. T. Marino, J. R. Retama, L. B. Jerez and E. Lopez-Cabarcos, J. Biomed. Mater. Res. A, 2008, 84, 710–717 CrossRef PubMed.
- P. Jamshidi, P. Ma, K. Khosrowyar, A. M. Smith and L. M. Grover, J. Exp. Nanosci., 2012, 7, 652–661 CrossRef CAS.
- D. C. Bassett, L. M. Grover, F. A. Muller, M. D. McKee and J. E. Barralet, Adv. Funct. Mater., 2011, 21, 2968–2977 CrossRef CAS.
- L. M. Grover, U. Gbureck, A. J. Wright, M. Tremayne and J. E. Barralet, Biomaterials, 2006, 27, 2178–2185 CrossRef CAS PubMed.
Footnote |
| † Electronic supplementary information (ESI) available. See DOI: 10.1039/c3bm60102a |
| This journal is © The Royal Society of Chemistry 2014 |

