 Open Access Article
Influence of elastase on alanine-rich peptide hydrogels
V.
Castelletto
a,
R. J.
Gouveia
a,
C. J.
Connon
a,
I. W.
Hamley
*a,
J.
Seitsonen
b,
J.
Ruokolainen
b,
E.
Longo
c and
G.
Siligardi
c
aSchool of Chemistry, Food Biosciences and Pharmacy, University of Reading, Whiteknights, Reading RG6 6AD, UK. E-mail: I.W.Hamley@reading.ac.uk
bDepartment of Applied Physics, Aalto University School of Science, P.O. Box 15100, FI-00076 Aalto, Finland
cDiamond Light Source Ltd, Harwell Science and Innovation campus, Didcot, Oxfordshire OX11 0DE, UK
First published on 29th January 2014
Abstract
The self-assembly of the alanine-rich amphiphilic peptides Lys(Ala)6Lys (KA6K) and Lys(Ala)6Glu (KA6E) with homotelechelic or heterotelechelic charged termini respectively has been investigated in aqueous solution. These peptides contain hexa-alanine sequences designed to serve as substrates for the enzyme elastase. Electrostatic repulsion of the lysine termini in KA6K prevents self-assembly, whereas in contrast KA6E is observed, through electron microscopy, to form tape-like fibrils, which based on X-ray scattering contain layers of thickness equal to the molecular length. The alanine residues enable efficient packing of the side-chains in a beta-sheet structure, as revealed by circular dichroism, FTIR and X-ray diffraction experiments. In buffer, KA6E is able to form hydrogels at sufficiently high concentration. These were used as substrates for elastase, and enzyme-induced de-gelation was observed due to the disruption of the beta-sheet fibrillar network. We propose that hydrogels of the simple designed amphiphilic peptide KA6E may serve as model substrates for elastase and this could ultimately lead to applications in biomedicine and regenerative medicine.
Introduction
A major challenge in regenerative medicine is to create mimics of the extracellular matrix (ECM). To enable dynamic remodelling of ECM-mimics, substrates for proteases can be included. One example is the incorporation of substrates for elastase, which are often alanine-rich short peptides.1 Elastase plays an important role in tissue injury2 and elastase inhibitors are of interest for applications in wound healing, among others,3 since elastase degrades elastin within the natural connective tissue. Elastin, as its name suggests, provides elasticity, for example to the skin. Alanine-rich sequences are found within certain exons of elastin4 The conformations of synthetic alanine-rich peptides such as Ac-A4KA4KA4KA-NH25 and Ac-KKA7KK-NH26 and Ac-KKA7EE-NH26 have been examined by circular dichroism (CD) spectroscopy and NMR techniques. Elastase-sensitive substrates such as A9K have been incorporated into PEG hydrogels to enable the creation of proteolytically-degradable materials for cell culturing.1a,7 Another important biological role of alanine-rich sequences is found in spider silk where alanine repeats containing 5–7 residues are observed in major ampullate Spidroin 1, separated by repeats of a GGX motif.8 The alanine-rich domain forms tightly packed β-sheet structures which contribute to the exceptional tensile strength of spider silk.8bSurfactant-like peptides based on linked sequences of hydrophobic residues attached to shorter charged residue “headgroups” were introduced by Zhang and co-workers.9 Stupp and co-workers examined the self-assembly of a lipopeptide C16-A6E3 incorporating an A6 sequence, and observed X-ray induced ordering of filaments into ordered bundles.10 We recently examined the self-assembly of the mono-capped alanine-rich peptide A6K into nanotubes,11 following earlier work on the self-assembly of this peptide.12 In an initial model, based on (what we now believe to be incorrect) constraints from prior SAXS studies, we presented a model in which peptide β-strands were aligned parallel to the nanotube walls.11 Based on data obtained from solid-state NMR experiments along with FTIR on isotope-labelled peptides, we have now shown that the peptides are in fact aligned perpendicular to the nanotube walls.13 We reasoned that analogous peptides capped at both ends with oppositely charged termini would be likely to form hydrogels due to favorable electrostatic interactions and here we report on the self-assembly of KA6E which has oppositely charged residues at the termini as well as the “homo-telechelic” peptide KA6K. These short model peptides undergo distinct self-assembly behaviour, including, in the case of KA6E, hydrogelation. In addition, we examine the response of the hydrogel to degradation by elastase.
Oligo-alanine peptides containing fewer than nine alanine residues are observed to form β-sheet structures, whereas longer sequences (in the range 9–19 studied) leads to the formation of a mixed α-helical/β-sheet structure.14 Therefore, KA6E is expected to adopt a β-sheet conformation. On the other hand, other groups report that alanine-rich peptides with charged terminal residues can adopt folded conformations such as polyproline II.15 The secondary structure of the KA6E peptide will be analyzed here, along with elastase-induced degradation of hydrogels.
Experimental
Materials
Peptides NH2-KA6E-COOH (K: lysine, A: alanine, E: glutamic acid) and NH2-KA6K-COOH were custom-synthesized by CS Bio (Menlo Park, USA) as TFA salts. Both termini are uncapped. The peptides will henceforth be termed KA6E and KA6K. The purity of the peptides was determined by analytical HPLC in a TFA water/acetonitrile gradient, while the molecular weight MW was obtained by electrospray-mass spectrometry. KA6E purity was 98.36%, the molecular weight was MW,found = 701.67 Da (MW,expected = 701.78 Da). KA6K purity was 95.81%, the molecular weight was MW,found = 700.67 Da (MW,expected = 700.84 Da). Elastase from porcine pancreas (MW = 25.9 kDa) and Trizma@ base were purchased from Sigma Aldrich. KA6K and KA6E were dissolved in water. It has been reported that elastase solubility increases at pH 8. Then, a Trizma@ base solution (titrated with 1 M HCl to pH 8) was used to dissolve weighed amounts of KA6E or elastase, during the study of the elastase effects on KA6E peptide. The molar ratio of elastase to KA6E used in this work will be indicated as [KA6E]/[elastase] = MrE.Circular dichroism (CD)
In the lab, spectra were recorded using a Chirascan spectropolarimeter (Applied Photophysics, UK). The sample was placed in a cover slip cuvette (0.01 mm thick). Spectra are presented with absorbance A < 2 at any measured point with a 0.5 nm step, 1 nm bandwidth, and 1 second collection time per step at 20 °C. The post-acquisition smoothing tool from Chirascan software was used to remove random noise elements from the averaged spectra. A residual plot was generated for each curve in order to verify whether or not the spectrum has been distorted during the smoothing process. The CD signal from the water was subtracted from the CD data of the peptide solutions.CD spectra for KA6E/elastase mixtures were measured at the synchrotron CD beamline B23 (Diamond Light Source, UK).16 For these experiments, the sample was loaded into a CaF2 demountable cuvette cell with a 0.01 mm pathlength. The spectra were measured at 20 °C in the far-UV region (260–180 nm) with a 0.5 nm step and 1 second integration time. The CD spectrum of the solvent/buffer was subtracted from the CD spectra of the peptide solutions.
Fourier transform infra-red (FTIR) spectroscopy
Spectra were recorded using a Thermo-Scientific Nicolet IS5 or a Nexus-FTIR spectrometer, both equipped with a DTGS detector. Samples were sandwiched between two CaF2 plate windows (spacer 0.012 or 0.025 mm thick). Spectra were scanned 128 or 168 times over the range of 900–4000 cm−1.Small-angle X-ray scattering (SAXS)
Experiments were performed on beamline BM29 at the ESRF (Grenoble, France). A few microlitres of samples were injected via an automated sample exchanger at a slow and very reproducible flux into a quartz capillary (1.8 mm internal diameter), which was then placed in front of the X-ray beam. The quartz capillary was enclosed in a vacuum chamber, in order to avoid parasitic scattering. After the sample was injected in the capillary and reached the X-ray beam, the flow was stopped during the SAXS data acquisition. The sample was thermostated throughout its entire travel from the injector to the quartz capillary. SAXS experiments were performed at 20 °C. The q = 4π sin θ/λ range was set to 0.004–0.4 Å−1, with λ = 1.03 Å (12 keV). The images were captured using a PILATUS 1M detector. Data processing (background subtraction, radial averaging) was performed using dedicated beamline software ISPYB.SAXS theory
In this work we fitted the SAXS data of KA6E tapes as a product between the form factor of Gaussian bilayers and the modified Caillé structure factor corresponding to lamellar systems. The details of the bilayer model and the modified Caillé structure factor are given elsewhere.17 The model for Gaussian bilayers assumes an electron density profile comprising one Gaussian function for each headgroup on either side of the bilayer electron density, (ρH), and one Gaussian function for the electron density of the chains in the core of the bilayer (ρC). The density ρH has peaks centred at zH and −zH with width σH. The density ρC has a peak centred at zC, with width σC. Our model assumes that the bilayer is centred at z = zC = 0. Gaussian polydispersity ΔzH in zH is included in the model.The Caillé structure factor for lamellar systems depends on the total number of layers N, the layer spacing d and the Caillé parameter η, which is a measure for the bilayer fluctuations. The fitting parameters of the model are the total bilayer thickness lT = 2(σH + zH) ± ΔzH, ρH, ρC, σC, ρcyl, N, d and η.
The SAXS data for the elastase was modelled using the software Crysol (Version 2.8 © ATSAS team 1995–2011).18 Crysol evaluates the solution scattering from macromolecules with known atomic structure. In this work, we used the atomic coordinates for the structure of porcine pancreatic elastase listed in the Protein Databank File pdb file 2V0B.19
The form factor for the KA6E/elastase mixture was modelled using the form factor for generalized flexible Gaussian coils.20 The parameters of the model are the coil radius of gyration, RG, the excluded volume parameter from the Flory mean field theory, ν, and a forward scattering at q = 0, Io.
The background for all the SAXS data was fitted according to the modified Porod law  , where C1, C2 and C3 are constants.
Fluorescence spectroscopy
Fluorescence spectra were recorded with a Varian Cary Eclipse Fluorescence Spectrometer with samples in 4 mm inner width Quartz cuvettes. Fluorescamine is used as a reagent for the detection of amines because it reacts with primary amines to form highly fluorescent products. The fluorescamine fluorescence assay was performed using (9 × 10⁻³–5.6 × 10⁻²) wt% KA6E solutions free of elastase, or containing elastase at a ratio [KA6E]/[elastase] ∼ 300–2000. All the samples contained 0.45 μM fluorescamine. The samples were excited at λex = 380 nm, and the fluorescence emission was measured for λ = 410–600 nm.SDS-PAGE assay
The experiments were performed with >15% polyacrylamide gels. Binary KA6E/elastase or pure elastase solutions (10 μl) were diluted 1![[thin space (1/6-em)]](https://www.rsc.org/images/entities/char_2009.gif) :
:![[thin space (1/6-em)]](https://www.rsc.org/images/entities/char_2009.gif) 1 in 2 × cc loading buffer containing bromophenol blue, and run on a 15% SDS-PAGE gel. After the run, the gel was stained with Coomassie R overnight, and destained for a day in destaining solution. After imaging, the gel was re-stained using Coomassie G250 (more sensitive staining) overnight, and destained in water for a day before imaging.
1 in 2 × cc loading buffer containing bromophenol blue, and run on a 15% SDS-PAGE gel. After the run, the gel was stained with Coomassie R overnight, and destained for a day in destaining solution. After imaging, the gel was re-stained using Coomassie G250 (more sensitive staining) overnight, and destained in water for a day before imaging.
Cryo-transmission electron microscopy (cryo-TEM)
Experiments were carried out using a field emission cryo-electron microscope (JEOL JEM-3200FSC) operating at 200 kV. Images were taken using bright-field mode and zero loss energy filtering (omega type) with a slit with 20 eV. Micrographs were recorded using a Gatan Ultrascan 4000 CCD camera. The specimen temperature was maintained at −187 °C during the imaging. Vitrified specimens were prepared using an automated FEI Vitrobot device using Quantifoil 3.5/1 holey carbon copper grids with 3.5 μm hole sizes. Grids were cleaned using a Gatan Solarus 9500 plasma cleaner just prior to use and then transferred into an environmental chamber of FEI Vitrobot at room temperature and 100% humidity. Thereafter, 3 μl of sample solution at 2 wt% concentration was applied on the grid, blotted once for 1 second and then vitrified in a 1/1 mixture of liquid ethane and propane at −180 °C. Grids with vitrified sample solutions were maintained in a liquid nitrogen atmosphere and then cryo-transferred into the microscope.Transmission electron microscopy (TEM)
TEM imaging was performed using a Philips CM20 TEM microscope operated at 200 kV. Droplets of solutions were placed on Cu grids coated with a carbon film (Agar Scientific, UK), stained with 1 wt% uranyl acetate, and air-dried.X-ray diffraction (XRD)
X-ray diffraction was performed on a stalk prepared by drying a 43 mM KA6E gel in Trizma buffer. A solution was suspended between the ends of wax-coated capillaries and dried. The sample-to-detector distance was 50 mm. The stalk was mounted vertically onto the four axis goniometer of a RAXIS IV++ X-ray diffractometer (Rigaku) equipped with a rotating anode generator. The XRD data was collected using a Saturn 992 CCD camera.Results and discussion
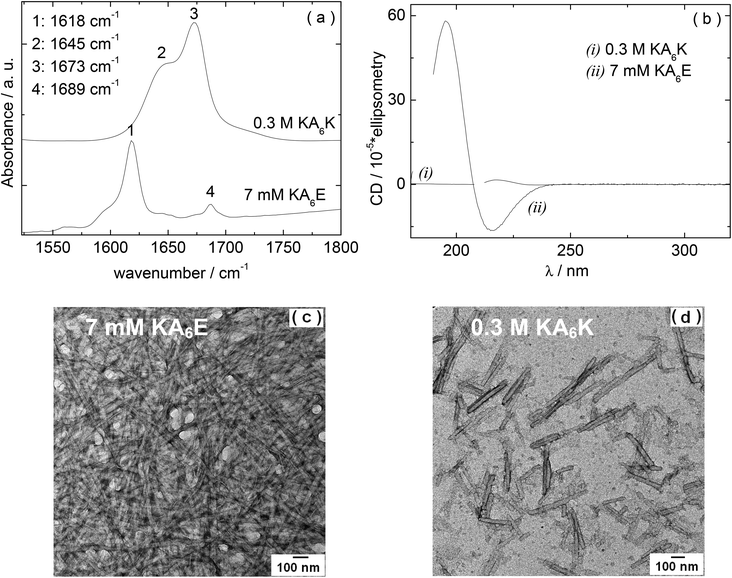
We first examined the self-assembly of KA6E in comparison to KA6K in water. FTIR and circular dichroism (CD) spectra, along with TEM images are shown in Fig. 1. The FTIR spectrum for 7 mM KA6E shows features associated with β-sheet conformation, specifically peaks at 1618 cm−1 and 1689 cm−1. The latter is often associated with antiparallel β-sheets. In contrast, even at much higher concentration (300 mM), no ordered conformation was discernible for KA6K which shows a peaks at 1648 cm−1 due to disordered conformation. There is also a peak at 1673 cm−1, which is due to TFA counterions bound to the lysine residues21 (that this is absent for KA6E points to the formation of salt bridges between K and E residues on neighbouring peptide molecules). These conclusions are supported by CD spectroscopy since KA6E shows features associated with β-sheet structures (maximum at 195 nm and minimum at 215 nm) whereas KA6K shows only a weak maximum near 216 nm, consistent with an extended left-handed helix of polyproline type II.22 The TEM image shown in Fig. 1c reveals that KA6E forms fibrils with a diameter of (35.7 ± 2.6) nm at a concentration of 7 mM, whereas at a much higher concentration 300 mM only needle-like aggregates (32.6 ± 3.4 nm) nm thick were observed for KA6K. These appear to be disordered aggregates as defined spots were not observed by X-ray diffraction (data not shown).The isoelectric point of KA6E and KA6K were calculated to be 10.6 and 6.94 respectively. The pH values for KA6E and KA6K in Fig. 1 were 4 and 1 respectively, with a net charge at pH 7 of 0 (KA6E) and +2 (KA6K).23 The increased electrostatic repulsion between KA6K molecules does not allow for the peptide to form self-assembled fibrils. We will therefore focus in the remainder of this paper on KA6E which forms β-sheet based fibrils and which undergoes hydrogels. We were motivated to develop enzyme-responsive hydrogels based on KA6E. We used elastase as enzyme since the alanine-repeat domain in KA6E is a substrate for this enzyme. Because the proteolytic activity of elastase has an optimum pH of 8.0–8.5,24 thus further studies were performed in Trizma buffer at pH 8.
KA6E in Trizma buffer at pH 8 formed solutions at concentrations lower than 42.8 mM and free-standing gels for higher concentrations. The pH of the samples was around 8 for KA6E concentrations decreasing from 7 to 85.5 mM.
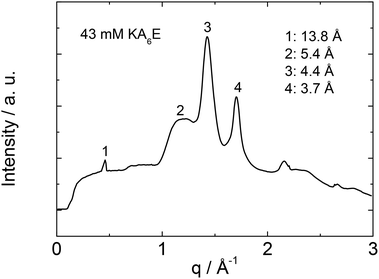
X-ray diffraction was performed to investigate the secondary structure of KA6E. Similar profiles were obtained from stalks and gels, a representative intensity profile being shown in Fig. 2. As discussed recently for the related peptides A6R25 and A12R2,26 the observed 5.4 Å peak is assigned to the stacking distance of alanine-rich β-sheets (these can pack with a much smaller β-sheet spacing than typical for amyloid-forming peptides with other residues in the core β-sheet forming domain27). The 4.4 Å peak arises from the peptide strand spacing within the β-sheets25,26 and the 3.7 Å spacing is associated with diffraction from planes containing the Cα unit.26 An additional sharp peak is observed with d = 13.8 Å. This is the second order reflection from a layer structure observed by SAXS (vide infra). The layer spacing d = 27 Å is consistent with the estimated length of the peptide (8 × 3.4 Å = 27 Å) in an antiparallel β-sheet.28 This spacing is consistent with an up-down arrangement of the molecules (with no stagger) which is expected to be favoured based on electrostatics (i.e. oppositely charged termini are side-by-side).
Fig. 3 shows that KA6E forms free-standing gels at sufficiently high concentration in Trizma buffer. Upon addition of enzyme at a molar ratio MrE = 2.3 × 10³, de-gelation was observed. MrE = 2.3 × 10³ was selected because under these conditions macroscopic evidence of the gel breakup was observed. This is ascribed to the breakup of the physically entangled fibrillar network, as evidenced shortly through a combination of spectroscopic and microscopic techniques.
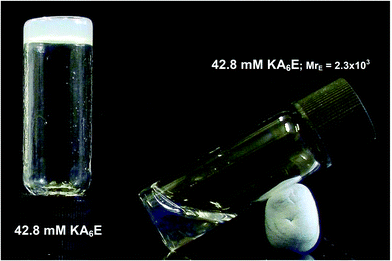 | ||
| Fig. 3 Free standing gel containing 42.8 mM KA6E in Trizma pH 8, and solution obtained after adding elastase to a 42.8 mM KA6E gel at a molar ratio MrE = 2.3 × 10³. | ||
CD spectra under similar conditions to those for Fig. 3 are presented in Fig. 4. Similarly to the spectrum in water (Fig. 1), the spectrum for KA6E in buffer shows β-sheet features, however these are eliminated upon addition of elastase and a spectrum of a disordered peptide conformation is observed. This is consistent with the breakup of the KA6E fibrils (the CD spectrum of elastase in water itself does not show strong secondary structure characteristics,29 and we found the same for elastase in Trizma buffer, data not shown).
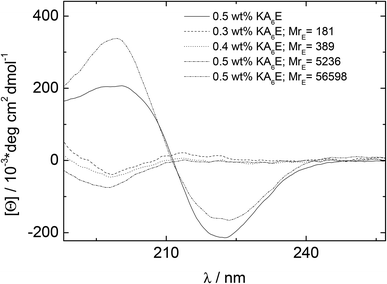 | ||
| Fig. 4 CD results measured for 0.5 wt% KA6E Trizma pH 8, and samples containing (0.30–0.5) wt% KA6E with MrE ∼ (180–57000). | ||
FTIR spectra in the amide I′ region shown in Fig. 5 support these conclusions, since the 1617/1686 cm−1 β-sheet features disappear on addition of elastase. Elastase itself has predominantly β-sheet structure (e.g. PDB file: 3EST),30 although the FTIR spectrum at 0.02 mM is very weak (Fig. 5).
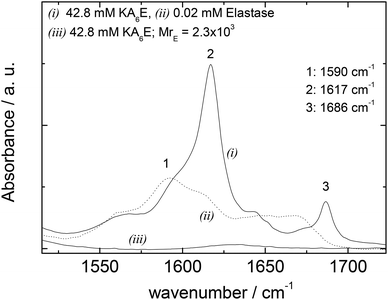 | ||
| Fig. 5 FTIR data for 42.8 mM KA6E, 0.02 mM elastase and a mixture (42.8 mM KA6E; MrE = 2.3 × 10³), in Trizma pH 8. | ||
A fluorescamine fluorescence assay was performed to confirm the existence of free amide groups in the solution. The emission fluorescence spectrum of the fluorescamine was characterised by a broad maxima centred at 475 nm (results not shown). Fig. 6 shows the emission intensity at 475 nm measured for samples containing only KA6E with 0.45 μM fluorescamine. The results show the existence of free amine groups in the solution, probably because the fluorescamine interacts with the peptide terminus. Fig. 6 also shows the fluorescence for the same KA6E with 0.45 μM fluorescamine samples, ∼30 minutes after adding 1 × 10⁻³ wt% elastase to them (KA6E + Elastase, circles). The presence of elastase in solution increases the fluorescence emission at 475 nm, denoting the cleavage of the peptide by the enzyme.31 The fluorescence measured for control solutions containing 0.45 μM fluorescamine or 1 × 10⁻³ wt% elastase + 0.45 μM fluorescamine is very weak, and therefore has been omitted in Fig. 6.
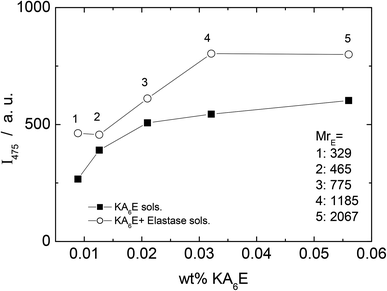 | ||
| Fig. 6 Fluorescamine assay. Plot of fluorescence emission of fluorescamine at 475 nm versus KA6K concentration with (circle) and without (square) elastase. | ||
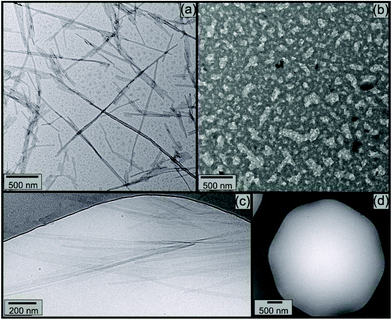
Electron microscopy was used to image nanostructures, and the influence of elastase. Fig. 7 shows TEM and separate cryo-TEM images. TEM image in Fig. 7a and b shows that (32.1 ± 8.2) nm thick tapes formed for 7 mM KA6E (Fig. 7a), are destroyed for 7 mM KA6E, MrE = 2.3 × 10³ solutions in Trizma pH 8 (Fig. 7b). Similarly, while cryo-TEM images for 14 mM KA6E show (25 ± 5) nm thick tapes (Fig. 7c), cryo-TEM grids for 14 mM KA6E, MrE = 2.3 × 10³ solutions were mostly empty (Fig. 7d).
Small-angle X-ray scattering (SAXS) is a powerful in situ method to probe self-assembled nanostructures. Synchrotron SAXS was used to investigate the structure of KA6E in buffer with and without elastase. Fig. 8 shows the data along with model fits to the form factor intensity profiles. For KA6E, which forms β-sheets stacking into tape-like fibrils, we used a model of a Gaussian bilayer with a structure factor corresponding to the Caillé model of multi-layer systems. We have recently used this model to describe the SAXS profile from several peptide amphiphiles, and further details of the model can be found in these papers.32 The peak at q = 0.23−1 corresponds to a spacing d = 27 Å, as mentioned above a second order reflection associated with this spacing is identified by XRD. This periodicity is equal to the estimated length of the KA6E molecule and from this we infer up-down side-side stacking of the molecules within a layered structure. The parameters obtained from the fit of the SAXS data are listed in Table 1.
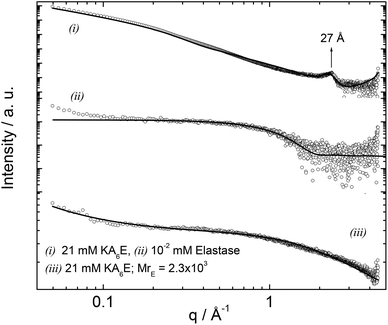 | ||
| Fig. 8 SAXS curves measured for 21 mM KA6E, MrE = 2.3 × 10³, in Trizma pH 8 and the corresponding controls. The full lines represent the fitting to the data as described in the text. | ||
| Sample | l T [Å] | ρ H [rel. units] | ρ C [rel. units] | σ C [Å] | N | d [Å] | η | R G [Å] | ν 1 | I o [rel. units] | C 2 [rel. units] | C 3 |
|---|---|---|---|---|---|---|---|---|---|---|---|---|
| 21 mM KA6E | 30.6 ± 4.58 | 2 × 10⁻⁴ | 3.5 × 10⁻⁴ | 5.3 | 4 | 27 | 0.1 | — | — | — | 8 | 2 |
| 21 mM KA6E; MrE = 2.3 × 10³ | — | — | — | — | — | — | — | 7 | 1 | 38.8 | 0.7 | 1.2 |
The form factor of elastase was computed from the published crystal structure (as described in the SAXS Theory section). It agrees very well with the data. Upon addition of elastase, the fibrils break up (as confirmed by TEM and spectroscopic techniques discussed above), therefore the form factor was fitted using a Gaussian coil model already described in the Experimental section. The parameters obtained from the SAXS fit are listed in Table 1.
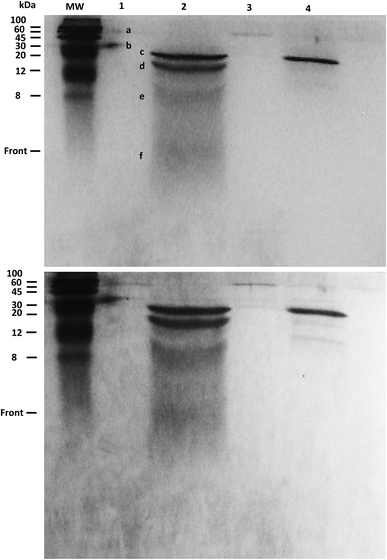
The products of KA6E cleavage by elastase were analyzed using SDS-PAGE, a technique that separates molecules (peptides) according to their mass. Due to the fact that KA6E has a mass lower than 10 kDa, this technique only gives broad information on the mass of the PA and its cleaved fragments. In addition, gels with a high percentage of polyacrylamide (15%) were used (Fig. 9). The undigested peptide (lane 1) was not observed in the expected region of migration (∼1 kDa), probably due to limitations of the technique. In particular, we were not able to run molecular markers with masses comparable to those of the PA, whereas the front of sample migration (i.e., migration of bromophenol blue) is around 5 kDa. Despite this, bands were observed at 60 and 30 kDa (bands a and b) which may be due to peptide aggregates. These bands were not present for the peptide/elastase mixture in lane 2, but were detected in lane 3 (peptide/elastase with lower concentrations of both KA6E and elastase). The elastase enzyme (lane 4) appeared as three separate bands, one at ∼25 kDa (c) and what were probably autocleavage products of ∼15 + 8 + 5 kDa (d + e + f, respectively). The same pattern is also evident in lane 2, where a greater amount of elastase was added to the peptide. In summary, SDS-PAGE suggests that peptide aggregates seem to disappear after incubation with higher elastase concentrations, which provides indirect evidence of KA6E cleavage. Electrospray mass spectrometry data (not shown) also confirmed cleavage of the peptide, with a strong peak at m/z = 431 which is assigned to a fragment KA4 or A4E.
Conclusions
The self-assembly of two telechelic amphiphilic peptides has been studied in aqueous solution. The di-cationic peptide KA6K does not self-assemble in aqueous solution over the extensive range of concentrations examined, instead the formation of crystals is observed at higher concentration. The inability of KA6K to form self-assembled structures such as β-sheet fibrils is ascribed to unfavourable repulsion between the terminal lysine residues.In complete contrast, favorable interactions between the termini in the catanionic peptide KA6E enable self-assembly into tape-like fibrils at low concentration. The fibrils comprise layers a single molecule thick of KA6E molecules, presumably arranged in an up-down side-to-side arrangement due to favorable electrostatic interactions between the oppositely charged termini as suggested by XRD data.
At a sufficiently high concentration, hydrogelation is observed for KA6E, which is driven by the formation of a fibrillar network structure. The enzymatic degradation of the hydrogel by elastase, for which alanine repeat sequences are substrates, was observed. SDS-PAGE and TEM indicate that peptide aggregates are disrupted in the presence of the enzyme whilst at a molecular level FTIR, CD and SAXS show the breakup of the self-assembled β-sheet fibrillar nanostructure.
Given its remarkably simple design and short peptide sequence, KA6E may serve as a useful model system for further studies of elastase degradation. In further work, we also plan to investigate the biocompatibility of the hydrogels and their use in topical applications. Potential applications in regenerative medicine, associated with the selective uptake of elastase (which disrupts collagen leading to tissue degeneration), will also be explored.
Acknowledgements
This work was supported by BBSRC grant BB/I008187/1. We acknowledge access to the Chemical Analysis Facility at the University of Reading. We are grateful to the ESRF for the award of beamtime on BM29 (ref. MX-1511) and to Adam Round for assistance with the SAXS experiments.References
- (a) B. K. Mann, A. S. Gobin, A. T. Tsai, R. H. Schmedlen and J. L. West, Biomaterials, 2001, 22, 3045–3051 CrossRef CAS; (b) J. J. Rice, M. M. Martino, L. De Laporte, F. Tortelli, P. S. Briquez and J. A. Hubbell, Adv. Healthcare Mater., 2013, 2, 57–71 CrossRef CAS PubMed.
- A. Janoff, Annu. Rev. Mater. Res., 1985, 36, 207–216 CAS.
- N. J. Trengove, M. C. Stacey, S. Macauley, N. Bennett, J. Gibson, F. Burslem, G. Murphy and G. Schultz, Wound Repair Regen., 1999, 7, 442–452 CrossRef CAS.
- C. M. Bellingham, M. A. Lillie, J. M. Gosline, G. M. Wright, B. C. Starcher, A. J. Bailey, K. A. Woodhouse and F. W. Keeley, Biopolymers, 2003, 70, 445–445 CrossRef CAS PubMed.
- S. Marqusee, V. H. Robbins and R. L. Baldwin, Proc. Natl. Acad. Sci. U. S. A., 1989, 86, 5286–5290 CrossRef CAS.
- J. Makowska, S. Rodziewicz-Motowidlo, K. Baginska, J. A. Vila, A. Liwo, L. Chmurzynski and H. A. Scheraga, Proc. Natl. Acad. Sci. U. S. A., 2006, 103, 1744–1749 CrossRef CAS PubMed.
- A. S. Gobin and J. L. West, FASEB J., 2002, 16, 751 CAS.
- (a) B. L. Thiel, K. B. Guess and C. Viney, Biopolymers, 1997, 41, 703–719 CrossRef CAS; (b) B. An, J. E. Jenkins, S. Sampath, G. P. Holland, M. Hinman, J. L. Yarger and R. Lewis, Biomacromolecules, 2013, 13, 3938–3948 Search PubMed.
- (a) S. Vauthey, S. Santoso, H. Gong, N. Watson and S. Zhang, Proc. Natl. Acad. Sci. U. S. A., 2002, 99, 5355–5360 CrossRef CAS PubMed; (b) X. B. Zhao, F. Pan, H. Xu, M. Yaseen, H. H. Shan, C. A. E. Hauser, S. G. Zhang and J. R. Lu, Chem. Soc. Rev., 2010, 39, 3480–3498 RSC.
- H. G. Cui, E. T. Pashuck, Y. S. Velichko, S. J. Weigand, A. G. Cheetham, C. J. Newcomb and S. I. Stupp, Science, 2010, 327, 555–559 CrossRef CAS PubMed.
- V. Castelletto, D. Nutt, I. W. Hamley, S. Bucak, C. Cenker and U. Olsson, Chem. Commun., 2010, 46, 6270–6272 RSC.
- S. Bucak, C. Cenker, I. Nasir, U. Olsson and M. Zackrisson, Langmuir, 2009, 25, 4262–4265 CrossRef CAS PubMed.
- J. Madine, V. Castelletto, I. W. Hamley and D. A. Middleton, Angew. Chem., 2013, 52, 10537–10540 Search PubMed.
- A. Fujie, T. Komoto, M. Oya and T. Kawai, Makromol. Chem.-Macromol. Chem. Phys., 1973, 169, 301–321 CrossRef CAS.
- (a) J. Makowska, K. Baginska, A. Skwierawska, A. Liwo, L. Chmurzynski and H. A. Scheraga, Biopolymers, 2008, 90, 772–782 CrossRef CAS PubMed; (b) Z. S. Shi, C. A. Olson, G. D. Rose, R. L. Baldwin and N. R. Kallenbach, Proc. Natl. Acad. Sci. U. S. A., 2002, 99, 9190–9195 CrossRef CAS PubMed; (c) K. Chen, Z. G. Liu and N. R. Kallenbach, Proc. Natl. Acad. Sci. U. S. A., 2004, 101, 15352–15357 CrossRef CAS PubMed.
- R. Hussain, T. S. Javorfi and G. Siligardi, J. Synchrotron Radiat., 2012, 19, 132–135 CrossRef PubMed.
- (a) G. Pabst, M. Rappolt, H. Amenitsch and P. Laggner, Phys. Rev. E: Stat. Phys., Plasmas, Fluids, Relat. Interdiscip. Top., 2000, 62, 4000–4008 CrossRef CAS; (b) A. Caille, C. R. Seances Acad. Sci., Ser. B, 1972, 274, 891–893 CAS; (c) R. Zhang, R. M. Suter and J. F. Nagle, Phys. Rev. E: Stat. Phys., Plasmas, Fluids, Relat. Interdiscip. Top., 1994, 50, 5047–5060 CrossRef CAS.
- (a) M. V. Petoukhov, D. Franke, A. V. Shkumatov, G. Tria, A. G. Kikhney, M. Gajda, C. Gorba, H. D. T. Mertens, P. V. Konarev and D. I. Svergun, J. Appl. Crystallogr., 2012, 45, 342–350 CAS; (b) D. Svergun, C. Barberato and M. H. J. Koch, J. Appl. Crystallogr., 1995, 28, 768–773 CrossRef CAS.
- J. Jakoncic, db file 2V0B. DOI:10.2210/pdb2v0b/pdb.
- M. Born and H. S. Green, Proc. R. Soc., 1946, A188, 10–18 CrossRef.
- (a) H. Gaussier, H. Morency, M. C. Lavoie and M. Subirade, Appl. Environ. Microbiol., 2002, 68, 4803–4808 CrossRef CAS; (b) J. T. Pelton and K. R. McLean, Anal. Biochem., 2000, 277, 167–176 CrossRef CAS PubMed.
- (a) A. F. Drake, G. Siligardi and W. A. Gibbons, Biophys. Chem., 1988, 31, 143–146 CrossRef CAS; (b) G. Siligardi and A. F. Drake, Biopolymers, 1995, 37, 281–292 CrossRef CAS PubMed.
- http://www.innovagen.se, in 2013.
- (a) J. Bieth, B. Spiess and C. G. Wermuth, Biochem. Med., 1974, 11, 350–357 CrossRef CAS; (b) J. Bieth, in Elastases: Structure, Function and Pathological Role, ed. J. Bieth, G. Collin-Lapinet and L. Robert, Basel, 1978 Search PubMed.
- I. W. Hamley, A. Dehsorkhi and V. Castelletto, Chem. Commun., 2013, 49, 1850–1852 RSC.
- I. W. Hamley, A. Dehsorkhi, V. Castelletto, J. Seitsonen, J. Ruokolainen and H. Iatrou, Soft Matter, 2013, 9, 4794–4801 RSC.
- L. C. Serpell, Biochim. Biophys. Acta, Bioenerget., 2000, 1502, 16–30 CrossRef CAS.
- T. E. Creighton, Proteins. Structures and Molecular Properties, W.H. Freeman, 1993 Search PubMed.
- L. Visser and E. R. Blout, Biochemistry, 1971, 10, 743–752 CrossRef CAS.
- E. Meyer, G. Cole, R. Radhakrishnan and O. Epp, Acta Crystallogr., Sect. B: Struct. Sci., 1988, 44, 26–38 CrossRef.
- A. A. Aimetti, M. W. Tibbitt and K. S. Anseth, Biomacromolecules, 2009, 10, 1484–1489 CrossRef CAS PubMed.
- (a) V. Castelletto, G. Cheng, C. Stain, C. J. Connon and I. W. Hamley, Langmuir, 2012, 28, 11599–11608 CrossRef CAS PubMed; (b) V. Castelletto, R. J. Gouveia, C. J. Connon and I. W. Hamley, Faraday Discuss., 2013, 166, 381–397 RSC.
| This journal is © The Royal Society of Chemistry 2014 |

