“Turn-on” fluorescent sensor array for basic amino acids in water†
Tsuyoshi
Minami
a,
Nina A.
Esipenko
a,
Ben
Zhang
b,
Lyle
Isaacs
*b and
Pavel
Anzenbacher
Jr.
*a
aDepartment of Chemistry and Center for Photochemical Sciences, Bowling Green State University, Bowling Green, Ohio 43403, USA. E-mail: pavel@bgsu.edu; Fax: +1-419-372-9809; Tel: +1-419-372-2080
bDepartment of Chemistry and Biochemistry, University of Maryland, College Park, Maryland 20742, USA
First published on 1st November 2013
Abstract
Amino acids and their derivatives are recognized and analyzed in water using a turn-on fluorescent cucurbituril based sensor array. Multivariate analysis (LDA and HCA) clearly shows that the sensor array can discriminate amino acids from the corresponding amines which are produced by the action of amino acid decarboxylases.
Amino acids are the essential components of life processes. Sensing of amino acids is necessary in diverse fields such as nutritional analysis,1 and the diagnosis of Alzheimer disease2 and pancreatitis.3 Amino acid analysis is usually performed by chromatographic4 or electrochemical5 methods. These techniques are relatively expensive and require trained personnel. Hence, methods amenable to high-throughput assays that require low-cost instrumentation are desirable.
Supramolecular receptors and chemosensors for detection and recognition of amino acids have been reported.6 To devise supramolecular sensor arrays for amino acids, we focused on cucurbit[n]uril receptors (CB[n]) capable of binding protonated amines via ion–dipole interactions and hydrogen bonding to the C![[double bond, length as m-dash]](https://www.rsc.org/images/entities/char_e001.gif) O moieties of the ureidyl portals.7 Previously, CB[n]s have been used in fluorescent or colourimetric sensors, however, the nonchromophoric nature of these molecules limits their applications to dye displacement assays.8 To the best of our knowledge, “turn-on” fluorescent sensor arrays for detection of amino acids in water have never been reported.
O moieties of the ureidyl portals.7 Previously, CB[n]s have been used in fluorescent or colourimetric sensors, however, the nonchromophoric nature of these molecules limits their applications to dye displacement assays.8 To the best of our knowledge, “turn-on” fluorescent sensor arrays for detection of amino acids in water have never been reported.
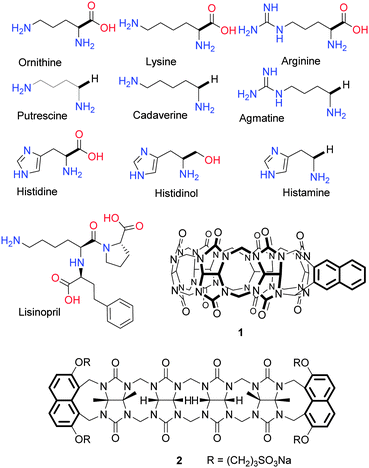
To obtain “turn-on” fluorescent sensors for amino acids, we used fluorescent cucurbituril derivatives,9 probes 1 and 2 (Fig. 1). Both probes display cross-reactive10 binding of a number of amines and amino acids. Probe 1 which is derived from the rigid cucurbit[6]uril macrocyclic receptor displays higher affinity for small guests, whereas flexible acyclic receptor 2 binds preferably larger molecules, thus displaying a complementary selectivity, which enables recognition and quantification of structurally varied analytes. The fluorescence signal in both probes originates from the naphthalene fluorophores whose fluorescence is partly quenched by Eu3+ ion coordinated to the C![[double bond, length as m-dash]](https://www.rsc.org/images/entities/char_e001.gif) O moieties.11 This quenching is due to the energy transfer (antenna effect) from the naphthalene moieties to the Eu3+ ion. The Eu3+ luminescence is not, however, observed due to water molecules coordinated to the Eu3+.12 The naphthalene fluorescence is recovered when the analyte displaces the Eu3+ from the probe–Eu3+ complex (“turn-on” response). Simultaneously, the fluorescence output of the probe–guest complex is modulated by the structural features of the guest. Because different guests are accommodated by probe 1 and 2 with different affinity, the degree of fluorescence recovery is also unique to the guest. Thus, combining both probes in one sensor array results in a high-performance assay capable of recognizing multiple amino acid-related analytes.
O moieties.11 This quenching is due to the energy transfer (antenna effect) from the naphthalene moieties to the Eu3+ ion. The Eu3+ luminescence is not, however, observed due to water molecules coordinated to the Eu3+.12 The naphthalene fluorescence is recovered when the analyte displaces the Eu3+ from the probe–Eu3+ complex (“turn-on” response). Simultaneously, the fluorescence output of the probe–guest complex is modulated by the structural features of the guest. Because different guests are accommodated by probe 1 and 2 with different affinity, the degree of fluorescence recovery is also unique to the guest. Thus, combining both probes in one sensor array results in a high-performance assay capable of recognizing multiple amino acid-related analytes.
Because of the potential importance of assays to detect the conversion of an amino acid to amines as well as detection of drugs in biomedical applications we selected the following 10 analytes: ornithine, putrescine, lysine, cadaverine, arginine, agmatine, histidine, histidinol, histamine, and lisinopril (Fig. 1). These are substrate–product pairs for amino acid decarboxylase;13 lisinopril is an angiotensin-converting enzyme (ACE) inhibitor.14
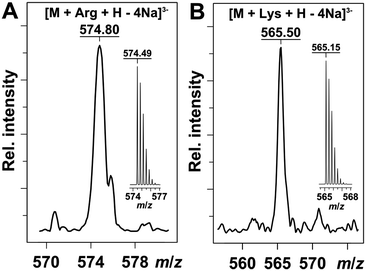
First, the binding of the amino acids to probes was confirmed using a mass spectrometry (Fig. 2). The MS data showed a 1![[thin space (1/6-em)]](https://www.rsc.org/images/entities/char_2009.gif) :
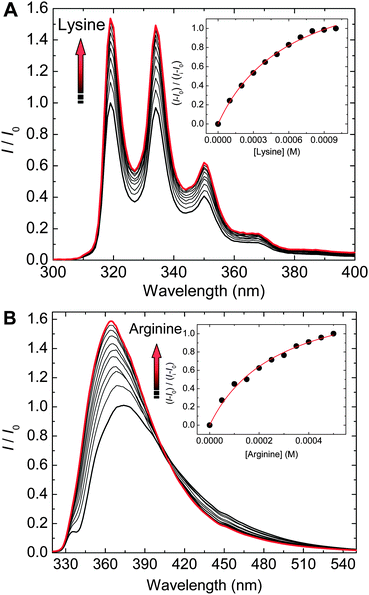
:![[thin space (1/6-em)]](https://www.rsc.org/images/entities/char_2009.gif) 1 binding mode between the probe and the amino acid. Furthermore, fluorescence titration experiments also confirmed the binding of amino acids to probes. Fig. 3A illustrates the fluorescence spectra recorded for a 1–Eu3+ complex upon titration with a lysine solution at pH 7. Here, the fluorescence increases with the increase of lysine concentration. The fluorescence titration of 2 by arginine showed also a fluorescence enhancement (Fig. 3B).
1 binding mode between the probe and the amino acid. Furthermore, fluorescence titration experiments also confirmed the binding of amino acids to probes. Fig. 3A illustrates the fluorescence spectra recorded for a 1–Eu3+ complex upon titration with a lysine solution at pH 7. Here, the fluorescence increases with the increase of lysine concentration. The fluorescence titration of 2 by arginine showed also a fluorescence enhancement (Fig. 3B).
Table 1 displays apparent affinity constants (Kassoc) for the selected amino acids and the corresponding amines. The affinity constants confirm the cross-reactive response as well as size complementarity presumed for probes 1 and 2. Thus, the binding affinity of 2 for a large lisinopril molecule is five times higher than that for 1. The binding constant of 1 for a smaller ornithine is significantly higher than that for 2. This is due to the difference of the probe cavity sizes. Also, one can observe a trend in affinity constants based on the molecular structures of the guests. For example, the magnitude of binding affinities for histidine and the related compounds follows the order histamine > histidinol > histidine. The presence of a carboxyl group lowers the binding affinity presumably due to electrostatic repulsion between the ureidyl C![[double bond, length as m-dash]](https://www.rsc.org/images/entities/char_e001.gif) O moieties of the probes and the carboxy oxygens of amino acids. The difference in binding affinities is expected to contribute to discrimination of amino acids from the corresponding amines in an array-based assay.
O moieties of the probes and the carboxy oxygens of amino acids. The difference in binding affinities is expected to contribute to discrimination of amino acids from the corresponding amines in an array-based assay.
| Host | Guest | |||||||||
|---|---|---|---|---|---|---|---|---|---|---|
| Ornithine | Putrescine | Lysine | Cadaverine | Arginine | Agmatine | Histidine | Histidinol | Histamine | Lisinoprilb | |
| a The titrations recorded in the presence of Eu3+ (300 μM) and Kassocs were calculated based on the change in fluorescence intensity upon addition of each guest in water at pH 7. The errors of the curve fitting were <20%. b The titration was carried out in water at pH 3 to increase the solubility. c K assoc could not be calculated due to the insufficient change in fluorescence response. | ||||||||||
| 1 | 9.9 × 10² | >106 | 1.6 × 10³ | >106 | 1.8 × 10³ | >106 | 1.7 × 10³ | 2.9 × 10³ | 1.7 × 10⁴ | 7.2 × 10² |
| 2 | NDc | 1.9 × 10⁴ | 3.4 × 10² | >106 | 1.5 × 10³ | >106 | NDc | 1.5 × 10³ | 6.4 × 10³ | 3.8 × 10³ |
To test this hypothesis the responses of probes were recorded as fluorescence intensities at 320 and 370 nm from probe–Eu3+–guest solutions using conventional 1536-well microplates (see the ESI† for a detailed description). The response data sets were acquired in the form of a guest (X) × [Eu3+] (Y) × λEm (Z) (probe, metal, emission wavelength) matrix, each XiYiZi field being associated with a various degree of fluorescence enhancement. Pattern recognition protocols were then used to reveal the guest-specific trends in the overall response.
Linear discriminant analysis (LDA)15 using leave-one-out cross-validation was performed. LDA demonstrated that the array can clearly discriminate 10 analytes and a control. Fig. 4 describes the response space defined by the first three canonical factors (F1–F3), showing that 95% of variance is enough to discriminate the analytes. The Jackknife cross-validation yields 100% correct classification of all 220 data-points (corresponding to 10 analytes and control).
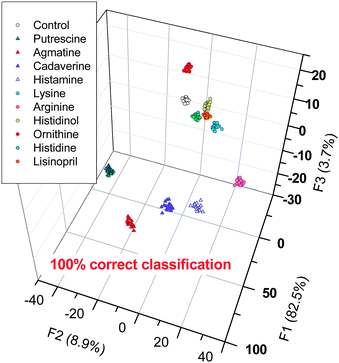 | ||
| Fig. 4 LDA canonical score plot for the response of the sensors array to ten analytes (and control) in water. The cross-validation routine shows 100% correct classification. For more details see the ESI.† | ||
Furthermore, hierarchical clustering analysis (HCA)15 was carried out. As a significant difference between LDA and HCA, HCA does not reduce dimensions of the datasets, in other words, obtained distances between clusters in HCA correspond to similarities in behaviour of the original samples. Importantly, the HCA dendrogram (Fig. 5) displayed the 100% correct classification. In the dendrogram, two main analyte clusters are distinguished: amines on the right side and amino acids on the left side. This shows that the sensor array can discriminate amino acids from the corresponding products of amino acid decarboxylation.
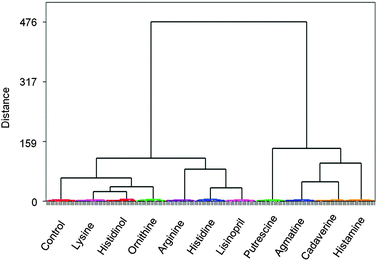 | ||
| Fig. 5 Hierarchical clustering analysis (HCA) dendrogram (Ward linkages, Pearson distances) display s the analysis of all 11 classes (total of 220 trials) and perfect 100% correct classification. | ||
In summary, we demonstrated a simple yet reliable microarray approach utilising two complementary cucurbit[n]uril-type receptors to discriminate basic amino acids from the corresponding amines in water. The qualitative analysis of 10 biologically relevant analytes by LDA and HCA yield 100% correct classification, which confirms the excellent guest-recognition properties of the probes. To the best of our knowledge, this is the first report of a turn-on fluorescent microarray utilizing directly fluorescent sensors for amino acids in water. We believe that these results open up an avenue for development of future array sensors for detection of amino acids in biomedical applications.
L.I. acknowledges support from NSF (CHE-1110911); P.A. acknowledges support from NSF (CHE-0750303 and DMR-1006761).
References
- M. Freidman, J. Agric. Food Chem., 1999, 47, 3457 CrossRef PubMed.
- A. D'Aniello, A. Vetere, G. H. Fisher, G. Cusano, M. Chavez and L. Petrucelli, Brain Res., 1992, 592, 44 CrossRef CAS.
- R. E. Ionescu, S. Cosnier and R. S. Marks, Anal. Chem., 2006, 78, 6327 CrossRef CAS PubMed.
- J. Le Boucher, C. Charret, C. Coudray-Lucas, J. Giboudeau and L. Cynober, Clin. Chem., 1997, 43, 1421 CAS.
- G. L. Luque, N. F. Ferreyra and G. A. Rivas, Talanta, 2007, 71, 1282 CrossRef CAS PubMed.
- L. Fabbrizzi, M. Licchelli, G. Rabaioli and A. Taglietti, Coord. Chem. Rev., 2000, 205, 85 CrossRef CAS.
- J. Lagona, P. Mukhopadhyay, S. Chakrabarti and L. Isaacs, Angew. Chem., Int. Ed., 2005, 44, 4844 CrossRef CAS PubMed.
- (a) L. A. Baumes, M. Buaki, J. Jolly, A. Corma and H. Garcia, Tetrahedron Lett., 2011, 52, 1418 CrossRef CAS PubMed; (b) A. Hennig, H. Bakirci and W. M. Nau, Nat. Methods, 2007, 4, 629 CrossRef CAS PubMed; (c) D. M. Bailey, A. Hennig, V. D. Uzunova and W. M. Nau, Chem.–Eur. J., 2008, 14, 6069 CrossRef CAS PubMed; (d) J. Lagona, B. D. Wagner and L. Isaacs, J. Org. Chem., 2006, 71, 1181 CrossRef CAS PubMed.
- (a) D. Lucas, T. Minami, G. Iannuzzi, L. Cao, J. B. Wittenberg, P. Anzenbacher, Jr. and L. Isaacs, J. Am. Chem. Soc., 2011, 133, 17966 CrossRef CAS PubMed; (b) T. Minami, N. A. Esipenko, B. Zhang, M. E. Kozelkova, L. Isaacs, R. Nishiyabu, Y. Kubo and P. Anzenbacher, Jr., J. Am. Chem. Soc., 2012, 134, 20021 CrossRef CAS PubMed; (c) T. Minami, N. A. Esipenko, A. Akdeniz, B. Zhang, L. Isaacs and P. Anzenbacher Jr., J. Am. Chem. Soc., 2013, 135, 15238 CrossRef CAS PubMed.
- Review, see: (a) J. J. Lavigne and E. V. Anslyn, Angew. Chem., Int. Ed., 2001, 40, 3118 CrossRef CAS; (b) P. Anzenbacher, Jr., P. Lubal, P. Bucek, M. A. Palacios and M. E. Kozelkova, Chem. Soc. Rev., 2010, 39, 3954 RSC ; current examples, see: ; (c) N. A. Esipenko, P. Koutnik, T. Minami, L. Mosca, V. M. Lynch, G. V. Zyryanov and P. Anzenbacher, Jr., Chem. Sci., 2013, 4, 3617 RSC; (d) P. Anzenbacher, Jr., Y. Liu, M. A. Palacios, T. Minami, Z. Wang and R. Nishiyabu, Chem.–Eur. J., 2013, 19, 8497 CrossRef PubMed; (e) Y. Liu, T. Minami, R. Nishiyabu, Z. Wang and P. Anzenbacher, Jr., J. Am. Chem. Soc., 2013, 135, 7705 CrossRef CAS PubMed.
- A. A. Tripolskaya, E. A. Mainicheva, T. V. Mit'kina, O. A. Geras'ko, D. Yu. Naumov and V. P. Fedin, Russ. J. Coord. Chem., 2005, 31, 768 CrossRef CAS PubMed.
- A. P. de Silva, H. Q. N. Gunaratne, T. Gunnlaugsson, A. J. M. Huxley, C. P. McCoy, J. T. Rademacher and T. E. Rice, Chem. Rev., 1997, 97, 1515 CrossRef CAS PubMed.
- (a) A. S. Tippens, S. V. Davis, J. R. Hayes, E. C. Bryda, T. L. Green and C. A. Gruetter, Inflammation Res., 2004, 53, 390 CAS; (b) M. A. Perez-Amador, J. Leon, P. J. Green and J. Carbonell, Plant Physiol., 2002, 130, 1454 CrossRef CAS PubMed.
- K. L. Goa, M. Haria and M. I. Wilde, Drugs, 1997, 53, 1081 CrossRef CAS PubMed.
- D. L. Massart, B. G. M. Vandeginste, L. M. C. Buydens, S. De Jong, P. J. Lewi and J. Smeyers-Verbeke, Handbook of Chemometrics and Qualimetrics, Elsevier, Amesterdam, 1997 Search PubMed.
Footnote |
| † Electronic supplementary information (ESI) available: Fluorescence titrations, experimental detail of microarray, canonical scores plots and jackknifed classification matrices. See DOI: 10.1039/c3cc47416j |
| This journal is © The Royal Society of Chemistry 2014 |

