Intragastric gelation of whey protein–pectin alters the digestibility of whey protein during in vitro pepsin digestion†
Sha
Zhang
and
Bongkosh
Vardhanabhuti
*
Food Science Program, Division of Food Systems and Bioengineering, University of Missouri, 255 William Stringer Wing, Columbia, MO 65211, USA. E-mail: VardhanabhutiB@missouri.edu; Fax: +1-573-8847964; Tel: +1-573-8821374
First published on 29th October 2013
Abstract
The aim of this work is to investigate the effect of pectin on in vitro digestion of whey protein. Digestion of heated whey protein isolate (WPI) and pectin solutions (WPI–pectin) as influenced by pectin concentration and pH was studied under simulated gastric conditions. Electrophoresis, dynamic light scattering, colorimetric measurements, and gel microstructures were used to study the digestion pattern. At low pectin concentration (0.25% w/w), pectin did not significantly influence the degradation of whey protein. Increasing the pectin concentration to 1% led to extensive intragastric gelation immediately after mixing with simulated gastric fluid. The microstructure of intragastric gel from WPI–pectin at pH 6.0 showed a more interconnected and denser gel network than that at pH 7.0. More protein and pectin were involved in the gelation at pH 6.0 than pH 7.0. The digesta of samples at pH 6.0 was mainly composed of peptides, while that at pH 7.0 mostly consisted of aggregates and crosslinked peptides. This study suggests that WPI–pectin at high biopolymer ratio formed intragastric gel in simulated gastric models, which could delay protein digestion and potentially slow gastric emptying and promote satiety.
Introduction
Protein digestion is highly influenced by several factors including gastric conditions (pH and enzyme activity), protein structure, and the presence of other food components in the gastrointestinal (GI) tract. Studies have shown that structural changes of protein induced by food processing such as heating and high pressure treatment can affect the rates and patterns of proteolysis. Native β-lactoglobulin (β-lg) is very resistant to pepsin and chymotrypsin digestion, while thermal treatment significantly increased protein digestibility attributed to the enhanced accessibility of the specific peptide bonds to the enzymes.1–3 Digestion of protein-based emulsions has gained more interest in recent years.4–6 Studies showed that the proteolysis rate of β-lg increased when protein was present in an emulsion due to the adsorption of protein to the oil–water interface, and the resulting partial unfolding of protein improved its accessibility to pepsin.7 The presence of surfactants could further enhance protein hydrolysis through modification of the surface conformation of the proteins and weakening the interconnected surface network.8 Through conformational changes and interaction with other components during food processing, the digestion pattern of proteins could be altered.Dietary fiber is the edible, nondigestible component of carbohydrates and lignin that is intrinsic and intact in plants.9 Not only could they not be digested in the stomach, but some viscous dietary fibers such as gums, pectins, and β-glucans also induce thickening and increase viscosity of intestinal contents.10 The degree of thickening when dietary fibers are exposed to gastric fluid depends on the chemical composition and concentration of the polysaccharides.11 Bakalis et al.12 showed that guar gum increased the viscosity of the fluid and decreased the uptake of other nutrients in a simulated model of human intestine. It is believed that the modified absorption rate of nutrients and thus prolonged presence of nutrients in the small intestine affects the gastric emptying and signaling to the central nervous system which controls satiety hormone release.
Though the digestion behavior of protein and polysaccharides in the GI tract has been well studied respectively, few focused on the protein–polysaccharide mixed system. The gastric behavior of each macromolecule could be influenced by the presence of the other(s). For native β-lg, addition of gum arabic, low methylated (LM) pectin and xylan increased the N release during pepsin hydrolysis due to the reduced aggregation and increased solubility of β-lg caused by the formation of electrostatic complexes between polysaccharides and protein.13,14 With regard to heated β-lg, a decrease of β-lg degradation in the presence of pectin was observed, probably induced by local protein–pectin interactions, which decrease the accessibility of cleavage sites to pepsin.15 The interactions between protein and polysaccharides are mainly driven by electrostatic attraction and highly depend on the nature of the macromolecules (such as the size, conformation, and charge density), heating pH, biopolymer ratio and total biopolymer concentrations. None of the current studies has fully investigated how protein–polysaccharide mixed systems with different extent of biopolymer interactions impact their digestion behavior. Furthermore, the effect of polysaccharides on the digestibility of protein is often assessed in diluted systems,15–17 which might overlook the intragastric gelation properties of the polysaccharides.
Protein has been shown to induce satiety and thus could potentially be used for weight management. Though the mechanism is still unclear, the physicochemical properties of protein may play a role in the sensation of fullness and gastric emptying. The presence of polysaccharides in the protein matrix could induce physical and conformational changes of protein, thus affecting the digestibility of protein because the accessibility of cleavage sites to protease on protein could be altered through electrostatic interactions with polysaccharides. On the other hand, it has been suggested that the gastric emptying rate plays an important role in short-term food intake. Foods with a slow degradation rate in stomach might delay gastric emptying, thus increase the feeling of fullness. It has been reported that some viscous polysaccharides could form intragastric gel at certain concentrations and delay gastric emptying. Considering the oppositely charged protein and polysaccharides under gastric conditions, it is highly possible that aggregation or even gelation could occur, which might change the digestion profile of protein and delay gastric emptying.
Accordingly, the aim of this study is to investigate the effect of polysaccharides on in vitro gastric digestion of protein using whey protein–pectin with different extent of biopolymer interactions as a model system. LM pectin was chosen not only because it is highly negatively charged which would favor attractive interactions with protein, but also due to its intragastric gelation properties as a viscous dietary fiber.
Material and methods
Materials
Whey protein isolate (WPI) was kindly donated by Davisco Food International (BiPro, Le Sueur, MN). As stated by the manufacturer, the powdered WPI was composed of 97.9 wt% protein, 2.1 wt% ash, and 0.3 wt% fat (dry weight basis) and 4.7 wt% moisture (wet weight basis). Pectin LM-12 was the gift from CP Kelco Inc. (Atlanta, GA). It is derived from citrus peels, and has a degree of methyl esterification of 35%. Pepsin was obtained from Sigma-Aldrich (St. Louis, MO). Unless otherwise stated, all of the chemicals used were of analytical grade.Heat treatment of WPI–pectin
Whey protein stock solution (10% w/w) was prepared by dissolving WPI in Millipore water (18.2 MΩ) with continuous stirring for 2 h at ambient temperature. Pectin LM-12 stock solution (4%) was prepared by dissolving pectin in Millipore water at 85 °C for 2 h under continuous stirring. The stock solutions were then kept in the refrigerator (4 °C) overnight for complete hydration. Stock solutions of WPI and pectin were mixed to obtain 5% w/w protein and pectin to WPI weight ratios of 0.05 and 0.2 (0.25% and 1% w/w pectin, respectively) and their pH was adjusted to 6.0, and 7.0. The mixtures were gently mixed before being heated in a temperature-controlled water bath at 85 °C for 30 min and cooled using running tap water.In vitro pepsin digestion
The simulated gastric fluid (SGF) consisted of 0.034 M NaCl and the pH was adjusted to 1.2 using HCl. Pepsin solution was prepared freshly for each assay by dissolving pepsin in SGF by vortexing several times over a period of 5 min and the resulting solution was placed on ice. The in vitro gastric model consisted of a conical flask (50 mL) containing 5 mL of SGF–pepsin maintained at 37 °C with continuous shaking at 95 rpm in a temperature-controlled water bath. The SGF–pepsin solution was pre-incubated for 5 min before an addition of 3 mL of WPI–pectin solutions. The ratio of pepsin to WPI was 1![[thin space (1/6-em)]](https://www.rsc.org/images/entities/char_2009.gif) :
:![[thin space (1/6-em)]](https://www.rsc.org/images/entities/char_2009.gif) 250 on a weight basis. For WPI–pectin with 0.25% pectin, aliquots (100 μL) were withdrawn into Eppendorf vials containing 70 μL NaOH (0.1 M) to inactivate the enzyme after 0, 2, 5, 10, 20, 30, 60, 120 min of incubation. For WPI–pectin with 1% pectin, gelation was observed after samples were mixed with SGF; therefore, samples were centrifuged to separate the supernatant. Hydrolyzed samples were withdrawn and placed on ice before centrifugation at 5000g for 15 min at 4 °C. The pH of the supernatant was then adjusted to 7.0 using NaOH (1 M and 0.1 M) to irreversibly inactivate the enzyme. The hydrolyzed protein content in the supernatant was measured at 280 nm using a UV-visible spectrophotometer (McKinley Scientific, Sparta, NJ).
250 on a weight basis. For WPI–pectin with 0.25% pectin, aliquots (100 μL) were withdrawn into Eppendorf vials containing 70 μL NaOH (0.1 M) to inactivate the enzyme after 0, 2, 5, 10, 20, 30, 60, 120 min of incubation. For WPI–pectin with 1% pectin, gelation was observed after samples were mixed with SGF; therefore, samples were centrifuged to separate the supernatant. Hydrolyzed samples were withdrawn and placed on ice before centrifugation at 5000g for 15 min at 4 °C. The pH of the supernatant was then adjusted to 7.0 using NaOH (1 M and 0.1 M) to irreversibly inactivate the enzyme. The hydrolyzed protein content in the supernatant was measured at 280 nm using a UV-visible spectrophotometer (McKinley Scientific, Sparta, NJ).
Pectin content measurements
The pectin content in the supernatant of samples with high pectin concentration was measured using a colorimetric method described by Ibarz et al.18 Briefly, 0.5 mL of sample and 0.5 mL distilled water were placed on an ice bath, followed by the addition of 6 mL of 0.0125 M sulphuric–tetraborate solution (sodium tetraborate 0.0125 M in concentrated sulphuric acid). After the mixture was shaken in a vortex mixer, it was heated in a boiling water bath for 5 min, and then immediately placed on an ice bath until reaching room temperature. Color was developed after the addition of 0.1 mL m-hydroxydiphenyl and incubation at room temperature for 20 min. Spectrophotometric absorbance at 520 nm was recorded, and the content of pectin was calculated according to the calibration curve obtained from pure pectin. Three replications were done for all samples.Visible-light turbidity measurements
Turbidity measurements were carried out during pepsin digestion of WPI–pectin with low pectin concentration (0.25%). Samples (200 μL) were withdrawn and placed into a 96-well microplate after 0, 2, 5, 10, 20, 30, 60, 120 min of incubation without pH adjustment. Absorbance at 630 nm was immediately recorded using an Ultra Microplate Reader (BioTek Instruments Inc., Winooski, USA). SGF solution was used as a reference blank. At least three replications were conducted on each sample.Electrophoresis
SDS-PAGE was carried out using a modified Laemmli method. Protein samples were solubilized in Laemmli sample buffer (Bio-Rad Laboratories, Hercules, CA) containing 5% β-mercaptoethanol. For native-PAGE, samples were solubilized with native sample buffer (Bio-Rad Laboratories). Gels (15% acrylamide for resolving gel and 4% acrylamide for stacking gel) were run in a mini Protein II electrophoresis system (Bio-Rad Laboratories) using an electrode stock buffer at a voltage of 120 V. Proteins were stained with Coomassie brilliant blue R250 in an acetic acid–isopropanol–H2O staining solution (3![[thin space (1/6-em)]](https://www.rsc.org/images/entities/char_2009.gif) :
:![[thin space (1/6-em)]](https://www.rsc.org/images/entities/char_2009.gif) 10
10![[thin space (1/6-em)]](https://www.rsc.org/images/entities/char_2009.gif) :
:![[thin space (1/6-em)]](https://www.rsc.org/images/entities/char_2009.gif) 17 by volume), and destained in an acetic acid–isopropanol–H2O solution (3
17 by volume), and destained in an acetic acid–isopropanol–H2O solution (3![[thin space (1/6-em)]](https://www.rsc.org/images/entities/char_2009.gif) :
:![[thin space (1/6-em)]](https://www.rsc.org/images/entities/char_2009.gif) 10
10![[thin space (1/6-em)]](https://www.rsc.org/images/entities/char_2009.gif) :
:![[thin space (1/6-em)]](https://www.rsc.org/images/entities/char_2009.gif) 17 by volume). Unstained molecular weight marker comprising a mixture of protein ranging in size from 5 to 250 kDa was used (PageRuler unstained broad range protein ladder: Thermo Scientific, Rockford, IL). Imaging was accomplished with an AlphaImager system (Alpha Innotech Corporation, Santa Clara, CA).
17 by volume). Unstained molecular weight marker comprising a mixture of protein ranging in size from 5 to 250 kDa was used (PageRuler unstained broad range protein ladder: Thermo Scientific, Rockford, IL). Imaging was accomplished with an AlphaImager system (Alpha Innotech Corporation, Santa Clara, CA).
Dynamic light scattering (DLS) measurements
The particle size distribution of WPI–pectin during in vitro digestion was measured by DLS using a Zetasizer Nano ZS (Malvern Instruments Ltd., Malvern, UK) equipped with a 633 nm laser and 173° detection optics. During the measurement, the laser light was directed and focused on the cuvette with 1.2 mL sample solutions. For each sample, three measurements were conducted with at least 12 runs and each run lasted for 10 s. All experiments were replicated at least twice.Confocal laser scanning microscopy (CLSM)
The microstructure of samples that gelled during digestion was observed using CLSM. Samples were stained with rhodamine B solution (20 μL of a 0.2 wt% solution per mL of sample). Approximately 60 μL of the dyed protein solution was placed into a welled slide, and covered with a 0.17 mm coverslip. Digestion was carried out in situ of the welled slide. SGF solution (40 μL) with and without pepsin was dropped on the welled slide, followed by the addition of 24 μL of sample. The slide was incubated in a continuous shaking water bath (37 °C) at 95 rpm, and the structure was observed in situ by using a Zeiss LSM 510 META confocal laser scanning microscope (Cal Zeiss, Jena, Germany) with 100× and 63× water immersion objectives. An Ar/Kr visible light laser was used with an excitation wavelength of 543 nm. Digital image files were acquired in 1024 pixels × 1024 pixels.Results and discussion
In this study, WPI and pectin were heated at two pH values and pectin concentrations to produce different degrees of interactions between protein and pectin. Particle size and zeta potential measurements were used to characterize the mixture (data not shown). Briefly, higher pH value and higher pectin concentration led to the formation of more negatively charged aggregates, and aggregates formed at pH 6.0 were larger than those formed at pH 7.0 at both pectin concentrations studied. The key difference in the results from the digestion experiment was that samples with higher pectin content (1%) gelled during in vitro gastric digestion while those at lower pectin content (0.25%) did not. Thus, samples with high pectin content were centrifuged and their supernatant was analyzed. The discussion is divided into the effect of pectin on WPI digestion at low pectin and high pectin concentrations.Digestibility of WPI as affected by pectin at low concentration
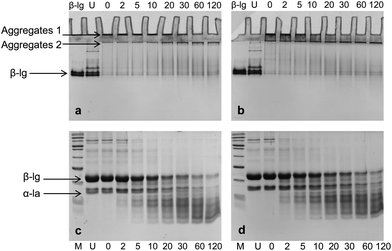
No significant difference was observed between pH 6.0 and pH 7.0 under SDS-PAGE (Fig. 2c and d), though peptide bands appeared to be more intense in pH 7 samples during and after 2 h digestion compared to pH 6.0 samples. As indicated previously, there were still aggregates presented after 2 h digestion, but the dissociation of these aggregates by sample buffer and reducing agent did not give rise to corresponding number of the monomers in the SDS-PAGE. Studies have found that pepsin has favorable properties for generating disulfide linked peptides at its acidic pH optimum.19 It is likely that protein aggregates presented after 2 h digestion were those partially hydrolyzed aggregates, or could be cross-linked peptides derived from partially hydrolyzed protein.
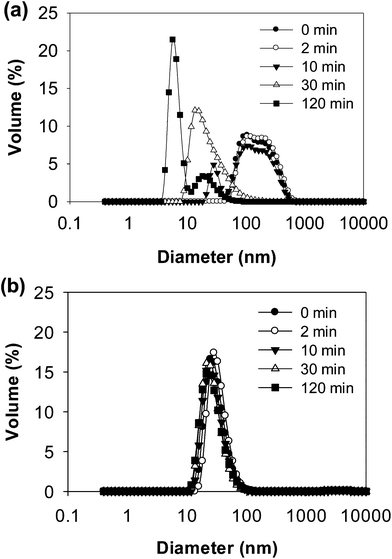 | ||
| Fig. 3 Particle size distributions of WPI–pectin (0.25% pectin) at selected times during in vitro gastric digestion: (a) WPI–pectin at pH 6.0 and (b) WPI–pectin at pH 7.0. | ||
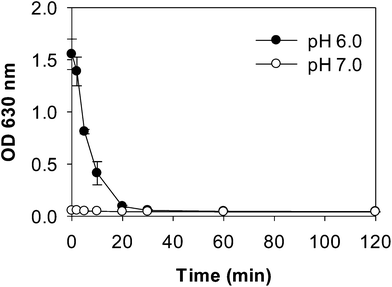
Digestion patterns of whey protein aggregates in the absence of pectin were also evaluated by turbidity, electrophoresis and DLS measurements (Fig. S1–S3†). At pH 7.0, no difference in turbidity was found between WPI and WPI–pectin samples throughout digestion. At pH 6.0, heated WPI (without pectin) was more turbid than heated WPI–pectin. After mixing with SGF, the initial turbidity of the WPI and pepsin mixture was lower than that of WPI–pectin. This is because the oppositely charged whey protein and pectin could be cross-linked by attractive interactions at gastric pH values for WPI–pectin samples, thus forms larger aggregates showing higher turbidity than WPI in the absence of pectin. Similar to what was observed for WPI–pectin, the mixture of WPI and SGF became a clear solution after digestion for 30 min. No other significant differences of digestion patterns were observed between WPI and WPI–pectin, indicating that the presence of 0.25% pectin in whey protein did not influence the digestibility of whey protein. It has been reported that pectin could reduce the accessibility of cleavage sites of β-lg to protease through local nonspecific protein–pectin interactions.15 The different results observed in this study were probably due to the much higher protein concentration and lower biopolymer ratio.
Digestibility of WPI affected by pectin at high concentration
The microstructures were monitored using CLSM (Fig. 5). WPI–pectin solutions (0.25% pectin) heated at pH 6.0 were homogeneous, and mixing with SGF led to the formation of large aggregates, though no precipitates were observed visually. Similar to those at pH 6.0, WPI–pectin heated solutions (0.25% pectin) at pH 7.0 showed homogeneous structures when mixed with SGF and after 2 h digestion. The aggregate structures were not distinguished due to the limited resolution of CLSM. As expected, the size of WPI–pectin (1% pectin) heated aggregates depends strongly on the pH with much larger aggregates formed at pH 6.0 than pH 7.0. Although both solutions formed gel when mixed with SGF, CLSM showed different gel structures. At pH 6.0, the gels were heterogeneous and protein aggregates were mostly interconnected with each other to form the gel network. At pH 7.0, the gel network was not as interconnected as that of pH 6.0, and some aggregates still remained soluble, as indicated by the red background. After hydrolysis for 2 h by pepsin, the gel structure was maintained, but the aggregates involved in the gel network were degraded into much smaller ones for both pH 6.0 and 7.0.
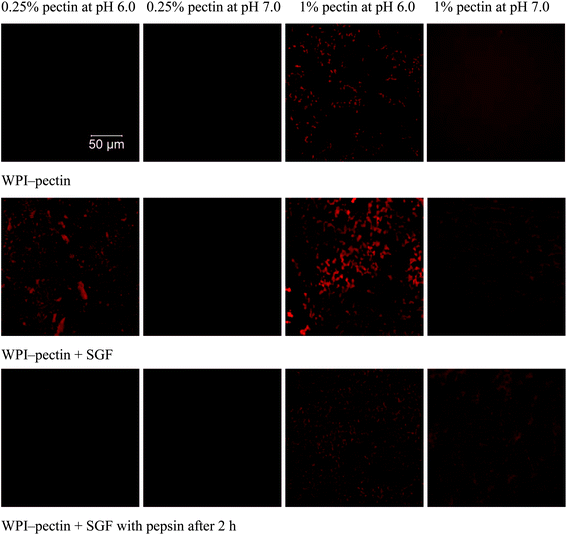 | ||
| Fig. 5 CLSM images of WPI–pectin and mixtures of WPI–pectin and SGF immediately after mixing and after 2 h digestion. | ||
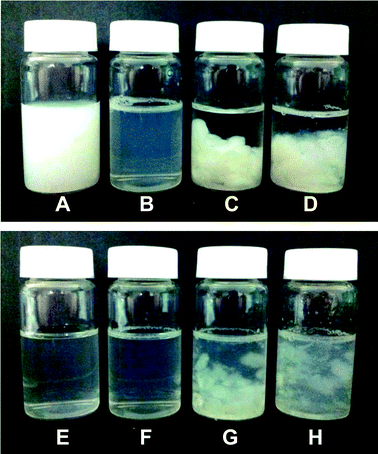
It is expected that the intragastric gelation of WPI–pectin could retard the digestion of whey protein. As shown in Fig. 4G and H, the gels could not be fully digested within 2 h, although they were broken into pieces. It appears that digesta at pH 6.0 had more and larger gel pieces than that at pH 7.0. However, the gel microstructure showed that the remained gel at pH 7.0 has smaller aggregates and less porosity than pH 6.0 after 2 h digestion. To further investigate the digestion patterns of whey protein when forming intragastric gel, the digesta was centrifuged and the supernatant was characterized to study the digestibility of whey protein.
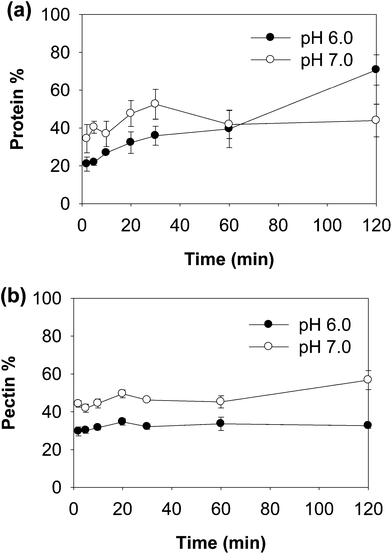 | ||
| Fig. 6 Percentage of protein and peptides (a) and pectin (b) in the supernatant during digestion of WPI–pectin (1% pectin). | ||
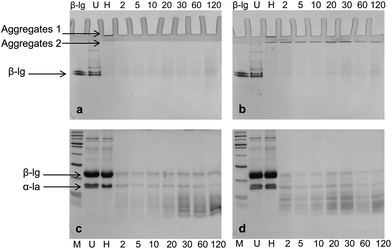
Both native-PAGE and SDS-PAGE were used to investigate the protein and peptide profile in the supernatant (Fig. 7). Similar to what was observed in the native-PAGE of WPI–pectin with 0.25% pectin, WPI–pectin at pH 6.0 resulted in the formation of larger aggregates which could not enter the stacking gel compared to pH 7.0 (Fig. 7a and b, lane 3). The notable difference observed from native-PAGE between pH 6.0 and pH 7.0 is that no aggregate was present in the supernatant of pH 6.0 during 2 h digestion, whereas Aggregates 2 increased in the first 30 min of digestion and further decreased for WPI–pectin at pH 7.0. The results are in agreement with the CLSM data since some proportion of the aggregates was not involved in the gelation and remained soluble in the mixture with SGF. There were very small amounts of β-lg monomers on SDS-PAGE, representing the nonaggregated proteins that were very resistant to pepsin. Compared to faint bands of peptides shown on SDS-PAGE at pH 6.0 during the first 20 min of digestion, the amount of peptides was higher in pH 7.0 samples showing the most intense bands after 30 min of digestion. The peptide content further increased for pH 6.0, but decreased for pH 7.0. The possible reason has been discussed previously. The data presented in the SDS-PAGE were consistent with the protein concentration measurement results.
DLS data further confirmed the results from electrophoresis (Fig. 8). The distributions of particle size during 2 h digestion showed only a single peak for both pH 6.0 and pH 7.0 with 5.952 nm and 31.60 nm, respectively. The small sized peaks shown in samples at pH 6.0 were contributed from the peptides in the supernatant. The large sized peaks at pH 7.0, however, were partially digested aggregates or cross-linked peptides as shown on native-PAGE (Fig. 7b). From both native-PAGE and DLS results, it is clear that almost all of the aggregates in WPI–pectin at pH 6.0 formed intragastric gels, whereas some proportion of the aggregates remained soluble for WPI–pectin at pH 7.0.
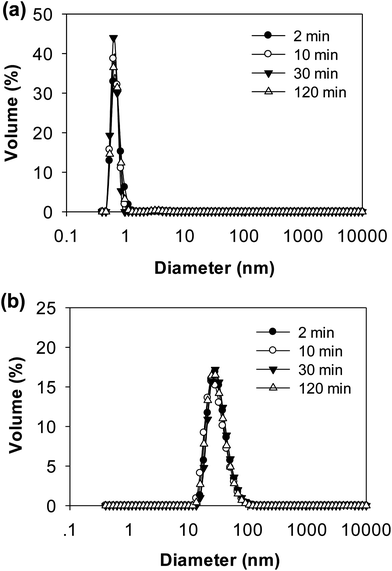 | ||
| Fig. 8 Particle size distributions of the supernatant of WPI–pectin at selected times during in vitro gastric digestion: (a) WPI–pectin (1% pectin) at pH 6.0 and (b) WPI–pectin (1% pectin) at pH 7.0. | ||
Compared to the digestion pattern of WPI–pectin with low pectin content, much smaller amounts of protein aggregates and peptides were detected in the supernatant of WPI–pectin with high pectin content since the majority of the proteins were involved in the gelation immediately after mixing with pepsin solution. The pectin used in this study was highly charged. The interaction between whey protein and pectin is expected to be electrostatic in nature under gastric pH conditions. Indeed, at pH below the pI of WPI, electrostatic complexes were formed driven by the attractive forces between the oppositely charged biopolymers. A number of studies investigated protein–polysaccharide complex coacervates as a function of biopolymer ratio, total biopolymer concentrations, pH, and ionic strength.20–24 All of these factors influence the three dimensional configuration and relative charge density between both biopolymers, which in turn affect the degree of electrostatic interaction between them.25 Under simulated gastric conditions, intragastric gelation was mainly determined by the biopolymer ratio since pH and ionic strength did not differ among samples.
Information regarding the digestion of protein is of importance for high protein diet. The interactions between proteins and other components in the GI tract could significantly alter the digestibility and digestion profile of proteins. In vitro digestion methods could provide important information for understanding the gastric behavior of a complicated food matrix before carrying out in vivo experiments. Under the simulated gastric conditions used in this study, the intragastric gel could not be fully dissolved after digestion for 2 h. Most of the pectin and more than half of the protein remained in the gels. It is known that large food particles require longer incubation time in the stomach and move through the stomach more slowly than small ones, since they have to be small enough to pass through the pylorus valve which separates the stomach and small intestine.36 Liquid/beverage that forms intragastric gels would require longer transit time in the stomach than typical liquid/beverage. This could lead to a prolonged feeling of fullness and earlier termination of meal. Though future studies are needed to investigate whether the enhanced satiety by intragastric gelation could be sensed in vivo, this study demonstrates the potential effect of protein and dietary fiber interactions on protein digestion, satiety and food intake regulation. The presence of dietary fibers in the meal could lead to extensive coalescence, flocculation or even gelation with proteins in the stomach, and thus slow down gastric emptying and promote the feeling of fullness.
Conclusion
The effect of pectin on the in vitro digestibility of whey protein highly depends on the biopolymer ratio and, to a lesser extent, pH. At low pectin concentration used in this study (0.25%), pectin had no significant effect on the digestion pattern of whey protein. Heating whey protein and pectin together at pH 6.0 and 7.0 resulted in the formation of protein aggregates with different size and structure, which also showed different digestion patterns. Though samples at pH 6.0 had larger aggregates than pH 7.0, overall pH 7.0 had a higher amount of aggregates after 2 h digestion. Extensive intragastric gelation occurred when increasing the pectin concentration to 1%. The majority of the proteins at both pH 6.0 and 7.0 were involved in the gelation immediately after mixing with SGF, while pH 6.0 had less amount of protein remaining soluble than pH 7.0. WPI–pectin at pH 6.0 formed more interconnected and denser gel due to the higher intra-molecular interactions between whey protein and pectin. The gels could not be completely digested after digestion for 2 h, though the aggregates in the gel were degraded into smaller ones. It will be interesting to investigate whether the effect of pectin on protein digestion will influence protein satiety.Acknowledgements
The authors thank Davisco Foods International Inc. for providing whey protein isolate, and CP Kelco for providing pectin.References
- N. Stănciuc, I. van der Plancken, G. Rotaru and M. Hendrickx, Rev. Roum. Chim., 2008, 53, 921–929 Search PubMed.
- M. R. Peram, S. M. Loveday, A. Ye and H. Singh, J. Dairy Sci., 2013, 96, 63–74 CrossRef CAS PubMed.
- I. O'Loughlin, B. Murray, P. Kelly, R. FitzGerald and A. Brodkorb, J. Agric. Food Chem., 2012, 60, 4895–4904 CrossRef CAS PubMed.
- Y. Tunçtürk and Ö. Zorba, Food Hydrocolloids, 2006, 20, 475–482 CrossRef PubMed.
- A. Sarkar, K. K. T. Goh, R. P. Singh and H. Singh, Food Hydrocolloids, 2009, 23, 1563–1569 CrossRef CAS PubMed.
- A. Sarkar, D. S. Horne and H. Singh, Food Hydrocolloids, 2010, 24, 142–151 CrossRef CAS PubMed.
- A. Mackie and A. Macierzanka, Curr. Opin. Colloid Interface Sci., 2010, 15, 102–108 CrossRef CAS PubMed.
- J. Maldonado-Valderrama, A. P. Gunning, P. J. Wilde and V. J. Morris, Soft Matter, 2010, 6, 4908–4915 RSC.
- J. Slavin, J. Food Compos. Anal., 2003, 16, 287–291 CrossRef.
- C. L. Dikeman and G. C. Fahey Jr, Crit. Rev. Food Sci. Nutr., 2006, 46, 649–663 CrossRef CAS PubMed.
- C. L. Dikeman, M. R. Murphy and G. C. Fahey, J. Nutr., 2006, 136, 913–919 CAS.
- S. Bakalis, A. Tharakan, M. Jaime-Fonseca, P. Fryer and I. Norton, FASEB J., 2007, 21, 524 Search PubMed.
- C. Villaume, C. Sanchez and L. Méjean, Biochim. Biophys. Acta, Gen. Subj., 2004, 1670, 105–112 CrossRef PubMed.
- A. Nacer, C. Sanchez, C. Villaume, L. Mejean and J. Mouecoucou, J. Agric. Food Chem., 2004, 52, 355–360 CrossRef CAS PubMed.
- S. Peyron, J. Mouécoucou, S. Frémont, C. Sanchez and N. Gontard, J. Agric. Food Chem., 2006, 54, 5643–5650 CrossRef CAS PubMed.
- N. Polovic, M. Blanusa, M. Gavrovic-Jankulovic, M. Atanaskovic-Markovic, L. Burazer, R. Jankov and T. C. Velickovic, Clin. Exp. Allergy, 2007, 37, 764–771 CrossRef CAS PubMed.
- N. D. Polovic, R. V. Pjanovic, L. M. Burazer, S. J. Velickovic, R. M. Jankov and T. D. Cirkovic Velickovic, J. Sci. Food Agric., 2009, 89, 8–14 CrossRef CAS.
- A. Ibarz, A. Pagán, F. Tribaldo and J. Pagán, Food Control, 2006, 17, 890–893 CrossRef CAS PubMed.
- J. J. Gorman, T. P. Wallis and J. J. Pitt, Mass Spectrom. Rev., 2002, 21, 183–216 CrossRef CAS PubMed.
- S. Turgeon, C. Schmitt and C. Sanchez, Curr. Opin. Colloid Interface Sci., 2007, 12, 166–178 CrossRef CAS PubMed.
- C. G. de Kruif, F. Weinbreck and R. de Vries, Curr. Opin. Colloid Interface Sci., 2004, 9, 340–349 CrossRef CAS PubMed.
- F. Weinbreck, R. De Vries, P. Schrooyen and C. De Kruif, Biomacromolecules, 2003, 4, 293–303 CrossRef CAS PubMed.
- C. Schmitt and S. L. Turgeon, Adv. Colloid Interface Sci., 2011, 167, 63–70 CrossRef CAS PubMed.
- X. Wang, J. Lee, Y.-W. Wang and Q. Huang, Biomacromolecules, 2007, 8, 992–997 CrossRef CAS PubMed.
- H. Espinosa-Andrews, J. G. Báez-González, F. Cruz-Sosa and E. J. Vernon-Carter, Biomacromolecules, 2007, 8, 1313–1318 CrossRef CAS PubMed.
- T. L. Halton and F. B. Hu, J. Am. Coll. Nutr., 2004, 23, 373–385 CrossRef.
- M. Veldhorst, A. Smeets, S. Soenen, A. Hochstenbach-Waelen, R. Hursel, K. Diepvens, M. Lejeune, N. Luscombe-Marsh and M. Westerterp-Plantenga, Physiol. Behav., 2008, 94, 300–307 CrossRef CAS PubMed.
- B. Burton-Freeman, J. Nutr., 2000, 130, 272S–275S CAS.
- M. O. Weickert and A. F. Pfeiffer, J. Nutr., 2008, 138, 439–442 CAS.
- J. Slavin and H. Green, BNF Nutr. Bull., 2007, 32, 32–42 CrossRef.
- C. De Graaf, W. A. Blom, P. A. Smeets, A. Stafleu and H. F. Hendriks, Am. J. Clin. Nutr., 2004, 79, 946–961 CAS.
- M. Kristensen and M. G. Jensen, Appetite, 2011, 56, 65–70 CrossRef CAS PubMed.
- B. L. Luhovyy, T. Akhavan and G. H. Anderson, Am. J. Clin. Nutr., 2007, 26, 704S–712S CAS.
- S. Soenen and M. S. Westerterp-Plantenga, Curr. Opin. Clin. Nutr. Metab. Care, 2008, 11, 747–751 CrossRef CAS PubMed.
- G. A. van Aken, E. Bomhof, F. D. Zoet, M. Verbeek and A. Oosterveld, Food Hydrocolloids, 2011, 25, 781–788 CrossRef CAS PubMed.
- S. J. Hur, B. O. Lim, E. A. Decker and D. J. McClements, Food Chem., 2011, 125, 1–12 CrossRef CAS PubMed.
Footnote |
| † Electronic supplementary information (ESI) available. See DOI: 10.1039/c3fo60331h |
| This journal is © The Royal Society of Chemistry 2014 |

