Intracellular co-delivery of zinc ions and plasmid DNA for enhancing gene transfection activity
Shoichiro
Asayama
*a,
Kosho
Matsuda
a,
Yoichi
Negishi
b and
Hiroyoshi
Kawakami
a
aDepartment of Applied Chemistry, Tokyo Metropolitan University, 1-1 Minami-Osawa, Hachioji, Tokyo 192-0397, Japan. E-mail: asayama-shoichiro@tmu.ac.jp; Fax: +81-42-677-2821; Tel: +81-42-677-1111, ext. 4976
bDepartment of Drug Delivery and Molecular Biopharmaceutics, School of Pharmacy, Tokyo University of Pharmacy and Life Sciences, Horinouchi, Hachioji, Tokyo 192-0392, Japan
First published on 19th September 2013
Abstract
Zinc ions, methylated poly(1-vinylimidazole) (PVIm-Me) and plasmid DNA (pDNA) have formed ternary complexes for gene delivery. The resulting Zn–PVIm-Me–pDNA complexes have delivered both Zn2+ ions and pDNA inside cells, leading to the nuclear translocation of the pDNA. By use of the pDNA containing a nuclear protein, NF-κB, binding sequence, the intracellular co-delivery of Zn2+ ions and pDNA has enhanced gene expression. These results suggest that the intracellular Zn2+ ions delivered by Zn–PVIm-Me–pDNA complexes activated the NF-κB, enhancing the nuclear translocation of the pDNA. In conclusion, it has been demonstrated that the Zn–PVIm-Me–pDNA complex is capable of enhancing the gene transfection activity by a synergic effect of the PVIm-Me and the co-delivered intracellular Zn2+ ions.
Introduction
In gene delivery systems, the formation of DNA–carrier polyion complexes is a key factor in the new design of efficient delivery.1–4 The self-assembly of a DNA and polycations forming polyion complexes has been an attractive approach to introduce genes into mammalian cells.5–8 Inside the cell, DNA routes via acidic vesicles (endosomes) where it must escape to reach the cytosol and then the nucleus for gene expression.9,10 For the achievement of the above intracellular events, a large number of polyion complexes such as pH-sensitive ternary complexes11–15 or the complexes with nucleus-targeting molecules16–20 have been demonstrated.Recent studies show that the plasmids containing a specific sequence recognized by a nuclear protein (nuclear factor κB, NF-κB) could improve the transfection activity, possibly due to the intracellular trafficking guided by nuclear-protein and the active nuclear translocation of the plasmid DNA.21–23 Since the interaction between the plasmid DNA and NF-κB is a prerequisite to achieve efficient karyophilic protein-guided cytosolic trafficking and nuclear translocation, the unpacking of the plasmid DNA–polycation polyion complexes should be occurring soon after the endosomal escape of the complexes. An endosomal escape and the cytosolic unpacking of the complexes are expected to be facilitated by use of the methylated poly(1-vinylimidazole) (PVIm-Me), which we have already reported as a pH-sensitive polycation at endosomal pH.24
On the other hand, the nuclear protein NF-κB is reported to be activated by the intracellular zinc ion level.25 Moreover, the zinc ion is reported to be a novel intracellular second messenger/signaling ion.26 The zinc ion has the potential to influence many aspects of cellular signaling through its effect on zinc-binding proteins because there are many transcription factors and enzymes containing zinc-binding sites. Based on the biological functions of zinc ions, we have already reported the pH-dependent chelation of Zn2+ ions with the imidazole groups of poly(1-vinylimidazole) (PVIm) and that the zinc-chelated PVIm (PVIm-Zn) formed the DNA polyion complex via the chelated Zn2+ ions.27 The resulting PVIm-Zn–DNA complexes have exhibited no significant cytotoxicity and led gene expression. Furthermore, the PVIm-Zn and a carbohydrate ligand polycation, lactosylated poly(L-lysine) (PLL-Lac), have formed the complexes with DNA, resulting in no significant cytotoxicity and more gene expression.28 However, the mechanism leading to gene expression mediated by these complexes is unclear.
These backgrounds have inspired us to establish our strategy for the intracellular co-delivery of Zn2+ ions and plasmid DNA for enhancing gene transfection activity. The co-delivery of Zn2+ ions and plasmid DNA (pDNA) is expected to be achieved by use of our pH-sensitive polycation, PVIm-Me, as a gene carrier for endosomal escape. In this study, we have demonstrated the mechanism of enhancing gene transfection activity from the viewpoint of NF-κB activation by the intracellular Zn2+ ions delivered by Zn–PVIm-Me–pDNA ternary complexes.
Materials and methods
Materials
Zinc chloride (ZnCl2) was purchased from Kanto Chemical Co., Inc. (Tokyo, Japan). 6-[N-[N′,N′-bis(2-pyridinyl)methyl]-2-aminoethyl]amino-3′,6′-diacetoxy-spiro[iso-benzofuran-1(3H), 9′-[9H]xanthene]-3-one (ZnAF-2DA), a membrane-permeable zinc indicator, was purchased from Sekisui Medical Co., Ltd. (Tokyo, Japan). All other chemicals of a special grade were used without further purification.Preparation of Zn–PVIm-Me–pDNA complexes
Alkylated PVIm, 20 mol% methylated PVIm (PVIm-Me) was synthesized according to our previous paper.24 The resulting PVIm-Me, ZnCl2, and plasmid DNA (pDNA) (pGL3-control vector; from Promega Co.) was mixed in PBS (−), where the amount of the pDNA of each mixture was 300 ng, by three methods as follows: (I) To the PVIm-Me in the phosphate buffer, ZnCl2 aqueous solution was added at a Zn2+/imidazole ratio of 4. The PVIm-Me–ZnCl2 mixture was incubated for 7 min at room temperature. Then, to the resulting mixture, the pDNA in TE buffer was added at a positive/negative charge ratio of 2 against PVIm-Me. The PVIm-Me–ZnCl2–pDNA mixture was incubated for 1 h at room temperature. (II) To the ZnCl2 in the phosphate buffer, the pDNA in TE buffer was added, followed by 7 min incubation at room temperature. Then, to the ZnCl2–pDNA mixture, the PVIm-Me in the phosphate buffer was added at a Zn2+/imidazole ratio of 4 and at a positive/negative charge ratio of 2 against pDNA. The ZnCl2–pDNA–PVIm-Me mixture was incubated for 1 h at room temperature. (III) To the PVIm-Me in the phosphate buffer, the pDNA in TE buffer was added at a positive/negative charge ratio of 2, followed by 1 h incubation at room temperature. Then, to the PVIm-Me–pDNA mixture, the ZnCl2 aqueous solution was added at a Zn2+/imidazole ratio of 4. The PVIm-Me–pDNA–ZnCl2 mixture was incubated for 7 min at room temperature.Agarose gel retardation assay
After the above incubation of the mixture, each sample (corresponding to 300 ng of pDNA) was mixed with a loading buffer and loaded onto a 1% agarose gel containing 1 μg mL−1 of ethidium bromide. Gel electrophoresis was run at room temperature in 50 mM sodium phosphate buffer (pH 7.4) at 50 V for 15 min. The DNA bands were visualized under UV irradiation.Size and zeta potential measurements
The size of the complexes was measured by a dynamic light scattering (DLS) method using an electrophoresis light scattering spectrophotometer (ELS-Z2, Otsuka Electronics Co., Ltd., Tokyo, Japan) and the zeta potential was measured by ELS using electrodes. The complex formation was according to the method (III) of section “Preparation of Zn–PVIm-Me–pDNA complexes”. The size and zeta potential of the resulting complexes of DNA (20 μg) and PVIm-Me (positive/negative = 2) with ZnCl2 (Zn2+/imidazole = 4) were measured in 3 mL of 10 mM sodium phosphate buffer (pH 7.4) containing 130 mM NaCl.Detection of intracellular distribution of Zn2+ ions
HepG2 cells (from Riken Bioresource Center Cell Bank), human hepatoblastoma cell line, were cultured in tissue culture flasks containing Dulbecco's modified Eagle's medium (DMEM) supplemented with 10% heat-inactivated FBS. The cells were seeded at 1 × 10⁴ cells per well in a 96-well plate and incubated overnight at 37 °C in a 5% CO2 incubator. The cells were incubated in the presence of the complexes of pDNA (200 ng) and PVIm-Me (positive/negative = 2) with ZnCl2 (Zn2+/imidazole = 4) for 24 h at 37 °C. The complex formation was according to the method (III) of section “Preparation of Zn–PVIm-Me–pDNA complexes”. After the 24 h incubation, the cells were washed with PBS (+) twice, followed by the addition of 5 μM ZnAF-2DA, a membrane-permeable zinc indicator. After further 30 min incubation at 37 °C, the cells were washed with Eagle's minimal essential medium (EMEM) supplemented with 10% heat-inactivated FBS twice, followed by the addition of 100 μL fresh EMEM with 10% FBS per well. Then, the resulting cells were observed using IncuCyte Zoom (Essen BioScience, Inc., Tokyo, Japan), a live cell imaging system, with excitation at 440–480 nm and emission at 504–544 nm.Cellular uptake of pDNA
HepG2 cells in DMEM supplemented with 10% heat-inactivated FBS were seeded at 1 × 10⁴ cells per well in a 96-well plate and incubated overnight at 37 °C in a 5% CO2 incubator. The cells were incubated in the presence of the complexes of CX-rhodamine-labelled pDNA (200 ng) and PVIm-Me (positive/negative = 2) with ZnCl2 (Zn2+/imidazole = 4) for 24 h at 37 °C. LabelIT kits (Mirus Bio, Madison, WI) were used for covalent labeling pDNA with CX-rhodamine. The complex formation was according to the method (III) of section “Preparation of Zn–PVIm-Me–pDNA complexes”. After the 24 h incubation, the cells were washed with PBS (−) twice, followed by the addition of 20 μL of 1% Triton X-100 in 50 mM sodium phosphate buffer. Subsequently, the fluorescence of 150 μL of the resulting cell lysate diluted to 200 μL with PBS (−) was directly detected using a fluorescence plate reader (DTX 800, Beckman Coulter) at 550 nm excitation and 595 nm emission. Calibration was made with 150 μL of 0–1 ng μL−1 CX-rhodamine-labelled pDNA solutions. Furthermore, the protein concentrations of the resulting cell lysate were determined using a BCA protein assay kit (Pierce) according to the manufacturer’s instructions, where calibration was made with 0–200 μg mL−1 albumin standards. The amount of intracellular pDNA (ng) was normalized by the amount of protein (mg) and is presented as ng pDNA/mg protein.Confocal laser scanning microscopy (CLSM)
HepG2 cells (4 × 10⁴ cells per well) were seeded three days before the experiments. The cells were incubated in the presence of the complexes of the CX-rhodamine-labelled pDNA (600 ng) and PVIm-Me (positive/negative = 2) with ZnCl2 (Zn2+/imidazole = 4) for 24 h at 37 °C. The complex formation was according to the method (III) of section “Preparation of Zn–PVIm-Me–pDNA complexes”. After the 7 h incubation, the cells were washed with FBS-free DMEM twice. Then, the cells were treated with 50 nM LysoTracker Green DND-26 (Invitrogen) in FBS-free DMEM and incubated for 30 min at 37 °C. Subsequently, the cells were washed with PBS (+) twice and then fixed with 4% paraformaldehyde for 20 min at room temperature. After washing the cells with PBS (+) twice, the cells were treated with DAPI (4′,6-diamidino-2-phenylindole, dihydro-chloride) solution (Dojindo) diluted with PBS (+). The resulting cells were incubated for 20 min at room temperature and washed with PBS (+) twice. Then, CLSM was performed. The cell morphology was observed using a differential interference contrast (DIC) microscope.Transfection procedure
In a typical 96-well plate experiment, 1 × 10⁴ cells per well HepG2 cells were transfected in DMEM supplemented with 10% heat-inactivated FBS by the addition of 15 μL of PBS (−) containing 200 ng of each pDNA encoding the modified firefly luciferase and PVIm-Me (positive/negative = 2) with ZnCl2 (Zn2+/imidazole = 4). Lipofectin (Invitrogen) transfection reagent (positive/negative = 1) was used as a positive control. As well as pGL3-control vector, pNF-κB-Luc and pAP-1-Luc cis-reporter plasmid (from Agilent Technologies, Inc.) were used. The pDNA complex formation was according to method (III) of section “Preparation of Zn–PVIm-Me–pDNA complexes”. After 1 day of incubation, the medium was removed and the cells were further incubated for 2 days in the DMEM supplemented with 10% FBS. After washing the cells with PBS (−) twice, the cells were subjected to the luciferase assay (Promega kit) according to the manufacturer’s instructions. Luciferase activities were normalized by protein concentrations and are presented as relative light units (RLUs). Protein concentrations were determined using a BCA protein assay kit (Pierce) according to the manufacturer’s instructions.Results and discussion
Formation of Zn–PVIm-Me–pDNA complexes
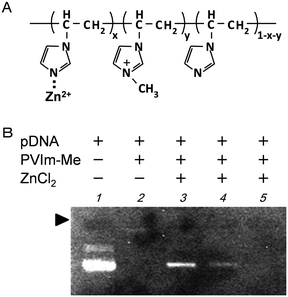
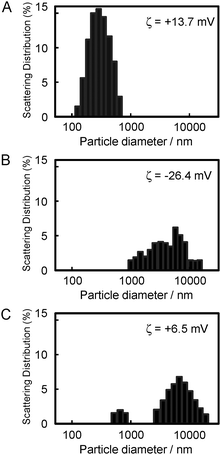
To prepare the zinc-chelated methylated PVIm (PVIm-Me-Zn), as shown in Fig. 1A, we mixed PVIm-Me with ZnCl2 in an aqueous solution. The resulting PVIm-Me-Zn with a Zn2+/imidazole ratio of 4 was then mixed with plasmid DNA (pDNA) at a positive/negative ratio of 2 against PVIm-Me. As shown in Fig. 1B, we examined the pDNA complex formation with the PVIm-Me–Zn by agarose gel electrophoresis. It should be noted that free pDNA was observed (lane 3), whereas no free pDNA was observed in case of the PVIm-Me–pDNA complex at a positive:negative ratio of 2 (lane 2). These results suggest that the polyion complex formation between PVIm-Me–Zn and pDNA is considered to be difficult; namely, the PVIm-Me–pDNA complex formation is considered to be inhibited by Zn2+ chelation. Therefore, we first mixed ZnCl2 with DNA and then mixed with PVIm-Me. However, a little free DNA was observed (lane 4). Taking these results into account, subsequently, we first formed the PVIm-Me–pDNA complex and then added ZnCl2. Consequently, no free DNA was observed (lane 5), suggesting that the complex formation with pDNA was completed; nevertheless the complex formation with Zn2+ ions was unclear.To examine whether the Zn–PVIm-Me–DNA complex was formed, as shown in Fig. 2, we measured the particle size and zeta potential of the resulting complex. The particle diameter and zeta potential of the PVIm-Me–DNA complexes was 365 ± 140 nm and +13.7 mV, respectively (Fig. 2A). On the other hand, ZnCl2 alone exhibited four overlapped peaks of large particle size (1353 ± 199, 3004 ± 729, 6930 ± 1601, 14![[thin space (1/6-em)]](https://www.rsc.org/images/entities/char_2009.gif) 093 ± 1341 nm) and negative zeta potential (−26.4 mV) (Fig. 2B), presumably owing to the formation of insoluble zinc hydroxide.29 It should be noted that the PVIm-Me–DNA complexes in the presence of ZnCl2 exhibited two peaks of larger particle size (803 ± 125, 8092 ± 3809 nm) and lower positive zeta potential (+6.5 mV) (Fig. 2C), as compared with the complexes in the absence of ZnCl2. The large particle size and negative zeta potential of the ZnCl2 alone were therefore considered to influence those of the PVIm-Me–DNA complexes. Namely, these results suggest that the additional ZnCl2 interacted with the PVIm-Me–DNA complexes. Thus, we have succeeded in forming a ternary complex among Zn2+, PVIm-Me and DNA, that is, the Zn–PVIm-Me–DNA complex.
093 ± 1341 nm) and negative zeta potential (−26.4 mV) (Fig. 2B), presumably owing to the formation of insoluble zinc hydroxide.29 It should be noted that the PVIm-Me–DNA complexes in the presence of ZnCl2 exhibited two peaks of larger particle size (803 ± 125, 8092 ± 3809 nm) and lower positive zeta potential (+6.5 mV) (Fig. 2C), as compared with the complexes in the absence of ZnCl2. The large particle size and negative zeta potential of the ZnCl2 alone were therefore considered to influence those of the PVIm-Me–DNA complexes. Namely, these results suggest that the additional ZnCl2 interacted with the PVIm-Me–DNA complexes. Thus, we have succeeded in forming a ternary complex among Zn2+, PVIm-Me and DNA, that is, the Zn–PVIm-Me–DNA complex.
Cellular uptake of the Zn–PVIm-Me–pDNA complexes
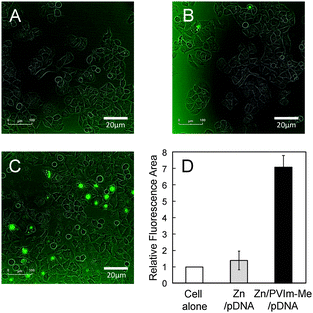
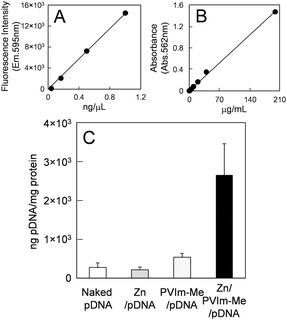
The cellular uptake of the resulting Zn–PVIm-Me–pDNA complexes is an important factor for gene expression. As shown in Fig. 3, we examine the cellular uptake of Zn2+ ions by use of a membrane-permeable zinc indicator. No significant green fluorescence from the zinc indicator was observed, as well as the cell alone (Fig. 3A), when we treated cells with ZnCl2 and pDNA in the absence of PVIm-Me (Fig. 3B). It should be noted that the treatment of the cells with the Zn–PVIm-Me–pDNA complexes resulted in significant fluorescence from intracellular Zn2+ ions (Fig. 3C). The relative fluorescence area of the Zn–PVIm-Me–pDNA complexes was almost 7-fold larger than that of Zn–pDNA in the absence of PVIm-Me (Fig. 3D). These results suggest that the PVIm-Me in the Zn–PVIm-Me–pDNA complexes achieved the intracellular delivery of Zn2+ ions.To examine further the cellular uptake of the Zn–PVIm-Me–pDNA complexes, as shown in Fig. 4, we labelled pDNA with rhodamine and determined the amount of intracellular pDNA by use of the calibration made with the rhodamine-labelled pDNA (Fig. 4A). The amount of intracellular pDNA was normalized by the amount of the cell lysate protein determined by BCA assay (Fig. 4B).30 As shown in Fig. 4C, the amount of intracellular pDNA by use of the Zn–PVIm-Me–pDNA complexes was estimated to be 2650 ± 807 ng, which was 10-fold higher than that by use of naked pDNA (274 ± 119 ng) or Zn–pDNA in the absence of PVIm-Me (215 ± 69 ng), per 1 mg of the protein of the cell lysate. Even though we used the PVIm-Me–pDNA complexes, little increase in the amount of intracellular pDNA (534 ± 97 ng) was observed. These results suggest that the formation of the ternary complex among Zn2+, PVIm-Me and pDNA achieved the intracellular delivery of pDNA. Consequently, we have succeeded in the intracellular co-delivery of Zn2+ ions and pDNA by use of the Zn–PVIm-Me–pDNA complexes.
Intracellular distribution of the pDNA in the Zn–PVIm-Me–pDNA complexes
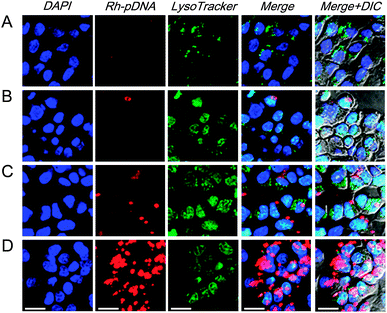
As is known, the successful escape from endosomes and the nuclear translocation of pDNA is crucial to improve pDNA transfection efficiency and the corresponding protein expression.31 To examine the ability of the endosomal escape and nuclear translocation of the pDNA after cellular uptake, as shown in Fig. 5, we monitored the Zn–PVIm-Me–pDNA complexes containing the rhodamine-labelled pDNA (Rh-pDNA: red color) in the cells by confocal laser scanning microscopy (CLSM). Endosomes (lysosomes) and nuclei were stained with LysoTracker Green (green color) and DAPI (blue color), respectively, to identify the localization of the complexes. No significant red fluorescence (pDNA) was observed when the cells were treated with naked pDNA or Zn–pDNA in the absence of PVIm-Me (Fig. 5A and B), which was consistent with the results of Fig. 4C. In case of the PVIm-Me–pDNA complexes, in spite of little red fluorescence, the red fluorescence (pDNA) did not overlap with green fluorescence (endosome) (Fig. 5C), suggesting the endosomal escape of pDNA by use of the PVIm-Me. Notably, a considerable amount of red fluorescence (pDNA) was observed and was not overlapped with green fluorescence (endosome), suggesting the endosomal escape of a considerable amount of pDNA, when the cells were treated with the Zn–PVIm-Me–pDNA complexes (Fig. 5D). It is worth noting that a significant amount of red fluorescence (pDNA) was overlapped with blue fluorescence (nuclei) (Fig. 5D), suggesting the colocalization of pDNA with the nuclei of the cells. These results suggest that the formation of the ternary complex among Zn2+, PVIm-Me and pDNA achieved the efficient pDNA delivery to the cell nuclei.Gene transfection activity of the pDNA in the Zn–PVIm-Me–pDNA complexes
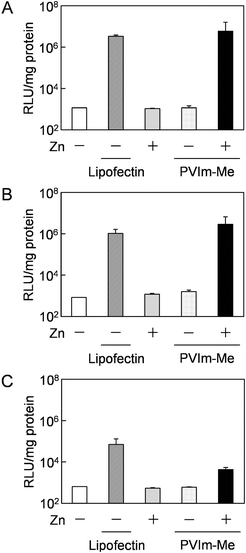
Based on the results of the nuclear translocation of pDNA, we hypothesized that the released Zn2+ ions from the Zn–PVIm-Me–pDNA complexes affected the efficient pDNA delivery to the nuclei. It is reported that intracellular Zn2+ levels can affect the NF-κB activation pathway.25 Furthermore, it is reported that a pDNA containing the NF-κB binding sequence demonstrated, enhanced the cytoplasmic mobility and nuclear translocation of the pDNA,21 leading to enhanced transfection efficiency.22,32First of all, to examine the transfection activity of the Zn–PVIm-Me–pDNA complexes, we used a general reporter pDNA (pGL3-control vector) encoding luciferase with SV40 promoter and enhancer, where NF-κB binding sequences are found.33 As shown in Fig. 6A, no significant gene expression was observed when the cells were treated with naked pDNA or Zn–pDNA in the absence of PVIm-Me, which was consistent with the results of Fig. 4C, 5A and B. Furthermore, no significant gene expression was also observed when the cells were treated with PVIm-Me–pDNA complexes, which was almost consistent with the results of Fig. 4C and 5C. It should be noted that the gene expression mediated by the Zn–PVIm-Me–pDNA complexes was at the same level (1.8 times) as that mediated by a positive control, lipofectin. The gene expression is supported by the results of Fig. 4C and 5D.
To examine whether the released Zn2+ ions from the Zn–PVIm-Me–pDNA complexes affected the gene expression, finally, we carried out the transfection experiment by use of various pDNAs with a different synthetic promoter that contains direct repeats of the transcription recognition sequences for the binding sites for NF-κB (Fig. 6B) or the activator protein 1 (AP-1) (Fig. 6C) as a control. By use of both pDNAs, as shown in Fig. 6B and C, no significant gene expression was also observed when the cells were treated with naked pDNA, Zn–pDNA or PVIm-Me–pDNA. By use of the pDNA with NF-κB binding sites (Fig. 6B), notably, the gene expression mediated by the Zn–PVIm-Me–pDNA complexes was higher (2.7 times) than that mediated by the positive control. By use of the pDNA with not NF-κB but AP-1 binding sites (Fig. 6C), however, the gene expression mediated by the Zn–PVIm-Me–pDNA complexes was lower than that mediated by the positive control. Namely, it is worth noting that the gene expression mediated by the ternary complexes among Zn2+, PVIm-Me and pDNA with NF-κB binding sites was higher than that with AP-1 binding sites. These results suggest that the transfection activity of the Zn–PVIm-Me–pDNA complexes depended on NF-κB activation by intracellular Zn2+ ions. Taking these results into account, the co-delivery of Zn2+ ions and pDNA with NF-κB binding sites by the Zn–PVIm-Me–pDNA complexes is expected to be applied for a new design of gene delivery systems.
Conclusions
In this study, we have prepared the Zn–PVIm-Me–pDNA complexes for gene delivery. The resulting complexes have achieved the co-delivery of Zn2+ ions and pDNA. The delivered intracellular Zn2+ ions are considered to activate a nuclear protein, NF-κB, enhancing the nuclear translocation of the pDNA. The nuclear-translocated pDNA has led to efficient transfection activity. Consequently, we have demonstrated that the Zn–PVIm-Me–pDNA complex is capable of enhancing the gene transfection activity by the synergic effect of the PVIm-Me and the co-delivered intracellular Zn2+ ions. Including the biochemical function of Zn2+ ions, the Zn–PVIm-Me–pDNA complexes are expected to offer a unique design for gene delivery systems.References
- S. Fukushima, K. Miyata, N. Nishiyama, Y. Yamasaki and K. Kataoka, J. Am. Chem. Soc., 2005, 127, 2810 CrossRef CAS PubMed.
- G. T. Zugates, D. G. Anderson, S. R. Little, I. E. B. Lowhorn and R. Ranger, J. Am. Chem. Soc., 2006, 128, 12726 CrossRef CAS PubMed.
- Y. Liu and T. M. Reineke, Bioconjugate Chem., 2007, 18, 19 CrossRef CAS PubMed.
- B. Wang, C. He, C. Tang and C. Yin, Biomaterials, 2011, 32, 4630 CrossRef CAS PubMed.
- W. Zauner, M. Ogris and E. Wagner, Adv. Drug Delivery Rev., 1998, 30, 97 CrossRef CAS.
- W. T. Godbey, K. K. Wu and A. G. Mikos, J. Controlled Release, 1999, 60, 149 CrossRef CAS PubMed.
- L. Peng, M. Liu, Y. N. Xue, S. W. Huang and R. X. Zhuo, Biomaterials, 2009, 30, 5825 CrossRef CAS PubMed.
- R. Toita, J. H. Kang, T. Tomiyama, C. W. Kim, S. Shiosaki, T. Niidome, T. Mori and Y. Katayama, J. Am. Chem. Soc., 2012, 134, 15410 CrossRef CAS PubMed.
- E. Yuba, Y. Nakajima, K. Tsukamoto, S. Iwashita, C. Kojima, A. Harada and K. Kono, J. Controlled Release, 2012, 160, 552 CrossRef CAS PubMed.
- S. Asayama, M. Sudo, S. Nagaoka and H. Kawakami, Mol. Pharmacol., 2008, 5, 898 CrossRef CAS PubMed.
- V. S. Trubetskoy, S. C. Wong, V. Subbotin, V. G. Budker, A. Loomis, J. E. Hagstrom and J. A. Wolff, Gene Ther., 2003, 10, 261 CrossRef CAS PubMed.
- T. Ito, N. Iida-Tanaka, T. Niidome, T. Kawano, K. Kubo, K. Yoshikawa, T. Sato, Z. Yang and Y. Koyama, J. Controlled Release, 2006, 112, 382 CrossRef CAS PubMed.
- S. Asayama, T. Sekine, H. Kawakami and S. Nagaoka, Bioconjugate Chem., 2007, 18, 1662 CrossRef CAS PubMed.
- J. Gu, X. Wang, X. Jiang, Y. Chen, L. Chen, X. Fang and X. Sha, Biomaterials, 2012, 33, 644 CrossRef CAS PubMed.
- Y. He, G. Cheng, L. Xie, Y. Nie, B. He and Z. Gu, Biomaterials, 2013, 34, 1235 CrossRef CAS PubMed.
- A. Rebuffat, A. Bernasconi, M. Ceppi, H. Wehrli, S. B. Verca, M. Ibrahim, B. M. Frey, F. J. Frey and S. Rusconi, Nat. Biotechnol., 2001, 19, 1155 CrossRef CAS PubMed.
- T. Nagasaki, T. Kawazu, T. Tachibana, S. Tamagaki and S. Shinkai, J. Controlled Release, 2005, 103, 199 CrossRef CAS PubMed.
- T. Shiraishi, R. Hamzavi and P. E. Nielsen, Bioconjugate Chem., 2005, 16, 1112 CrossRef CAS PubMed.
- K. M. Park, C. H. Kang, J. K. Cho, I. J. Chung, S. H. Cho, Y. H. Bae and K. Na, Biomaterials, 2009, 30, 2642 CrossRef CAS PubMed.
- H. Akita, T. Masuda, T. Nishio, K. Niikura, K. Ijiro and H. Harashima, Mol. Pharmacol., 2011, 8, 1436 CrossRef CAS PubMed.
- A. Mesika, V. Kiss, V. Brumfeld, G. Ghosh and Z. Reich, Hum. Gene Ther., 2005, 16, 200 CrossRef CAS PubMed.
- S. Choi, S. Oh, M. Lee and S. W. Kim, Mol. Ther., 2005, 12, 885 CrossRef CAS PubMed.
- C. Gonçalves, M. Y. Ardourel, M. Decoville, G. Breuzard, P. Midoux, B. Hartmann and C. Pichon, J. Gene Med., 2009, 11, 401 CrossRef PubMed.
- S. Asayama, T. Hakamatani and H. Kawakami, Bioconjugate Chem., 2010, 21, 646 CrossRef CAS PubMed.
- K. Kabu, S. Yamasaki, D. Kamimura, Y. Ito, A. Hasegawa, E. Sato, H. Kitamura, K. Nishida and T. Hirano, J. Immunol., 2006, 177, 1296 CrossRef CAS.
- S. Yamasaki, K. Sakata-Sogawa, A. Hasegawa, T. Suzuki, K. Kabu, E. Sato, T. Kurosaki, S. Yamashita, M. Tokunaga, K. Nishida and T. Hirano, J. Cell Biol., 2007, 177, 637 CrossRef CAS PubMed.
- S. Asayama, S. Nishinohara and H. Kawakami, Metallomics, 2011, 3, 680 RSC.
- S. Asayama, S. Nishinohara and H. Kawakami, Bioconjugate Chem., 2011, 22, 1864 CrossRef CAS PubMed.
- E. Kejnovsky and J. Kypr, Nucleic Acids Res., 1998, 26, 5295 CrossRef CAS PubMed.
- R. E. Brown, K. L. Jarvis and K. J. Hyland, Anal. Biochem., 1989, 180, 136 CrossRef CAS PubMed.
- W. P. Colin and W. S. Leonard, Adv. Drug Delivery Rev., 2001, 46, 187 CrossRef.
- A. Misika, I. Grigoreva, M. Zohar and Z. Reich, Mol. Ther., 2001, 3, 653 CrossRef PubMed.
- M. Zenke, T. Grundstrom, H. Matthes, M. Winterith, C. Schatz, A. Wildeman and P. Chembon, EMBO J., 1986, 5, 387–397 CAS.
| This journal is © The Royal Society of Chemistry 2014 |

