Synthesis of Au–Fe3O4 heterostructured nanoparticles for in vivo computed tomography and magnetic resonance dual model imaging†
Jing
Zhu
a,
Yinjie
Lu
a,
Yonggang
Li
b,
Jiang
Jiang
c,
Liang
Cheng
d,
Zhuang
Liu
d,
Liang
Guo
b,
Yue
Pan
*a and
Hongwei
Gu
*a
aKey Laboratory of Organic Synthesis of Jiangsu Province, College of Chemistry, Chemical Engineering and Materials Science, Soochow University, Suzhou, 215123, China. E-mail: hongwei@suda.edu.cn; panyue@suda.edu.cn; Fax: +86-65880905; Tel: +86-65880905 Tel: +86-65882911
bDepartment of Radiology, The First Affiliated Hospital of Soochow University, Soochow University, Suzhou, 215006, China
ci-Lab and Division of Nanobiomedicine, Suzhou Institute of Nano-Tech and Nano-Bionics, Chinese Academy of Sciences, Suzhou, 215123, China
dJiangsu Key Laboratory for Carbon-Based Functional Materials & Devices Institute of Functional Nano & Soft Materials Laboratory (FUNSOM), Soochow University, Suzhou, Jiangsu 215123, China
First published on 25th October 2013
Abstract
Water-soluble Au–Fe3O4 heterostructured nanoparticles with high biocompatibility were synthesized and applied as a dual modality contrast agent. These nanoparticles present strong CT/MRI contrast enhancement in a rabbit model. Low concentrations of Au–Fe3O4 were found to obtain a similar effect to high concentrations of a commercial iodine agent in the CT image.
In recent years, nanoparticles have been extensively studied in bio-imaging related research and applications where they have shown superb properties for magnetic resonance imaging (MRI),1 computed tomography (CT),2 fluorescence imaging,3 photoacoustic tomography (PAT),4 and two-photon fluorescence imaging.5 Combining multiple components in one nanostructure to enable integrated functions such as therapeutics–diagnostics (theranostics) and multimodal imaging has been becoming the most sought-after research direction.6 Since each imaging modality has its own strength and weakness, by integrating two or more imaging modalities into one nanostructure, multimodal imaging can overcome the weaknesses inherent in each imaging method, and provide complementary information for better diagnosis. For this purpose, various hybrid structures with optical–MRI, MRI–CT, CT–PET, and MRI–PET functionalities have been developed.7–9 In particular, combining MRI and CT, both commonly applied techniques in medical diagnosis, has drawn great interest in the past year,8–11 as MRI is a very sensitive technique while CT enables high resolution 3D visualization.
In this communication we describe the Au–Fe3O4 heterostructured nanoparticles to exhibit a CT and MR imaging enhancing contrast effect. Scheme 1 illustrates the general strategy of this process in a rabbit model. Although some Au and iron oxide hybrid nanoparticles were reported as contrast agents,9,11–13 we demonstrate here the first example of Au based heterostructured nanoparticles for CT imaging of the detailed structure of the rabbit ventricle. Compared with single Au or Fe3O4 nanoparticles, the Au–Fe3O4 heterostructured nanoparticles could provide a new class of nanomaterials for useful applications because they contain both a gold unit and a magnetic (Fe3O4) unit which are suitable for simultaneous CT and MR dual mode imaging.
 | ||
| Scheme 1 The illustration of the applications of Au–Fe3O4 heterostructured nanoparticles for CT and MRI of a rabbit. | ||
To demonstrate the concept, the Au–Fe3O4 heterostructured nanoparticles were successfully synthesized using a reported procedure.14 Typically, iron pentacarbonyl, Fe(CO)5 was decomposed on the surface of the Au nanoparticles followed by oxidation under air which led to Au–Fe3O4 heterostructured nanoparticles. The resulting Au–Fe3O4 nanoparticles were successfully modified by tetramethylammonium hydroxide (TMAOH) to obtain water-soluble Au–Fe3O4 nanoparticles.15 These water-soluble Au–Fe3O4 nanoparticles are extremely stable in water and no aggregates were observed for two months. This is due to more charge on the surface of the nanoparticles than on the traditional PEG ligand which prevents aggregation.
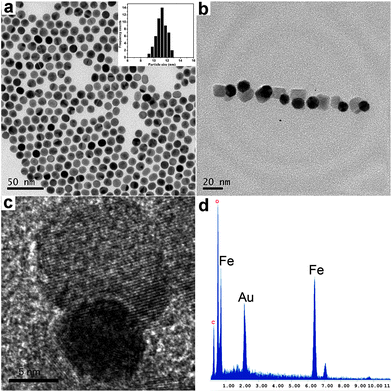
A transmission electron microscope (TEM) was used to follow the synthesis and to characterize the heterostructured nanoparticles. Au nanoparticles with uniform spheres are shown in Fig. 1a with their size (diameter)-distributions obtained from the statistical analysis of approximately 100 nanoparticles. The average size of Au nanoparticles is about 11 nm. The heterostructure of Au–Fe3O4 nanoparticles was confirmed by TEM and HRTEM images as clearly shown in Fig. 1b and c, where Au components are viewed to be dark because of the heavy atom effect. As shown in the HRTEM image (Fig. 1c), the heterostructured Au–Fe3O4 nanoparticles comprise a larger (about 14 nm) iron oxide component fused to a small (11 nm) spherical gold seed. Furthermore, the energy-dispersive X-ray spectroscopy (EDS) analysis (Fig. 1d) presented the peaks of Au and Fe elements in the heterostructured nanoparticles. Fig. S1† shows representive X-ray diffraction (XRD) patterns of the Au nanoparticles and Au–Fe3O4 nanoparticles, pointing out the occurrence of both Au and Fe3O4 in the heterostructures. The UV-vis spectrum of a Au–Fe3O4 solution exhibits a surface plasmon resonance (SPR) absorption peak at about 520 nm, which is consistent with that of Au nanoparticles (Fig. S2†). The low concentration of Au nanoparticles in the heterostructures is also responsible for the low absorbance at 520 nm in the UV-vis spectra.
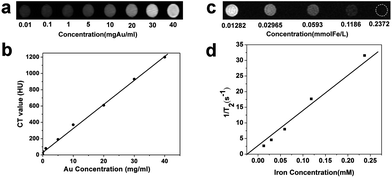
After its characterization, we obtained CT and MRI images of a phantom at various concentrations of Au–Fe3O4 heterostructured nanoparticles dispersed in deionized water. In the CT images, the signal increased linearly with the nanoparticle concentration (Fig. 2a and b). T2-weighted MRI images of the same phantom were acquired using a GE 1.5 T Signa Excite MRI scanner. As the nanoparticle concentration increased, the signal intensity decreased significantly (Fig. 2c). The measured r2 value was 136.4 mM−1 s−1 (Fig. 2d) by plotting 1/T2 against the iron concentration ([Fe]) in the solution, which is close to that of the commercial MRI contrast agent.10,12 Whereas the signal intensity of the CT image continuously increased without saturation, the T2 contrast effect of the nanoparticles saturated at a concentration of 0.12 mmol l−1 and signal attenuation was not observed above this concentration. Since MRI is very sensitive, a sufficient T2 contrast effect was observed even at low concentration.
 | ||
| Fig. 2 (a) CT phantom images at various concentrations of Au–Fe3O4 nanoparticles and (b) HU values; (c) T2-weighted MRI image of the same phantom and (d) r2 values. | ||
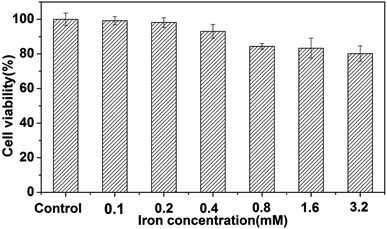
We assessed the biocompatibility of the nanoparticles toward mammalian cells by a 3-(4,5-dimethylthiazol-2-yl)-2,5-diphenyltetrazolium bromide (MTT) assay using a HeLa cell line. The water-soluble Au–Fe3O4 nanoparticles were tested over a dosage range of 0–3.2 mM iron concentration of Au–Fe3O4 nanoparticles. The MTT assay (Fig. 3) showed no appreciable cytotoxicity (cell viability > 80%) detected up to a concentration of 3.2 mM after 24 h of exposure. This high biocompatibility is a great advantage of Au–Fe3O4 NPs compared with FePt NPs and Gd chelate-coated gold NPs used for bimodal CT/MRI due to potential toxicity of leached Pt or Gd ions.16 We further demonstrated the cytocompatibility of Au–Fe3O4 nanoparticles through microscopy (Fig. S3†). The Bel7402 cells (liver cancer cell line) were incubated with the Au–Fe3O4 nanoparticles (3.2 mM of iron concentration) at 37 °C for 6 h. As shown in Fig. S3b and c,† there is no obvious cellular morphology change after treatment with the Au–Fe3O4 nanoparticles, which agreed with the MTT data.
 | ||
| Fig. 3 The cytotoxicity evaluated by MTT assay in the range of 0–3.2 mM iron concentration of Au–Fe3O4 nanoparticles. | ||
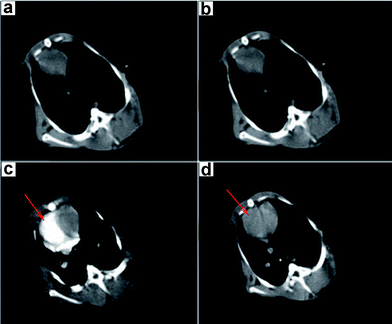
On the basis of our successful verification of Au–Fe3O4 nanoparticles for in vitro CT/MRI images, we further tested their feasibility for in vivo imaging using an animal model. Au–Fe3O4 nanoparticles (2.52 mg ml−1, 4 ml) were injected intravenously into the ear veins of the rabbits. Dual MR/CT imaging was performed using a clinical CT and MRI scanner before and after ear-vein injection of the nanoparticles. Contrast effects were examined in the major organs (taking the heart as an example for CT and the liver for MRI). Fig. 4a is the CT image of the rabbit heart before injection. There is no significant difference after injection at 5 s (Fig. 4b). However, after administration of the Au–Fe3O4 nanoparticles at 25 s, we found a clear contrast enhancement in the right ventricle due to the existence of a large number of contrast agents there (Fig. 4c). Compared with the CT value (50) before injection, the HU values (CT) increase to 239 after injection of nanoparticles, which is almost 3.78 times higher in signal intensity. It is significant since a high concentration (300 mg ml−1) of the commercial iodine agent (iohexol) is required to form a similar effect (Fig. S3†). As a result of the low dose used, after the pulmonary and systemic circulation, Au–Fe3O4 contrast agents are diluted by blood leading to the quick reduction of concentration of contrast agents in the right ventricle (Fig. 4d). However, iodine agents still have a relatively high contrast effect due to high concentration after dilution by blood (Fig. S4†). The Hounsfield unit (HU) values before and after injection of Au–Fe3O4 contrast agents and iodine agents respectively are shown in Table S1.†
 | ||
| Fig. 4 In vivo CT images of a rabbit heart (a) before injection, (b) 5 s, (c) 25 s, and (d) 45 s after intravenous injection of Au–Fe3O4 nanoparticles. | ||
Since T2-weighted MRI is another powerful imaging technique, we also tested the capability of Au–Fe3O4 nanoparticles for in vivo MRI. MR imaging of the rabbit liver was performed at several temporal points (0 min (pre-injection), 5 min and 10 min) after injection of Au–Fe3O4 nanoparticles. An immediate decrease of T2 signal intensity is evident within 1 min (Fig. 5b) compared to the normal liver (Fig. 5a). As shown in Fig. 5c, signal reduction (T2 decrease of 75%) in the liver was very significant.
 | ||
| Fig. 5 T 2-weighted MR images of the rabbit liver following ear vein injection of Au–Fe3O4 nanoparticles obtained at (a) 0 min, (b) 5 min, and (c) 10 min. | ||
In conclusion, we here report Au–Fe3O4 heterostructured nanoparticles to exhibit a CT/MRI contrast enhancing effect in a live rabbit model. The in vivo studies demonstrated that the Au–Fe3O4 nanoparticles could serve as a dual model contrast agent for CT/MR imaging. More detailed structures like the right ventricle of a rabbit can be clearly seen in CT imaging, and the rabbit liver can be imaged using MRI at the same time. These heterostructured nanoparticles are expected to have great potential in biological and medical imaging.
Acknowledgements
H.W.G. acknowledges the financial support of the National Natural Science Foundation of China (no. 21003092), the Key Project of Chinese Ministry of Education (no. 211064), and the Priority Academic Program Development of Jiangsu Higher Education Institutions; Y.P. acknowledges financial support from the New Faculty Start Foundation of Soochow University (Q410900413); Y.G.L. acknowledges financial support from the National Natural Science Foundation of China (NSFC) (no. 81171394, 81171392), the Natural Science Fund of Jiangsu Province (no. BK2011307) and the Natural Science Fund for Colleges and Universities in Jiangsu Province (no. 09KJB320016).Notes and references
- H. B. Na, I. C. Song and T. Hyeon, Adv. Mater., 2009, 21, 2133–2148 CrossRef CAS; Y.-W. Jun, J.-H. Lee and J. Cheon, Angew. Chem., Int. Ed., 2008, 47, 5122–5135 CrossRef PubMed.
- J. M. Kinsella, R. E. Jimenez, P. P. Karmali, A. M. Rush, V. R. Kotamraju, N. C. Gianneschi, E. Ruoslahti, D. Stupack and M. J. Sailor, Angew. Chem., Int. Ed., 2011, 50, 12308–12311 CrossRef CAS PubMed; A. Jakhmola, N. Anton and T. F. Vandamme, Adv. Healthcare Mater., 2012, 1, 413–431 CrossRef PubMed; Y. Liu, K. Ai and L. Lu, Acc. Chem. Res., 2012, 45, 1817–1827 CrossRef PubMed; O. Rabin, J. M. Perez, J. Grimm, G. Wojtkiewicz and R. Weissleder, Nat. Mater., 2006, 5, 118–122 CrossRef PubMed.
- R. Zeng, T. Zhang, J. Liu, S. Hu, Q. Wan, X. Liu, Z. Peng and B. Zou, Nanotechnol., 2009, 20, 095102 CrossRef CAS PubMed; H. S. Choi, W. H. Liu, F. B. Liu, K. Nasr, P. Misra, M. G. Bawendi and J. V. Frangioni, Nat. Nanotechnol., 2010, 5, 42–47 CrossRef PubMed.
- G. S. Filonov, A. Krumholz, J. Xia, J. Yao, L. V. Wang and V. V. Verkhusha, Angew. Chem., Int. Ed., 2012, 51, 1448–1451 CrossRef CAS PubMed; X. Yang, S. E. Skrabalak, Z.-Y. Li, Y. Xia and L. V. Wang, Nano Lett., 2007, 7, 3798–3802 CrossRef PubMed; C. Kim, C. Favazza and L. V. Wang, Chem. Rev., 2010, 110, 2756–2782 CrossRef PubMed.
- J. Jiang, H. Gu, H. Shao, E. Devlin, G. C. Papaefthymiou and J. Y. Ying, Adv. Mater., 2008, 20, 4403–4407 CrossRef CAS; S. Kim, H. E. Pudavar, A. Bonoiu and P. N. Prasad, Adv. Mater., 2007, 19, 3791–3795 CrossRef.
- D.-E. Lee, H. Koo, I.-C. Sun, J. H. Ryu, K. Kim and I. C. Kwon, Chem. Soc. Rev., 2012, 41, 2656–2672 RSC; J. Cheon and J.-H. Lee, Acc. Chem. Res., 2008, 41, 1630–1640 CrossRef CAS PubMed; J. Xie, S. Lee and X. Chen, Adv. Drug Delivery Rev., 2010, 62, 1064–1079 CrossRef PubMed; J. Xie, K. Chen, J. Huang, S. Lee, J. Wang, J. Gao, X. Li and X. Chen, Biomater., 2010, 31, 3016–3022 CrossRef PubMed; V. C. Xu, J. Xie, D. Ho, C. Wang, N. Kohler, E. G. Walsh, J. R. Morgan, Y. E. Chin and S. Sun, Angew. Chem., Int. Ed., 2008, 47, 173–176 CrossRef PubMed; C. Wang, C. J. Xu, H. Zeng and S. H. Sun, Adv. Mater., 2009, 21, 3045–3052 CrossRef PubMed; J. Gao, H. Gu and B. Xu, Acc. Chem. Res., 2009, 42, 1097–1107 CrossRef PubMed; C. Xu and S. Sun, Adv. Drug Delivery Rev., 2013, 65, 732–743 CrossRef PubMed.
- J. Lim and S. A. Majetich, Nano Today, 2013, 8, 98–113 CrossRef CAS PubMed; M. Nahrendorf, H. Zhang, S. Hembrador, P. Panizzi, D. E. Sosnovik, E. Aikawa, P. Libby, F. K. Swirski and R. Weissleder, Circulation, 2008, 117, 379–387 CrossRef PubMed; J.-s. Choi, J. C. Park, H. Nah, S. Woo, J. Oh, K. M. Kim, G. J. Cheon, Y. Chang, J. Yoo and J. Cheon, Angew. Chem., Int. Ed., 2008, 47, 6259–6262 CrossRef PubMed; A. Xia, Y. Gao, J. Zhou, C. Li, T. Yang, D. Wu, L. Wu and F. Li, Biomater., 2011, 32, 7200–7208 CrossRef PubMed; C. Wang and J. Irudayaraj, Small, 2009, 6, 283–289 CrossRef PubMed; G. Zhang, Y. Liu, Q. Yuan, C. Zong, J. Liu and L. Lu, Nanoscale, 2011, 3, 4365–4371 RSC.
- E. N. M. Cheung, R. D. A. Alvares, W. Oakden, R. Chaudhary, M. L. Hill, J. Pichaandi, G. C. H. Mo, C. Yip, P. M. Macdonald, G. J. Stanisz, F. C. J. M. van Veggel and R. S. Prosser, Chem. Mater., 2010, 22, 4728–4739 CrossRef CAS; S.-W. Chou, Y.-H. Shau, P.-C. Wu, Y.-S. Yang, D.-B. Shieh and C.-C. Chen, J. Am. Chem. Soc., 2010, 132, 13270–13278 CrossRef PubMed; N. Lee, H. R. Cho, M. H. Oh, S. H. Lee, K. Kim, B. H. Kim, K. Shin, T.-Y. Ahn, J. W. Choi, Y.-W. Kim, S. H. Choi and T. Hyeon, J. Am. Chem. Soc., 2012, 134, 10309–10312 CrossRef PubMed.
- S. Narayanan, B. N. Sathy, U. Mony, M. Koyakutty, S. V. Nair and D. Menon, ACS Appl. Mater. Interfaces, 2011, 4, 251–260 Search PubMed.
- M. Wang, C. Wang, K. L. Young, L. Hao, M. Medved, T. Rajh, H. C. Fry, L. Zhu, G. S. Karczmar, C. Watson, J. S. Jiang, N. M. Markovic and V. R. Stamenkovic, Chem. Mater., 2012, 24, 2423–2425 CrossRef CAS.
- K. Dongkyu, Y. Mi Kyung, L. Tae Sup, P. Jae Jun, J. Yong Yeon and J. Sangyong, Nanotechnol., 2011, 22, 155101 CrossRef PubMed.
- M. Yang, K. Cheng, S. Qi, H. Liu, Y. Jiang, H. Jiang, J. Li, K. Chen, H. Zhang and Z. Cheng, Biomater., 2013, 34, 2796–2806 CrossRef CAS PubMed.
- H. Cai, K. Li, M. Shen, S. Wen, Y. Luo, C. Peng, G. Zhang and X. Shi, J. Mater. Chem., 2012, 22, 15110–15120 RSC.
- H. Yu, M. Chen, P. M. Rice, S. X. Wang, R. L. White and S. Sun, Nano Lett., 2005, 5, 379–382 CrossRef CAS PubMed.
- Y. G. Li, Y. J. Lu, H. Y. Hong, Y. Y. Chen, X. X. Ma, L. Guo, Z. L. Wang, J. H. Chen, M. Zhu, J. K. Ni, H. W. Gu, J. M. Lu and J. Y. Ying, Chem. Commun., 2011, 47, 6320–6322 RSC.
- J. Gao, G. Liang, B. Zhang, Y. Kuang, X. Zhang and B. Xu, J. Am. Chem. Soc., 2007, 129, 1428–1433 CrossRef CAS PubMed; P. V. Asharani, N. Xinyi, M. P. Hande and S. Valiyaveettil, Nanomedicine, 2010, 5, 51–64 CrossRef PubMed.
Footnote |
| † Electronic supplementary information (ESI) available: Details of general experimental procedures, XRD patterns, UV-vis absorption spectra, phase contrast imaging, and CT imaging. See DOI: 10.1039/c3nr04730j |
| This journal is © The Royal Society of Chemistry 2014 |

