A novel on-line ultrasonic extraction system for determination of the optimal ultrasonic frequency for plant material
Jianqing
Liao
*,
Baida
Qu
and
Baoguo
Xu
Key Laboratory of Industrial Advanced Process Control for Light Industry of Ministry of Education, Jiangnan University, Wuxi, 214122, China. E-mail: jndxljqbs@126.com; Fax: +86 510 85910633; Tel: +86 510 89890416
First published on 27th October 2014
Abstract
An ultrasonic extraction efficiency or yield varies with the change of ultrasonic frequency, because each kind of plant material possesses a unique natural resonant frequency. Only when the ultrasonic frequency is equal to the natural resonant frequency of the plant material, the extraction efficiency or yield will be up to the highest value. With existing ultrasonic extraction technologies or devices, it may be difficult to determine the optimal ultrasonic frequency for different plant materials because of selecting only one or a few frequency points. To determine the optimal ultrasonic frequency, this paper presented a novel ultrasonic extraction technology in our laboratory, which is an on-line extraction system for the determination of the optimal ultrasonic frequency well suited for various plant materials. This system was composed of eight similar working groups, for which the ultrasonic frequency band was set in a range of 18–82 kHz. A determination method for the optimal ultrasonic frequency was carried out by two steps, including determining the optimal frequency band and frequency point. In order to evaluate the performance of this extraction system, a comparative experiment of hesperidin from tangerine peels was also performed under the same extraction conditions. The results showed that the highest extraction efficiency of extracting hesperidin from tangerine peels appeared at 47.5 kHz, which gave a higher extraction yield compared to the existing ultrasonic extraction technology, and also significantly shortened the extraction time.
1 Introduction
In recent years, there has been a tremendous increase in the use of ultrasound for the extraction of plant materials, because the application of ultrasound-assisted extraction offers many advantages, including higher extraction yields, lower temperature, shorter time and the reduction of solvents when compared to other extraction techniques.1–3Many studies on a variety of substance extraction processes, using ultrasound, have been reported.4–7 It was found that those studies on ultrasound-assisted extraction technology mainly focused on optimum conditions, including extraction time, temperature, the type of solvent, solid/solvent ratio, electrical acoustic intensity, etc. However, the effect of the optimal ultrasonic frequency on the extraction efficiency has not been systematically investigated so far. Moreover, only little work has been done to find the best method for the ultrasonic frequency used in biological extraction.
In fact, the ultrasonic frequency will have a strong effect on the extraction efficiency. During the extraction process, not all bubbles are capable of producing significant cavitation effects. The greatest coupling of the ultrasonic energy will occur when the natural resonance frequency of the bubbles is equal to the ultrasonic frequency.8,9 The extraction bubble natural resonance frequency equation was deduced.10 It indicates that if the ultrasonic frequency is less than the natural resonant frequency of the bubbles, the extraction yield will increase as the ultrasonic frequency increases. On the contrary, the extraction yield decreases with an increasing ultrasonic frequency. The research suggested that under the conditions described to study ultrasonic extraction, the yield of extraction in liquids could reach a maximum value at an optimal ultrasonic frequency because the ultrasonic frequency helped to promote bubbles to collapse, by driving the bubbles into resonance. Therefore, determining the optimal ultrasonic frequency for various plant materials, with which a maximum yield of extraction can be obtained, is a very important research subject.
Some researchers have studied the ultrasonic extraction processes for various plant materials,11–17 which can be described as follows: firstly, ultrasonic frequencies were empirically selected from an ultrasonic apparatus, then, plant materials were irradiated by selected ultrasonic frequencies. As a result, a large number of experimental data were produced. Finally, by comparing and analyzing those obtained data, the optimal ultrasonic frequencies were finally determined. However, the extraction process might result in blindness because no one knows the optimum ultrasonic frequency in advance. Moreover, the optimal frequency was probably not the best suitable ultrasonic frequency due to taking roughly only a few frequency points. In addition, those extraction technologies not only waste a lot of manpower, financial and material resources, but also cannot form stable large scale processes. Hence, researching a more efficient extraction technology for determining the optimal ultrasonic frequency is extremely urgent.
This paper aims to explore a highly efficient extraction system for plant materials by determining an optimal ultrasonic frequency method. To achieve an on-line displaying function on a computer, and to establish a simple method for the determination, a UV transceiver with an ultraviolet emitter and receiver was designed to real-time detect the extraction efficiency. In addition, in order to evaluate the performance of our novel ultrasonic extraction system, a comparison of the extraction yield of hesperidin from tangerine peels between our extraction system and an existing ultrasonic extraction technology was also carried out under the same extraction conditions. The findings of the present study may suggest a new strategy to enhance the extraction efficiency for plant materials.
2 Extraction system
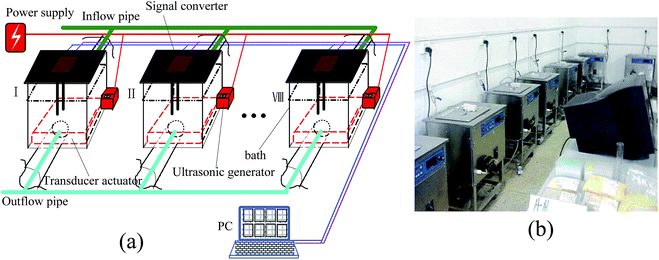
The ultrasonic extraction system is composed of a computer and eight similar working groups that are constituted of various parts, including a treatment tank, a signal converter, an ultrasonic generator and controller, a transducer actuator, an UV transceiver, a peristaltic pump and a temperature controller. The schematic diagram and a photograph of the extraction system are shown in Fig. 1.Taking into account the fact that ultrasonic frequencies used for extracting plant materials are mainly concentrated close to the low frequency (20 kHz–100 kHz), in our investigation, the ultrasonic frequency band of this extraction system was set in a range of 18–82 kHz. Namely, the frequency bandwidth in the first working group was 18–26 kHz, the second one was worked at 26–34 kHz, and the eighth one was set at 74–82 kHz. Of course, the frequency bandwidth of each working group could be adjusted by replacing the transceivers according to different extraction results or plant materials.
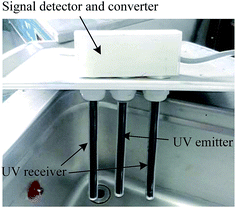
The UV transceiver with an ultraviolet emitter and receiver is one of the key working units, which was equipped to real-time detect the extraction efficiency of the product concentration because different ultraviolet wavelengths can be absorbed by some analyte concentrations. Fig. 2 shows a photograph of the UV transceiver. To ensure the ultraviolet light emitted by the UV emitter can be fully absorbed by the UV receiver, the UV emitter and receiver were positioned at the same height and kept at a distance of 6 cm. Moreover, a signal converter was used to achieve the functions of signal detection and conversion from the UV transceiver. The converted electrical signals were sent to the computer, on which these signals were processed, monitored, controlled and displayed.
In this system, a temperature sensor of type AD590 has been attached to the treatment tank to give the feedback signal for the temperature controller and to monitor the tank temperature. The temperature can be controlled by the temperature controller through presetting a certain temperature value, such as 20 °C, 28 °C or 40 °C, etc.
In addition, to obtain the most suitable ultrasonic irradiation, twelve transducers with different resonant frequencies in each working group were evenly distributed on a panel (350 × 300 × 2 mm). For improving the precision of the optimal frequency as much as possible, the resonance frequency of each transducer was maintained at an approximate interval error of 0.67 kHz. Therefore, in the course of determining the optimal ultrasonic frequency, even if there is a frequency drift, a certain transducer can work under the best resonant conditions.
3 Experimental
3.1 Materials and reagents
Dried tangerine peels were collected from a local market in Bing Hu district, Wuxi, Jiangshu province, China. In our laboratory, the dried tangerine peels were grounded with a blade mixer to obtain a 0.45–1 μm particle size. The ground samples were kept in plastic inside desiccators before use. All chemical reagents used in the experiments were of analytical grade and purchased from Tianjin Chemical Factory, Tianjin, China.3.2 Extraction method and analysis
The grounded powders of 5 g were first put into a 3000 ml beaker sealed by a plastic film to avoid loss of solvent and then the extraction solvent was added with a solid–liquid ratio of 1![[thin space (1/6-em)]](https://www.rsc.org/images/entities/char_2009.gif) :
:![[thin space (1/6-em)]](https://www.rsc.org/images/entities/char_2009.gif) 40. The sample beakers were immersed into the ultrasonic bath for irradiation. Finally, the extracts were filtered off through a 0.45 μm microporous membrane and the filtrate was collected for high performance liquid chromatography (HPLC) analyses.18 All experiments were performed in duplicate.
40. The sample beakers were immersed into the ultrasonic bath for irradiation. Finally, the extracts were filtered off through a 0.45 μm microporous membrane and the filtrate was collected for high performance liquid chromatography (HPLC) analyses.18 All experiments were performed in duplicate.
The dried samples were extracted employing our designed equipment using only methanol as the extracting solvent at room temperature (28 °C). The extraction time was performed from 0 to 60 min under an ultrasonic power level of 30 W. The curves of the extraction efficiency in the experiments can be real-time, on-line displayed on the computer using the laboratory virtual instrument engineering workbench (labVIEW) software. The extracted samples were collected from the optimal working group and analyzed by HPLC, which are finally used for comparison with the results of the extraction.
3.3 Determination procedure of the optimal ultrasonic frequency
To obtain accurately the optimal frequency of the ultrasonic extraction from the broad frequency band range, the broad band was evenly divided into eight equal narrow bands of 8 kHz. The flow chart of the determination procedure of the optimal ultrasonic frequency is shown in Fig. 3. In this design, the frequency determination procedure involved two steps.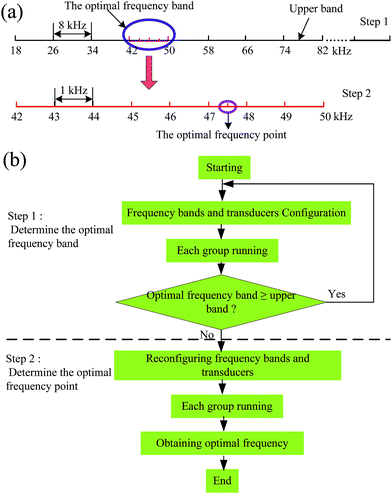 | ||
| Fig. 3 Determination procedure of the optimal ultrasonic frequency: (a) schematic diagram; (b) flow chart. | ||
Step 1: all working groups began to determine the optimal ultrasonic frequency band after configuration of the operating parameters, including the frequency bands (18–82 kHz), ultrasonic power level (30 W), etc. When a certain working group detected the highest efficiency band by UV transceiver, the computer would check automatically to decide if the optimal frequency band is exactly equal to the upper band (74–82 kHz). If not, the second step was started. Otherwise, the frequency bands outside the upper band (>82 kHz) and the corresponding transducers were reset, and the above step was repeated.
Step 2: in this step, the frequency bandwidth of each working group was decreased from 8 kHz to 1 kHz by reconfiguring the relevant transducers. If the optimal frequency band appeared at 42–50 kHz, the frequency bandwidth of each working group will be reset to 42–43 kHz, 43–44 kHz, 44–45 kHz, etc. Meanwhile, the transducers of each working group were replaced, for which the center frequency of each frequency band was the same as the corresponding natural frequency of the transducer. The extraction experiment was restarted by substituting the treatment liquid in every working group. This procedure was carried out similar to the first step. When the highest extraction efficiency appeared in a certain working group, the optimal ultrasonic frequency was just the center frequency of the corresponding band.
4 Results and discussion
4.1 The extraction efficiency of hesperidin from tangerine peels using our system at room temperature (28 °C) and 30 W
![[thin space (1/6-em)]](https://www.rsc.org/images/entities/char_2009.gif) :
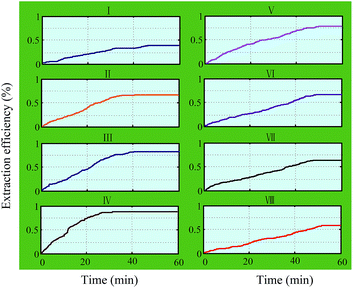
:![[thin space (1/6-em)]](https://www.rsc.org/images/entities/char_2009.gif) 1). The graphs of the experimental results are shown in Fig. 4. It was found that the extraction efficiency increased with the increase in the extraction time durations for all working groups. The extraction results increased within the initial 0–40 min, then reached the maximum extraction efficiency. Finally, the rate of change increased slowly up to zero. It was noted that the 4th working group (42–50 kHz) took only 25 min to reach the maximum value of the extraction efficiency, which is less than that of the others. In addition, the extraction efficiency of hesperidin from tangerine peels decreased with the deviation degree of the different frequency band. In the 8th working group (74–82 kHz), the extraction efficiency reduced to a minimum value. The results might be due to the following reasons.
1). The graphs of the experimental results are shown in Fig. 4. It was found that the extraction efficiency increased with the increase in the extraction time durations for all working groups. The extraction results increased within the initial 0–40 min, then reached the maximum extraction efficiency. Finally, the rate of change increased slowly up to zero. It was noted that the 4th working group (42–50 kHz) took only 25 min to reach the maximum value of the extraction efficiency, which is less than that of the others. In addition, the extraction efficiency of hesperidin from tangerine peels decreased with the deviation degree of the different frequency band. In the 8th working group (74–82 kHz), the extraction efficiency reduced to a minimum value. The results might be due to the following reasons.
In the process of extraction, not all bubbles are capable of producing significant cavitation effects. The greatest coupling of the ultrasonic energy will occur when the natural resonance frequency of the bubble is equivalent to the ultrasonic frequency.19,20 Considering the surface tension of the viscous medium energy loss and the viscosity of the medium, the natural resonance frequency equation of extraction bubble was deduced by Huang J. L. et al.21
 | (1) |
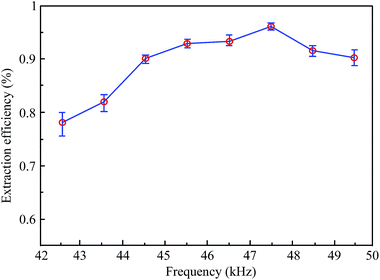
It can be seen that the extraction efficiency of hesperidin from tangerine peels increased gradually as the ultrasonic frequency increased, and the frequency point of the highest extraction efficiency appeared at 47.5 kHz. After that, the extraction efficiency declined along with the rise of the ultrasonic frequency. It is worth noting that the extraction efficiency between 42 kHz and 50 kHz in this step was higher than that of the first step. Moreover, the maximum value of the extraction efficiency at 47.5 kHz is significantly higher than that of the others. The result may demonstrate that the cavitation yield drops with the increase in ultrasonic frequency because the cavitation bubbles tend to be smaller and less energetic, resulting in a decrease in the extraction efficiency.23 A previous study has confirmed a similar trend that a low frequency was found to be preferable.24 On the other hand, transducers of the 6th working group (47–48 kHz) may all work under resonance conditions, in which every transducer can produce a maximum output power that causes more disintegration of cells and gives a higher mass transfer. Due to a decrease in the amount and intensity of the cavitation in liquids at a high frequency, the rarefaction cycle time for bubbles to grow becomes shorter.25
4.2 Comparison of the extraction yields for hesperidin from tangerine peels between our extraction system and an existing ultrasonic extraction method
To evaluate the performance of our extraction system, this system was compared to the ultrasound-assisted extraction method proposed by a previous study18 for hesperidin from tangerine peels.In this study, the existing ultrasound-assisted extraction experiments were carried out in a rectangular ultrasonic bath (KQ-250DE, Kunshan Ultrasound Co. Ltd., China; inner dimensions: 300 × 240 × 150 mm) with an ultrasound power of 30 W and an ultrasonic frequency of 20 kHz, 60 kHz, and 100 kHz. The extraction temperature was maintained at 30 °C. The sample beakers were immersed into the ultrasonic cleaning bath for irradiation under fixed extraction variables, including methanol, solvent to solid ratio of 5![[thin space (1/6-em)]](https://www.rsc.org/images/entities/char_2009.gif) :
:![[thin space (1/6-em)]](https://www.rsc.org/images/entities/char_2009.gif) 1, and extraction of 60 min. Finally, the extracts were filtered off through a 0.45 μm membrane filter and the filtrate was collected for HPLC analyses. All samples were prepared and analyzed in triplicate.
1, and extraction of 60 min. Finally, the extracts were filtered off through a 0.45 μm membrane filter and the filtrate was collected for HPLC analyses. All samples were prepared and analyzed in triplicate.
The extraction conditions for our extraction system, such as power of 30 W, methanol as a solvent, the same particle size, and solid–liquid ratio, in the experiments were examined. A quantitative HPLC analysis was conducted under the procedures described by previous research. Under these conditions, the comparison of the extraction yields for hesperidin from tangerine peels is listed in Table 1.
| Methods | Power (W) | Time (min) | Temperature (°C) | Frequency (kHz) | Extraction yield (mg g−1) |
|---|---|---|---|---|---|
| Existing extraction method | 30 | 60 | 40 | 20 | 44.6 |
| Existing extraction method | 30 | 60 | 40 | 60 | 56.4 |
| Existing extraction method | 30 | 60 | 40 | 100 | 49.2 |
| Our extraction system | 30 | 25 | 28 | 47.5 | 65.3 |
For all cases shown, the yields of hesperidin with the existing ultrasonic extraction method under three frequencies were all lower than those with our extraction system (at 47.5 kHz). Moreover, the latter gave 8.9 mg g−1 greater yields of hesperidin compared to the former at 60 kHz. In addition, the extraction yields using the existing extraction method reached a peak value at 60 min while those of our extraction system peaked at only 25 min. Furthermore, the former worked at a temperature of 40 °C, but our extraction system was performed at only room temperature (28 °C). The results indicated that the maximum yield of extraction appeared at 47.5 kHz rather than 60 kHz, which might be attributed to the fact that the optimal ultrasonic frequency could cause bubble collapse by driving the bubble into resonance. In fact, the extraction yield depends on the degree of cavitation activity. When the ultrasonic frequency is closer to the natural resonance frequency of the bubbles, the bubbles collapse violently, which may be favorable to enhance the extraction yield. As a result, 47.5 kHz was the optimal ultrasonic frequency of hesperidin from tangerine peels, which gained the maximum yield of hesperidin.
Fig. 6 also shows a comparison of the extraction yields for hesperidin between our extraction system and the existing extraction method under the same extraction conditions, except the ultrasonic frequencies. Here, the ultrasonic frequency of our extraction system was set at 47.5 kHz. It could be seen that the extraction yield of our extraction system was more than that of the existing extraction method. Moreover, our extraction system took only 25 minutes to reach the maximum of the extraction yield while the existing extraction method lasted more than 60 minutes.
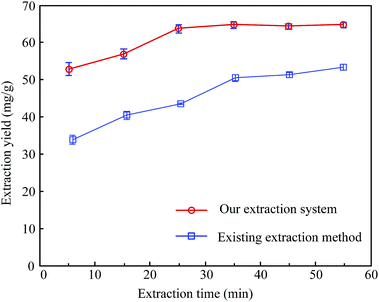 | ||
| Fig. 6 Comparison of the extraction yields for hesperidin from tangerine peels between our novel extraction system and an existing ultrasonic extraction method under the same extraction conditions. | ||
It suggested that ultrasonic extraction can cause cell swelling and enlarge the pores of the cell wall. Sound swelling can improve the rate of mass transfer and lead to increased extraction efficiency and reduced extraction time duration.26–28 In addition, the shortened extraction time is probably linked to the fact that the ultrasonic frequency of 47.5 kHz might be closer to the resonant frequency of the bubbles. Moreover, a suitable frequency can cause more disintegration of cells and give a higher mass transfer, which results in higher extraction yields. Therefore, it might be concluded that our extraction system could significantly enhance the extraction yield. Moreover, it could also efficiently lower the working temperature and shorten the extraction time, compared to an existing ultrasound extraction method.
5 Conclusions
This paper proposed an ultrasonic extraction system that could determine the optimal frequency for various plant materials in a wide band range. The extraction results could be on-line displayed on a computer, which could shorten experimental time and reduce operation costs. A determination method for the optimal ultrasonic frequency was carried out by two steps, including determining the optimal frequency band and frequency point. A UV transceiver, with an ultraviolet emitter and receiver on each working group, was used to achieve precision detection for different analytes. A comparative experiment of hesperidin from tangerine peels was also performed under the same extraction conditions except the ultrasonic frequencies. The results from this study showed that the maximum extraction yield appeared at 47.5 kHz. It indicted that this system can significantly improve the extraction yield by determining the optimal ultrasonic frequency. Moreover, the frequency range of this system can be extended according to different plant materials by replacing the transducers in each working group.Acknowledgements
The present work was supported by the National Natural Science Foundation of China (309716899) and the Programme of Introducing Talents of Discipline to Universities (B12018).References
- K. Vilkhu, R. Mawson, L. Simons and D. Bates, Innovative Food Sci. Emerging Technol., 2008, 9, 161–169 CrossRef CAS PubMed.
- Y.-K. Lv, Y.-N. Sun, L.-M. Wang, C.-L. Jia and H.-W. Sun, Anal. Methods, 2011, 3, 2557–2561 RSC.
- L. Wang, L. Wang, Z. Miao, X. Shao, J. Chen and X. Lu, Anal. Methods, 2012, 4, 844–848 RSC.
- Y. Yang and F. Zhang, Ultrason. Sonochem., 2008, 15, 308–313 CrossRef CAS PubMed.
- L. Qiu, Z. Shao, D. Wang, W. Wang, F. Wang and J. Wang, Carbohydr. Polym., 2014, 111, 588–591 CrossRef CAS PubMed.
- X.-P. Yan, W. Van Mol and F. Adams, Analyst, 1996, 121, 1061–1067 RSC.
- Z. Gao, Y. Wu, H. Zhao, F. Ji, Q. He and S. Li, Anal. Methods, 2012, 4, 2365–2368 RSC.
- T. Mason, Chem. Ind., 1993, 47–50 CAS.
- H. Hung and M. Hoffmann, J. Phys. Chem. A, 1999, 103, 2734–2739 CrossRef CAS.
- J. Huang, R. Feng, C. Zhu and Z. Chen, Ultrason. Sonochem., 1995, 2, S93–S97 CrossRef CAS.
- E. Haeggstrom and M. Luukkala, Food Control, 2001, 12, 37–45 CrossRef.
- L. Qiu, Z. Shao, W. Wang, F. Wang, D. Wang, Z. Zhou, P. Xiang and C. Xu, RSC Adv., 2014, 4, 24859–24862 RSC.
- X.-P. Yan, W. Van Mol and F. Adams, Analyst, 1996, 121, 1061–1067 RSC.
- G. Cum, G. Galli, R. Gallo and A. Spadaro, Ultrasonics, 1992, 30, 267–270 CrossRef CAS.
- X.-P. Yan, M. Sperling and B. Welz, J. Anal. At. Spectrom., 1999, 14, 1625–1629 RSC.
- P. Wu and X.-P. Yan, Chem. Commun., 2010, 46, 7046–7048 RSC.
- J. Dong, Y. Liu, Z. Liang and W. Wang, Ultrason. Sonochem., 2010, 17, 61–65 CrossRef CAS PubMed.
- Y. Ma, X. Ye, Y. Hao, G. Xu, G. Xu and D. Liu, Ultrason. Sonochem., 2008, 15, 227–232 CrossRef CAS PubMed.
- T. Mason, Chem. Ind., 1993, 47–50 CAS.
- H. Hung and M. Hoffmann, J. Phys. Chem. A, 1999, 103, 2734–2739 CrossRef CAS.
- J. Huang, R. Feng, C. Zhu and Z. Chen, Ultrason. Sonochem., 1995, 2, S93–S97 CrossRef CAS.
- D. Phillips, X. Chen, R. Baggs, D. Rubens, M. Violante and K. Parker, Ultrasonics, 1998, 36, 883–892 CrossRef CAS.
- D. Kirpalani and K. McQuinn, Ultrason. Sonochem., 2006, 13, 1–5 CrossRef CAS PubMed.
- K. Swamy and K. Narayana, Ultrason. Sonochem., 2001, 8, 341–346 CrossRef CAS.
- J. Pestman, J. Engberts and F. Dejong, Recl.: J. R. Neth. Chem. Soc., 1994, 113, 533–542 CAS.
- M. Melecchi, V. Peres, C. Dariva, C. Zini, F. Abad, M. Martinez and E. Caramao, Ultrason. Sonochem., 2006, 13, 242–250 CrossRef CAS PubMed.
- L. Paniwnyk, E. Beaufoy, J. Lorimer and T. Mason, Ultrason. Sonochem., 2001, 8, 299–301 CrossRef CAS.
- M. Toma, M. Vinatoru, L. Paniwnyk and T. Mason, Ultrason. Sonochem., 2001, 8, 137–142 CrossRef CAS.
| This journal is © The Royal Society of Chemistry 2015 |

