Sensitive determination of catechol using a glassy carbon electrode modified with L-cysteine and ZnS:Ni/ZnS quantum dots
Jianying
Qu
*,
Yong
Wang
,
Ying
Dong
,
Zhuanying
Zhu
and
Huanhuan
Xing
Institute of Environmental and Analytical Sciences, College of Chemistry and Chemical Engineering, Henan University, Kaifeng, Henan 475004, P. R. China. E-mail: QJY405407@163.com; qujy@henu.edu.cn
First published on 3rd November 2014
Abstract
In this work, water-soluble ZnS:Ni/ZnS quantum dots (QDs) with core/shell structure were obtained successfully using mercaptoacetic acid as dressing agent, which were characterized by X-ray diffraction, Fourier transform infrared spectroscopy, atomic force microscopy and transmission electron microscopy. A highly sensitive and stable electrochemical sensor was developed by immobilizing L-cysteine and ZnS:Ni/ZnS QDs on the surface of glassy carbon electrode. The sensor showed excellent catalytic activity to catechol (CC). Experimental results showed that the oxidation peak current of CC was linear over the range from 0.5 to 100 μM, and the detection limit (S/N = 3) for CC was 32 nM. The developed sensor was successfully used for determination of CC in lake water samples with satisfactory recoveries.
1. Introduction
Catechol (CC) is one of the many phenolic compounds and has been widely used in tanning, cosmetics, flavoring agents, pesticides, dye, medicines and chemicals used in photography.1,2 CC is considered as an environmental pollutant by the US Environmental Protection Agency (EPA) and the European Union (EU) due to its high toxicity and low degradability in the ecological system.3,4 To date, various approaches have been exploited to meet the rising demand for the determination of CC, including gas chromatography/mass spectrometry,5 chemiluminescence,6,7 synchronous fluorescence,8 liquid chromatography/ultraviolet spectrometry9,10 and pH based flow injection analysis.11 Compared with traditional chromatography or spectrophotometry methods, electrochemical methods are preferable and attractive for the detection of CC owing to the advantages of low cost, fast response, excellent selectivity and high sensitivity.12–14L-Cysteine (L-Cys) is an important amino acid present in natural proteins, acting as cancer indicator, antitoxin, radio protective agent, antioxidant and free radical scavenger,15–18 and it has attracted special attention due to its involvement in many important biological processes, and its chemical activity in the formation of complexes with various ionic species and biomolecules.19,20L-Cys has been widely used to immobilize enzyme, DNA or other substances because of its –SH and –NH2 groups.21–24
Quantum dots (QDs) include a number of nanoparticles composed of IIA–VIA semiconductors or IIIA–VA semiconductors.25,26 Based on the analyte-induced changes in luminescence, QDs have been reported over the past decade for optical sensing of various ions and small molecules.27–30 Among the various quantum dots, those based on ZnS have been considered to be very important for sensors applications because they exhibit enhanced redox activity due to higher charge detaching efficiency and synergetic effects.31–33 Particularly, QDs with core/shell structure have received considerable attention. Research showed that core/shell structure and alloy structure QDs, which have attracted increasing attention, could significantly change both the optical and electrical properties.34–38
Thus, in this work, ZnS:Ni/ZnS QDs with core/shell structure and –COOH group were prepared successfully. Through electropolymerization, L-Cys combined ZnS:Ni/ZnS QDs onto glassy carbon electrode. The electrochemical sensor exhibited attractive performance for determination of CC such as sensitive and fast response, as well as good reproducibility and stability. The sensor was also applied for the determination of CC in lake water with satisfactory results.
2. Experimental
2.1. Reagents and chemicals
Mercaptoacetic acid was purchased from Tianjin Kermel Co. (Tianjin, China). Zinc acetate and nickel acetate were bought from Tianjin chemical reagent Co. (Tianjin, China). L-Cys was purchased from Tianjin Guangfu Co. (Tianjin, China). CC was obtained from Aladdin reagent Co. (Shanghai, China). All the chemicals used were of analytical grade. Phosphate buffer solutions (PBS) (0.1 M) at various pH were prepared by using the stock solutions of Na2HPO4 and NaH2PO4. Doubly distilled water was used throughout the experiments.2.2. Apparatus
Electrochemical measurements were carried out on a CHI 650 electrochemical workstation (CHI, USA) with a three-compartment electrochemical cell containing a modified glassy carbon electrode (GCE) as a working electrode, a platinum wire as an auxiliary electrode and a Ag/AgCl (saturated KCl) electrode as a reference electrode. JEM-2010 transmission electron microscope (JEOL, Japan), SPA-400 atomic force microscope (AFM, Japan), F-7000 spectrofluorometer (Hitachi, Japan), AVATAR360 type Fourier transformed infrared spectrometer (FT-IR, High-Power, USA), X-PertPro type X-ray diffractometer (XRD, Philips, Dutch), PHS-3C pH meter (Dapu, China), DF-101Z water bath pot and DZF-250 vacuum drying oven (Great Wall, China) were used for experiments.2.3. Preparation of ZnS:Ni/ZnS QDs
The core/shell structured ZnS:Ni/ZnS QDs were synthesized following a previously reported method.34 Zn(CH3COO)2, Ni(CH3COO)2 and HSCH2COOH were added sequentially into a three-necked flask containing double-distilled water and the pH was adjusted to 11.0 using NaOH solution. The mixture was purged with nitrogen for 30 min and heated to 80 °C in a water bath. Then, Na2S solution was quickly added into the solution and stirred for 2 h at 80 °C. Subsequently, Zn(CH3COO)2, HSCH2COOH, NaOH and Na2S were added under heating and stirring condition. The abovementioned steps were repeated 5 times. After 5 min, ethanol was added until a homogeneous solution was obtained. Then, obtained dispersions were washed by ethanol and centrifuged three times. The products were dried in a vacuum drying oven at 65 °C to obtain functionalized ZnS:Ni/ZnS QDs.2.4. Preparation of modified electrode
After being polished to a mirror-like surface with 0.05 μm α-Al2O3 and thoroughly rinsed with water, a GCE was sonicated in absolute ethanol and water for 2 min and dried in air for use.Through electropolymerization of L-Cys on GCE surface using cyclic voltammetry between −0.5 V and 2.0 V at 100 mV s−1 in 0.1 M PBS (pH 6.0) containing 5 mM L-Cys for 15 cycles, a L-Cys/GCE was obtained.
Then, the above electrode was placed into 5 mL 0.1 M PBS (pH 6.0) containing 10 mg ZnS:Ni/ZnS QDs solution for 12 h at 4 °C. It was washed thoroughly with doubly distilled water to remove unbound solution, resulting in the development of ZnS:Ni/ZnS@L-Cys/GCE, which was maintained at 4 °C.
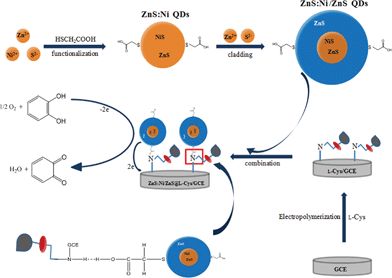
The schematic of the surface functionalization of ZnS:Ni/ZnS QDs and electrode preparation with immobilization of L-Cys and ZnS:Ni/ZnS QDs is shown in Scheme 1, in which the –NH2 group of L-Cys is bound with the –COOH group of ZnS:Ni/ZnS QDs through a hydrogen bond.
3. Results and discussion
3.1. Structure characterization of ZnS:Ni and ZnS:Ni/ZnS QDs
The TEM and AFM images of ZnS:Ni and ZnS:Ni/ZnS QDs were shown in Fig. 1. As seen in Fig. 1A, it was evident that the synthetic ZnS:Ni QDs were uniform with the average size of about 30 nm. After cladding a thin film of ZnS, the diameter of ZnS:Ni/ZnS QDs became larger with the average size of about 80 nm (Fig. 1B). Then, AFM method was carried out to further understand the grain diameter and morphology of ZnS:Ni and ZnS:Ni/ZnS QDs. From Fig. 1C, it can be seen that ZnS:Ni QDs are separated from each other with the diameter about 35 nm, and diameter of ZnS:Ni/ZnS QDs was approximately 88 nm (Fig. 1D). These results of AFM are consistent with TEM information.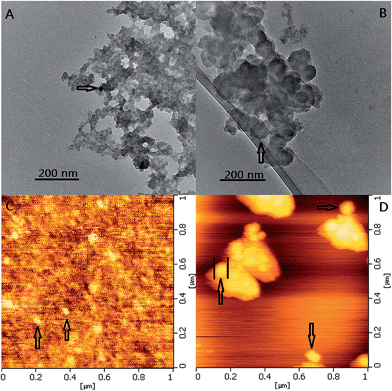 | ||
| Fig. 1 TEM images of ZnS:Ni QDs (A) and ZnS:Ni/ZnS QDs (B); AFM images of ZnS:Ni QDs (C) and ZnS:Ni/ZnS QDs (D). | ||
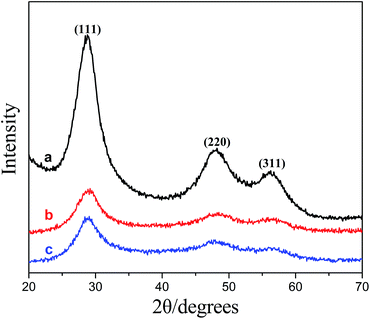
Fig. 2 showed XRD patterns for ZnS (a), ZnS:Ni (b), and ZnS:Ni/ZnS (c). It was quite clear that the three diffraction peaks for the three samples appeared at the same positions, and three particular peaks at 28.9°, 48.3° and 55.7° can be attributed to the (111), (220) and (311) diffraction peaks of ZnS, respectively. For comparison, doping with Ni and further coating with ZnS shell did not change peak positions and number of ZnS, which confirmed that ZnS:Ni/ZnS has the same crystal structure with ZnS.34 The diameters of ZnS:Ni QDs and ZnS:Ni/ZnS QDs were obtained by the Debye–Scherrer equation:
 | (1) |
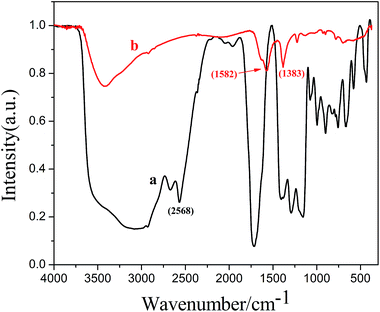
Fourier transform infrared spectrum was used to confirm whether the ZnS:Ni/ZnS QDs were successfully capped with HSCH2COOH (showed in Fig. 3). Disappearance of the peak at 2568 cm−1, corresponding to the S–H stretching modes, indicates the cleavage of the S–H bond and the formation of a new S–Zn bond between HSCH2COOH and ZnS:Ni/ZnS QDs. The peaks found at 1582 cm−1 and 1383 cm−1 are because of C![[double bond, length as m-dash]](https://www.rsc.org/images/entities/char_e001.gif) O, indicating the presence of –COOH in ZnS:Ni/ZnS QDs. All of these results indicate that HSCH2COOH successfully bonds with the ZnS:Ni/ZnS QDs surface through the –SH group of HSCH2COOH.
O, indicating the presence of –COOH in ZnS:Ni/ZnS QDs. All of these results indicate that HSCH2COOH successfully bonds with the ZnS:Ni/ZnS QDs surface through the –SH group of HSCH2COOH.
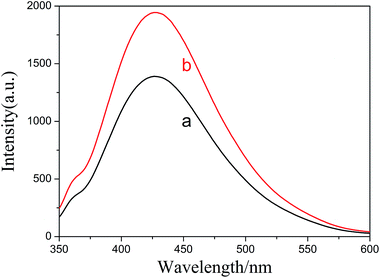
Fluorescence spectra of ZnS:Ni QDs and ZnS:Ni/ZnS QDs were also studied. As was displayed in Fig. 4, ZnS:Ni (curve a) and ZnS:Ni/ZnS (curve b) exhibited fluorescent properties simultaneously, and fluorescence intensity of ZnS:Ni/ZnS was stronger than ZnS:Ni because surface defects existed in the appearance of ZnS:Ni QDs as a result of some Ni2+ of ZnS:Ni located on the surface of QDs. According to the Ostwald ripening theory, newly added Zn2+ and S2− will react on the surface of ZnS:Ni QDs to develop a stratum ZnS, and surface defects can be modified to reduce the surface state level defects, blocking the passage of certain non-radiative transitions; therefore, the fluorescence intensity of ZnS:Ni/ZnS QDs was strengthened.
3.2. Electropolymerization of L-Cys
Cyclic voltammetry was used to form the polymer film. The prepared L-Cys/GCE was obtained through electrochemical polymerization with different cycles. Fig. 5 showed that at first the current increased with increase in polymerization cycles, and then decreased when the polymerization scans were more than 15 cycles. Therefore, 15 cycles of electrochemical polymerization was regarded as the optimum condition.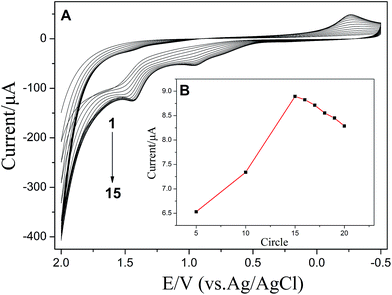 | ||
| Fig. 5 Electropolymerization of L-Cys on GCE in 0.1 M PBS (pH 6.0) containing 5 mM L-Cys (A) and the relationship between peak current and the number of circles (B). | ||
3.3. Electrochemical behavior of CC
Electrochemical behaviors of CC at ZnS:Ni/ZnS@L-Cys/GCE (curve a), ZnS:Ni@L-Cys/GCE (curve b), ZnS:Ni/ZnS/GCE (curve c), L-Cys/GCE (curve d) and bare GCE (curve e) in 0.1 M PBS (pH 5.5) containing 0.2 mM CC are shown in Fig. 6. It was clear that the magnitude of the peak current at ZnS:Ni/ZnS@L-Cys/GCE increased compared to that of other electrodes. Because of the supreme catalytic activity to the redox reaction of catechol, ZnS:Ni/ZnS QDs and L-Cys were selected as the ultimate electrode material to construct the sensor.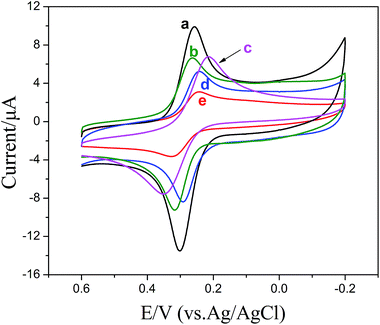 | ||
| Fig. 6 CVs of ZnS:Ni/ZnS@L-Cys/GCE (a), ZnS:Ni@L-Cys/GCE (b), ZnS:Ni/ZnS/GCE (c), L-Cys/GCE (d) and bare GCE (e) in 0.1 M PBS (pH 5.5) containing 0.2 mM catechol. | ||
3.4. Effect of pH on the electrochemical behavior of CC
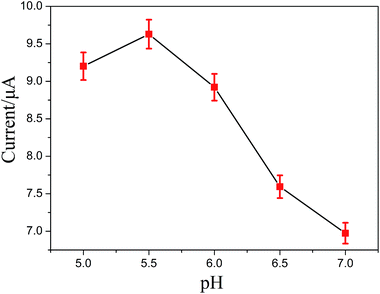
It is well known that the pH value of PBS is crucial for the performance of the sensor. The effect of pH value on the determination of CC at the ZnS:Ni/ZnS@L-Cys/GCE was carefully investigated over a range of 5.0–7.0. As shown in Fig. 7, the oxidation peak currents of CC increased with increasing pH value until it reached 5.5, and then decreased when the pH increased further. Therefore, in order to obtain high sensitivity, pH 5.5 was selected as the optimal experimental condition.3.5. Effect of scan rate
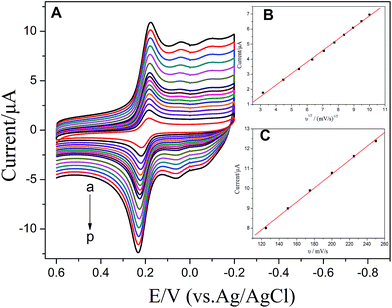
Fig. 8 shows the CV curves at various scan rates (10–250 mV s−1) of 100 μM CC (A) at the ZnS:Ni/ZnS@L-Cys/GCE. The results showed that the oxidation peak currents increased with the increase of the scan rate. As shown in Fig. 8B, the CC current increased linearly with the square root of the scan rate in the range of 10–100 mV s−1 as per the linear-regression equation: i (μA) = 0.7655 × υ1/2 ((mV s−1)1/2) − 0.7792 with a correlation coefficient of 0.9991; moreover, the oxidation peak currents increased with increase in the scan rate in the range of 125–250 mV s−1 (C). The regression equation of CC was i (μA) = 0.03506 × υ (mV s−1) + 3.712 with a correlation coefficient of 0.9992. Therefore, with increasing scan rates, the electrode reaction of CC gradually changed from diffusion into the modified electrode surface to the adsorption at the electrode surface.3.6. Linear range and limit of detection
Fig. 9A showed the CVs at ZnS:Ni/ZnS@L-Cys/GCE at various concentrations of CC (0.5–100 μM). Fig. 9B showed the plots of the oxidation currents vs. concentrations of CC (0.5–100 μM). The linear-regression equation is i (μA) = 0.05450 × c (μM) + 1.678 with a correlation coefficient of 0.9983. When the signal to noise ratio is 3, the detection limits of CC was 32 nM.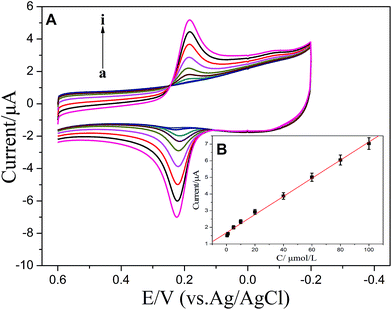 | ||
| Fig. 9 (A) CVs of various concentrations of CC from 0.5 to 100 μM in 0.1 M PBS (pH 5.5): a–i: 0.5, 1, 5, 10, 20, 40, 60, 80 and 100 μM. (B) Inset shows the calibration plots of CC. | ||
Compared with the previous related reports, this method shows more high sensitivity for the determination of CC (Table 1).
3.7. Interference of coexisting substances
The influence of various substances on the determination of 100 μM CC was studied. The tolerance limit was estimated to less than 5% of the error. It was found that 1000-fold K+, Na+, Ca2+, Mg2+, Fe3+, Cl−, I−, SO42−, NO3−, and HCO3− and 100-fold glucose, sodium citrate, cupric acetate, soluble starch and cinnamic acid did not interfere with the determination; moreover, as interference, equal concentration of hydroquinone was also researched. Experiments showed that although there were peaks of hydroquinone appearing in the cyclic voltammograms, the peak potentials of hydroquinone were separated from that of CC in the range of −0.2 to 0.6 V. This indicated that the influence of hydroquinone was inappreciable.3.8. Reproducibility and stability of ZnS:Ni/ZnS@L-Cys/GCE
The reproducibility of ZnS:Ni/ZnS@L-Cys/GCE was examined by measuring the responses of 100 μM CC for eight successive measurements and relative standard deviation (RSD) is 1.72%, indicating that the modified electrode exhibited a good reproducibility. After 50 consecutive CV measurements, the anodic peak current of CC was reduced to 96.47% of the initial response.The good stability and repeatability of the composite modified electrode make them attractive to fabricate electrochemical sensors for practical applications.
3.9. Application in the real samples and recovery test
In order to assess the possible applications of the proposed method, the proposed sensor was applied to determine CC in the lake water sample using the standard addition method. The result is shown in Table 2, and the recoveries ranged between 98.3% and 101.8%.| Added/μM | Found/μM | Recovery/% |
|---|---|---|
| 40.0 | 40.4 | 101.0 |
| 60.0 | 61.1 | 101.8 |
| 80.0 | 80.1 | 100.1 |
| 100.0 | 98.3 | 98.3 |
4. Conclusions
In summary, ZnS:Ni/ZnS QDs with core/shell structure were synthesized via water-soluble route successfully, which were water-soluble, non-toxic and had stronger electrochemical activity. Based on this, a novel electrochemical sensor for sensitive determination of CC was fabricated. The wide linear range, high sensitivity, fast and stable response as well as the effective discrimination to the possible interferences at ZnS:Ni/ZnS@L-Cys/GCE make it a promising candidate for designing effective CC sensor, and the method was successfully examined for real samples analysis with satisfactory results.References
- L. Tang, Y. Y. Zhou, G. M. Zeng, Z. Li, Y. Y. Liu, Y. Zhang, G. Q. Chen, G. D. Yang, X. X. Lei and M. S. Wu, Analyst, 2013, 138, 3552 RSC
.
- H. F. Wang, Y. Y. Wu and X. P. Yan, Anal. Chem., 2013, 85, 1920 CrossRef CAS PubMed
.
- A. J. S. Ahammad, M. M. Rahman, G. R. Xu, S. Y. Kim and J. J. Lee, Electrochim. Acta, 2011, 56, 5266 CrossRef CAS PubMed
.
- Q. H. Guo, J. S. Huang, P. Q. Chen, Y. Liu, H. Q. Hou and T. Y. You, Sens. Actuators, B, 2012, 163, 179 CrossRef CAS PubMed
.
- S. C. Moldoveanu and M. Kiser, J. Chromatogr. A, 2007, 1141, 90 CrossRef CAS PubMed
.
- S. F. Li, X. Z. Li, J. Xu and X. W. Wei, Talanta, 2008, 75, 32 CrossRef CAS PubMed
.
- Y. G. Sun, H. Cui, Y. H. Li and X. Q. Lin, Talanta, 2000, 53, 661 CrossRef CAS
.
- M. F. Pistonesi, M. S. Di Nezio, M. E. Centurión, M. E. Palomeque, A. G. Lista and B. S. F. Band, Talanta, 2006, 69, 1265 CrossRef CAS PubMed
.
- H. Cui, C. X. He and G. W. Zhao, J. Chromatogr. A, 1999, 855, 171 CrossRef CAS
.
- A. Asan and I. Isildak, J. Chromatogr. A, 2003, 988, 145 CrossRef CAS
.
- J. A. Garcia-Mesa and R. Mateos, Food Chem., 2007, 55, 3863 CrossRef CAS PubMed
.
- H. L. Qi and C. X. Zhang, Electroanalysis, 2005, 17, 832 CrossRef CAS
.
- C. L. Yang, Y. Q. Chai, R. Yuan, W. J. Xu and S. H. Chen, Anal. Methods, 2013, 5, 666 RSC
.
- K. J. Wang, L. Wang, Y. J. Liu, T. Gan, Y. M. Liu, L. L. Wang and Y. Fan, Electrochim. Acta, 2013, 107, 379 CrossRef PubMed
.
- P. C. Pandey, A. K. Pandey and D. S. Chauhan, Electrochim. Acta, 2012, 74, 23 CrossRef CAS PubMed
.
- S. D. Fei, J. H. Chen, S. Z. Yao, G. H. Deng, D. L. He and Y. F. Kuang, Anal. Biochem., 2005, 339, 29 CrossRef CAS PubMed
.
- L. P. Liu, Z. J. Yin and Z. S. Yang, Bioelectrochemistry, 2010, 79, 84 CrossRef CAS PubMed
.
- S. M. Majd, H. Teymourian and A. Salimi, Electroanalysis, 2013, 25, 2201 CrossRef CAS
.
- S. Kazemi, H. K. Maleh, R. Hosseinzadeh and F. Faraji, Ionics, 2013, 19, 933 CrossRef CAS
.
- J. B. Raoof, F. Chekin, R. Ojani and S. Barari, J. Chem. Sci., 2013, 125, 283 CrossRef CAS PubMed
.
- C. H. Yang, T. Liu and S. H. Zhang, J. Food Sci., 2009, 30, 158 CAS
.
- J. L. Duan, X. C. Jiang, S. Q. Ni, M. Yang and J. H. Zhan, Talanta, 2011, 85, 1738 CrossRef CAS PubMed
.
- J. Sun, R. L. Yu, L. Miao, D. L. Zhong, J. Liu and G. H. Gu, J. Cent. South Univ. Technol., 2011, 18, 1389 CrossRef CAS
.
- D. W. Deng, L. Z. Qu, Y. Li and Y. Q. Gu, Langmuir, 2013, 29, 10907 CrossRef CAS PubMed
.
- Q. Ma and X. G. Su, Analyst, 2011, 136, 4883 RSC
.
- H. S. Mansur, Wiley Interdiscip. Rev.: Nanomed. Nanobiotechnol., 2010, 2, 113 CrossRef CAS PubMed
.
- L. Y. Ding, C. Fan, Y. M. Zhong, T. Li and J. Huang, Sens. Actuators, B, 2013, 185, 70 CrossRef CAS PubMed
.
- J. M. Costa-Fernández, R. Pereiro and A. Sanz-Medel, TrAC, Trends Anal. Chem., 2006, 25, 207 CrossRef PubMed
.
- W. J. Jin, M. T. Fernández-Argüelles, J. M. Costa-Fernández, R. Pereiro and A. Sanz-Medel, Chem. Commun., 2005, 883 RSC
.
- R. C. Somers, M. G. Bawendi and D. G. Nocera, Chem. Soc. Rev., 2007, 36, 579 RSC
.
- P. Wu, J. Y. Zhang, S. L. Wang, A. R. Zhu and X. D. Hou, Chem.–Eur. J., 2014, 20, 952 CrossRef CAS PubMed
.
- R. Freeman, T. Finder, L. Bahshi, R. Gill and L. Willner, Adv. Mater., 2012, 24, 6416 CrossRef CAS PubMed
.
- H. D. Duong, C. V. Gopal Reddy, J. Rhee and T. Vo-Dinh, Sens. Actuators, B, 2011, 157, 139 CrossRef CAS PubMed
.
- J. Y. Qu, Z. Y. Zhu, C. D. Wu, L. J. Zhang and J. H. Qu, Spectrochim. Acta, Part A, 2014, 121, 350 CrossRef CAS PubMed
.
- K. Cheng, Z. Fang, Y. F. Ma and H. Zhang, Chin. J. Inorg. Chem., 2013, 29, 326 CAS
.
- H. Y. Shin, D. S. Jang and Y. Jang, J. Mater. Sci.: Mater. Electron., 2013, 24, 3744 CrossRef CAS PubMed
.
- R. J. Gui, X. Q. An, H. J. Su, W. G. Shen, Z. Y. Chen and X. Y. Wang, Talanta, 2012, 94, 257 CrossRef CAS PubMed
.
- H. D. Duong and J. Rhee II, Talanta, 2007, 73, 899 CrossRef CAS PubMed
.
- Y. P. Ding, W. L. Liu, Q. S. Wu and X. G. Wang, J. Electroanal. Chem., 2005, 575, 275 CrossRef CAS PubMed
.
- Z. H. Wang, S. J. Li and Q. Z. Lv, Sens. Actuators, B, 2007, 127, 420 CrossRef CAS PubMed
.
- D. M. Zhao, X. H. Zhang, L. J. Feng and S. F. Wang, Colloids Surf., B, 2009, 74, 317 CrossRef CAS PubMed
.
- J. T. Han, K. J. Huang, J. Li, Y. M. Liu and M. Yu, Colloids Surf., B, 2012, 98, 58 CrossRef CAS PubMed
.
- Y. Umasankar, A. P. Periasamy and S. M. Chen, Anal. Biochem., 2011, 411, 71 CrossRef CAS PubMed
.
- H. S. Yin, Q. M. Zhang, Y. L. Zhou, Q. Ma, T. Liu, L. S. Zhou and S. Y. Ai, Electrochim. Acta, 2011, 56, 2748 CrossRef CAS PubMed
.
- K. J. Huang, L. Wang, J. Li, M. Yu and Y. M. Liu, Microchim. Acta, 2013, 180, 751 CrossRef CAS
.
| This journal is © The Royal Society of Chemistry 2015 |

