Synthesis of shape-controlled La2NiO4+δ nanostructures and their anisotropic properties for oxygen diffusion†
X.
Ma
a,
B.
Wang
a,
E.
Xhafa
a,
K.
Sun
b and
E.
Nikolla
*a
aDepartment of Chemical Engineering and Materials Science, Wayne State University, Detroit, MI, USA. E-mail: erandan@wayne.edu; Tel: +1-313-577-4159
bDepartment of Materials Science and Engineering, University of Michigan, Ann Arbor, MI, USA. E-mail: kaisun@umich.edu; Tel: +1-734-936-3353
First published on 4th November 2014
Abstract
This study highlights the synthesis of shape-controlled La2NiO4+δ nanostructures using a reverse microemulsion method. We report that surfactant to water mass ratio plays a key role in controlling the shape of the nanostructures. These nanostructures show a strong dependence of their oxygen transport properties on their geometries.
Lanthanum nickelate oxide (La2NiO4+δ, LNO) with Ruddlesden–Popper-type structure has attracted considerable interest as a potentially efficient catalyst for oxygen reduction/evolution in energy storage and conversion systems, owing to its high oxygen transport/exchange properties.1 Previous experimental studies on LNO single crystals2 and thin films3 have shown that oxygen transport and catalytic activity depend strongly on the LNO defect chemistry and surface planes. Theoretical calculations4 have also suggested that interstitial oxygen migration as well as surface atomic arrangement of these materials play a role in their catalytic activity toward reactions involving oxygen. Therefore, synthesis of nanostructured LNO catalysts with well-defined surface facets is desirable for (i) tuning their reactivity, and (ii) understanding key factors governing their catalytic performance at the molecular level. Traditionally, Ruddlesden–Popper series oxides are prepared using solid-state and sol–gel synthesis approaches, which do not allow for control over their structural morphology and surface structure.5 In this Communication, for the first time, we demonstrate the ability to synthesize nanostructured LNO catalysts with preferential surface morphology using a reverse microemulsion method. We show that oxygen transport in these materials depends strongly on their nanostructures.
The proposed approach for synthesizing LNO nanostructures involves initially, the formation of a LNO precursor complexes through the reaction of two separate microemulsions with one containing metal cations and the other precipitating anions. This is followed by subsequent calcination to convert the precursor complex to oxide crystals. The preferential morphology of LNO is achieved by controlling the size and shape of the precursor complex through the manipulation of the composition of the reverse microemulsions and the selection of the precipitating agent, as discussed in detail below.
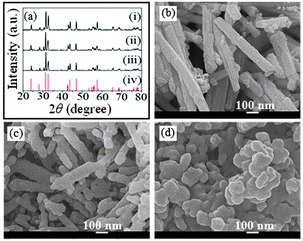
Fig. 1 shows X-ray diffraction (XRD) patterns and scanning electron microscope (SEM) images of different LNO nanostructures synthesized using the reverse microemulsion approach. In all these studies, a quaternary reverse microemulsion system composed of cetyltrimethylammonium bromide (CTAB)–water–hexane–n-butanol was selected for the synthesis of the precursor complex, while NaOH was used as the precipitating agent. The CTAB to H2O mass ratio (W0) in the metal cation reverse microemulsion solution was varied while all the other synthesis parameters were kept constant. The XRD patterns depicted in Fig. 1a show that the crystal structures of all the synthesized LNO samples are consistent with standard bulk LNO (JCPDS No. 34-0314, Fig. 1a-iv), which has a K2NiF4 structure (I4/mmm space group, a = b = 3.86 Å, c = 12.68 Å).
X-ray energy dispersive spectroscopy (EDS) elemental analysis of all the synthesized materials shows a La to Ni ratio of 2![[thin space (1/6-em)]](https://www.rsc.org/images/entities/char_2009.gif) :
:![[thin space (1/6-em)]](https://www.rsc.org/images/entities/char_2009.gif) 1, which is consistent with the stoichiometry of La2NiO4 (see ESI,† Fig. S1). We found that when a W0 of 1.6 was used in the synthesis, LNO nanostructures with rod-shaped geometry were obtained as illustrated by the SEM image in Fig. 1b. These LNO nanorods were uniform in diameter along the longitudinal axis with an average value of approximately 40 nm and a length of approximately 500 nm. As W0 was increased to 6.0, a mixture of shorter (less than 300 nm in length) LNO nanorods was obtained, as depicted in the SEM image shown in Fig. 1c. When W0 was further increased to 14.0, the resulting LNO crystals had mainly a polyhedral nanostructure (spherical geometry) with an average size of 30–50 nm, as shown in Fig. 1d. We found that in all these studies, the structural morphologies of the LNO precursor complexes (see ESI,† Fig. S2) were similar to the corresponding oxides (Fig. 1b and c), suggesting no significant sintering effects during calcination as corroborated by SEM.
1, which is consistent with the stoichiometry of La2NiO4 (see ESI,† Fig. S1). We found that when a W0 of 1.6 was used in the synthesis, LNO nanostructures with rod-shaped geometry were obtained as illustrated by the SEM image in Fig. 1b. These LNO nanorods were uniform in diameter along the longitudinal axis with an average value of approximately 40 nm and a length of approximately 500 nm. As W0 was increased to 6.0, a mixture of shorter (less than 300 nm in length) LNO nanorods was obtained, as depicted in the SEM image shown in Fig. 1c. When W0 was further increased to 14.0, the resulting LNO crystals had mainly a polyhedral nanostructure (spherical geometry) with an average size of 30–50 nm, as shown in Fig. 1d. We found that in all these studies, the structural morphologies of the LNO precursor complexes (see ESI,† Fig. S2) were similar to the corresponding oxides (Fig. 1b and c), suggesting no significant sintering effects during calcination as corroborated by SEM.
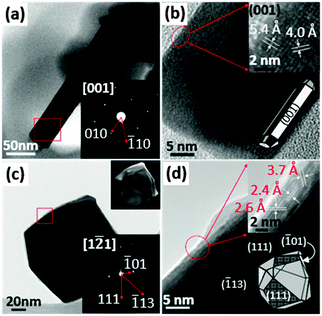
To examine the surface structure of LNO nanorods and polyhedra, transmission electron microscopy (TEM) imaging and selected area electron diffraction (SAED) studies of the LNO nanostructures were conducted. Fig. 2a shows the bright-field (BF) TEM image and the corresponding SAED pattern (the inset) of an individual LNO nanorod obtained along the [001] zone axis. The high resolution TEM (HRTEM) images in Fig. 2b show continuous lattice fringes, which also confirms the (001) surface facets perpendicular to the projected zone axis. Analysis of the SAED pattern along with d-spacing in HRTEM images suggests that the LNO nanorod grows along its [010] direction, terminated by (001) facet on the sides and (010) facets at the end of the rod, as depicted by a [001] projected model in Fig. 2b (the bottom inset).
The TEM images and the corresponding SAED pattern of a typical LNO polyhedron are shown in Fig. 2c and d. Analysis of the SAED pattern (bottom inset in Fig. 2a), BF/DF (top inset in Fig. 2a) and the HRTEM images (Fig. 2b) suggest that the polyhedron is single crystalline in nature. It also shows that the polyhedron is terminated by a mixture of irregularly-distributed surface facets, including (111), (![[1 with combining macron]](https://www.rsc.org/images/entities/char_0031_0304.gif) 13), and (
13), and (![[1 with combining macron]](https://www.rsc.org/images/entities/char_0031_0304.gif) 01) as indicated by the diffraction pattern recorded along [1
01) as indicated by the diffraction pattern recorded along [1![[2 with combining macron]](https://www.rsc.org/images/entities/char_0032_0304.gif) 1] zone axis (bottom inset in Fig. 2a).
1] zone axis (bottom inset in Fig. 2a).
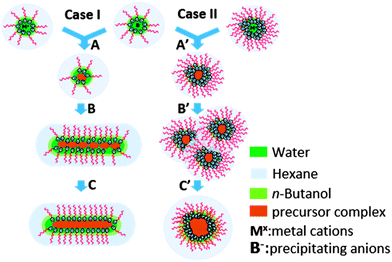
The results described above demonstrate the ability to control the shape and surface structure of LNO by varying the surfactant to water mass ratio in the reverse microemulsion method. The role of CTAB to water ratio in controlling the shape of the precursor complex can be explained by its influence on the preferential adsorption of CTAB during the formation of the precursor complex. It has been proposed that the formation of nanostructures using a reverse microemulsion synthesis follows an aggregation growth process consisting of three stages (Scheme 1).6 During the initial stage, reverse microemulsion droplets containing cationic and anionic reactants fuse together and the metal ions co-precipitate inside of the fused droplets. This results in the generation of small solid nuclei, which serve as building blocks for particle growth. In the second stage, the solid nuclei aggregate loosely through intermicellar exchange. Finally, the aggregated nuclei coalesce together to form large particle assemblages, known as the precursor complexes. It has been shown that the preferential interaction between the solid nuclei and the surfactant shell of the droplets at the initial stage plays a key role in determining the shape of the resulting precursor complex.7 This can explain the dependence of the geometry of the nanostructures discussed above on the CTAB to H2O ratio during synthesis. In the case when a low CTAB to H2O mass ratio is used in the synthesis (case I in Scheme 1), the low concentration of CTAB leads to low coverage of CTAB on the solid nuclei.6b,8 This enables the partially CTAB covered solid nuclei (building blocks) to associate strongly through the uncovered surface in a particular direction, and coalesce into precursor complexes with rod-shaped structures (see ESI,† Fig. S2a). On the other hand, when a high CTAB to water ratio is used in the synthesis (case II in Scheme 1), the excess of CTAB leads to unselective adsorption on high and low energy surfaces of the building blocks and high coverage of the surface by CTAB. This results in no directional aggregation of the building blocks, thus generating a precursor complex with irregular morphology after coalescence of the nuclei (see ESI,† Fig. S2c). In addition, the high degree of surface coverage of nuclei with CTAB leads to slower rates of coalescencing and results in the generation of polyhedral type structures with similar size to that of the nuclei. This suggests that one can control the size of the final LNO crystals by varying the size of the solid nuclei through regulation of the metal ion precipitation rate. To verify this hypothesis, we replaced the precipitating agent (which controls the precipitation rate), NaOH, with Na2CO3 for the synthesis of the precursor complex, while keeping all the other synthesis parameters consistent to those used in Fig. 1d. Since Na2CO3 is a stronger precipitating agent for metal ions than NaOH,9 it should lead to higher precipitation rates, and thus the generation of solid nuclei and consequently, precursor complex (metal carbonate) with smaller size when compared to the case of NaOH. This is confirmed by the SEM images (see ESI,† Fig. S3a), which show that the resultant precursor complex (metal carbonate) in the case of Na2CO3 has a similar geometry but smaller diameter than the resultant precursor complex obtained when NaOH is used as the precipitating agent (see ESI,† Fig. S2c). These results suggest that the size of the precursor complex can be controlled by tuning the rate of the precipitation of the metal ions. While the metal carbonate precursor complex was smaller in size than the metal hydroxide precursor complex, we found that the transformation of the metal carbonate precursor complex to LNO crystal required calcination at higher annealing temperatures in air (see ESI,† Fig. S3b) as compared to the metal hydroxide precursor complex, which was easily calcined at lower temperatures in argon atmosphere to minimize sintering. Consequently, this process led to the agglomeration and sintering of the carbonate precursor complex particles into larger LNO particles (see ESI,† Fig. S3c). These results suggest that while the precipitating agent plays an important role in controlling the size of the precursor complex formed in the process, it is also important that the resultant precursor complex can be calcined to the final oxide structure under conditions that minimize sintering in order to preserve the nanostructure.
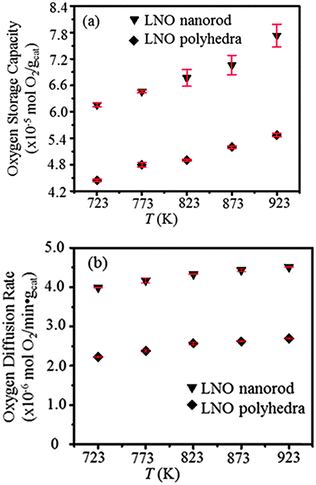
In order to determine the oxygen transport and defect properties of the LNO nanostructures with different geometries, we have employed controlled thermal gravimetric analysis (TGA) studies. As mentioned above, LNO is characterized by a layered oxide structure consisting of alternating perovskite-like layers and rocksalt-like layers that are shown to accommodate interstitial oxygen in the lattice that facilitate oxygen migration/transport in these materials.10 Oxygen migration has been directly linked to variations in the oxygen stoichiometry that can be measured using controlled TGA studies.11 In our experiments, the weight of LNO was quantitatively monitored as it was exposed to air and argon (Ar) sequentially. The increase in the weight of the material was attributed to oxygen uptake during exposure to air, while the decrease in the weight was attributed to the migration of oxygen to the gas phase. Air–Ar cycling experiments were performed as a function of temperature from 723 K to 923 K. The oxygen uptake/release at each temperature was fairly reproducible along the consecutive air–Ar cycling for both LNO nanorods and polyhedra (see ESI,† Fig. S4), suggesting high reversibility of oxygen exchange between the gas phase and the lattice of these materials. The appearance of a constant weight response (i.e. the flat signal range in the pattern) vs. time in each cycle suggested the establishment of a dynamic equilibrium. This was also affiliated with the complete saturation or release of oxygen in each cycle of the experiment. The oxygen storage capacity of the oxygen atoms that could be shuttled in and out of the lattice of LNO polyhedra increased with increasing temperature reaching 5.47 × 10⁻⁵ mol O2 per gcat at 923 K (Fig. 3a). This value is consistent with the reported interstitial oxygen (δ) variation of LNO ceramics treated under air and inert gas at 923 K, determined by X-ray adsorption near-edge structure (XANES) spectroscopy,12 and TGA studies.11 A similar trend of the capacity vs. temperature was observed for LNO with rod-shaped morphology, but with a capacity approximately 35% higher than the LNO polyhedra throughout the tested temperature range (Fig. 3a). This observation implies that the accessibility of the defect oxygen in the rod-shaped LNO nanostructures is more facile than in the case of LNO nanostructures with polyhedral geometry. This is supported by the measured oxygen diffusion rates in these materials plotted in Fig. 3b. The oxygen diffusion rate was defined as the amount of oxygen released per minute, per gram of the catalyst. The oxygen diffusion rate in LNO nanorods was determined to be approximately 70% higher than that in LNO polyhedra as shown in Fig. 3b. This dependence of the rate of oxygen diffusion on the surface structure (structural morphology) of LNO is consistent with reports on single-crystal LNO studies using isotope exchange depth profile process-secondary ion mass spectroscopy (IEDP-SIMS), where it was shown that the activation barrier for oxygen diffusion depended on the surface termination of the single crystal with the direction along the [001] having the lowest energy barrier in a temperature range from 673 K to 1173 K.2 This supports our observations that LNO nanorods with higher fraction of (001) surface facets exhibit higher oxygen transport rates as compared to LNO polyhedra that contain a mixture of irregularly distributed surface facets.
In summary, LNO nanostructures with well-defined morphologies have been synthesized using a facile reverse microemulsion based method. The key factor in controlling the shape of LNO is the CTAB to H2O mass ratio whose function is to regulate the degree of preferential adsorption of CTAB on the solid nuclei. This consequently impacts the growth of the LNO precursor complex. Our findings show that low CTAB to H2O mass ratios lead to the formation of rod-shaped LNO nanostructure with high density of (001) surface facets. On the other hand high CTAB to water mass ratios lead to the formation of polyhedral-shaped nanostructures that contain a mixture of irregularly distributed surface facets. We also report that the geometry of the LNO nanostructures greatly impacts the oxygen mobility in these materials. Rod-shaped LNO nanostructures lead to 75% enhancement in oxygen transport rates when compared to polyhedral-shaped LNO nanostructures, potentially due to higher fraction of (001) terminated surface facets. We anticipate that the results presented herein open up avenues to enhance the catalytic activity of nickelate oxide catalysts by tuning their nanostructures.
We gratefully acknowledge the support of the National Science Foundation (CBET-1226569).
Notes and references
- (a) M. S. D. Read, M. S. Islam, F. King and F. E. Hancock, J. Phys. Chem. B, 1999, 103(9), 1558–1562 CrossRef CAS; (b) G. Amow, I. J. Davidson and S. J. Skinner, Solid State Ionics, 2006, 177(13–14), 1205–1210 CrossRef CAS PubMed; (c) E. Boehm, J. M. Bassat, P. Dordor, F. Mauvy, J. C. Grenier and P. Stevens, Solid State Ionics, 2005, 176(37–38), 2717–2725 CrossRef CAS PubMed.
- J. M. Bassat, P. Odier, A. Villesuzanne, C. Marin and M. Pouchard, Solid State Ionics, 2004, 167(3–4), 341–347 CrossRef CAS PubMed.
- (a) M. Burriel, G. Garcia, J. Santiso, J. A. Kilner, R. J. Chater and S. J. Skinner, J. Mater. Chem., 2008, 18(4), 416–422 RSC; (b) G. Kim, S. Wang, A. J. Jacobson and C. L. Chen, Solid State Ionics, 2006, 177(17–18), 1461–1467 CrossRef CAS PubMed.
- (a) A. Chroneos, B. Yildiz, A. Tarancon, D. Parfitt and J. A. Kilner, Energy Environ. Sci., 2011, 4(8), 2774–2789 RSC; (b) A. Chroneos, D. Parfitt, J. A. Kilner and R. W. Grimes, J. Mater. Chem., 2010, 20(2), 266–270 RSC; (c) M. S. D. Read, M. S. Islam, G. W. Watson and F. E. Hancock, J. Mater. Chem., 2001, 11(10), 2597–2602 RSC.
- (a) Y. Shen, H. Zhao, X. Liu and N. Xu, Phys. Chem. Chem. Phys., 2010, 12(45), 15124–15131 RSC; (b) T. Inprasit, P. Limthongkul and S. Wongkasemjit, J. Electrochem. Soc., 2010, 157(11), B1726–B1730 CrossRef CAS PubMed.
- (a) M. Li and S. Mann, Langmuir, 2000, 16(17), 7088–7094 CrossRef CAS; (b) J. D. Hopwood and S. Mann, Chem. Mater., 1997, 9(8), 1819–1828 CrossRef CAS; (c) S. Sharma, N. Pal, P. K. Chowdhury, S. Sen and A. K. Ganguli, J. Am. Chem. Soc., 2012, 134(48), 19677–19684 CrossRef CAS PubMed; (d) S. Sharma and A. K. Ganguli, J. Phys. Chem. B, 2014, 118(15), 4122–4131 CrossRef CAS PubMed.
- (a) B. R. Heywood and S. Mann, Adv. Mater., 1994, 6(1), 9–20 CrossRef CAS; (b) M.-P. Pileni, Nat. Mater., 2003, 2(3), 145–150 CrossRef CAS PubMed; (c) K. Holmberg, J. Colloid Interface Sci., 2004, 274(2), 355–364 CrossRef CAS PubMed.
- (a) M. Li, H. Schnablegger and S. Mann, Nature, 1999, 402(6760), 393–395 CrossRef CAS PubMed; (b) B. A. Simmons, S. Li, V. T. John, G. L. McPherson, A. Bose, W. Zhou and J. He, Nano Lett., 2002, 2(4), 263–268 CrossRef CAS; (c) A. K. Ganguli, A. Ganguly and S. Vaidya, Chem. Soc. Rev., 2010, 39(2), 474–485 RSC; (d) B. Kong, B. Guan, M. Z. Yates and Z. Wu, Langmuir, 2012, 28(40), 14137–14142 CrossRef CAS PubMed.
- D. R. Lide, Handbook of Chemistry and Physics, CRC press, 84th edn, 2004 Search PubMed.
- (a) C. Frayret, A. Villesuzanne and M. Pouchard, Chem. Mater., 2005, 17(26), 6538–6544 CrossRef CAS; (b) J. A. Kilner and M. Burriel, Annu. Rev. Mater. Res., 2014, 44(1), 365–393 CrossRef CAS.
- J. D. Jorgensen, B. Dabrowski, S. Pei, D. R. Richards and D. G. Hinks, Phys. Rev. B: Condens. Matter Mater. Phys., 1989, 40(4), 2187–2199 CrossRef CAS.
- R. J. Woolley, B. N. Illy, M. P. Ryan and S. J. Skinner, J. Mater. Chem., 2011, 21(46), 18592–18596 RSC.
Footnote |
| † Electronic supplementary information (ESI) available: Experimental details. See DOI: 10.1039/c4cc07364a |
| This journal is © The Royal Society of Chemistry 2015 |


