Plasmon-enhanced fluorescence of PbS quantum dots for remote near-infrared imaging†
Ke
Wu
a,
Junpei
Zhang
b,
Shanshan
Fan
b,
Juan
Li
a,
Chao
Zhang
a,
Keke
Qiao
c,
Lihua
Qian
*a,
Junbo
Han
b,
Jiang
Tang
c and
Shuai
Wang
*d
aSchool of Physics, Huazhong University of Science and Technology, Wuhan, 430074, China. E-mail: lhqian@hust.edu.cn
bWuhan National High Magnetic Field Center, Huazhong of University Science and Technology, Wuhan, 430074, China
cWuhan National Laboratory for Optoelectronics (WNLO), Huazhong University of Science and Technology, Wuhan, 430074, China
dSchool of Chemistry and Chemical Engineering, Huazhong University of Science and Technology, Wuhan, 430074, China. E-mail: chmsamuel@hust.edu.cn
First published on 5th November 2014
Abstract
Gold nanoparticles with nanoscale protrusions can be synthesized by seed-mediated growth in favor of tuning the surface plasmon band towards the near-infrared regime. Electromagnetic field enhancement makes significant contribution to improve fluorescence emission of PbS quantum dots in the near-infrared window, identifying their application in remote imaging by collecting the scattered fluorescence of their hybrids.
Excitation of surface plasmon resonance (SPR) can generate a huge electromagnetic field on the surfaces of metal nanoparticles (NPs),1,2 which holds many promising applications including plasmon-enhanced fluorescence (PEF),3–5 plasmon-enhanced Raman scattering (PERS),6,7 biological imaging,8–10 thermo-physical therapy of tumors,11etc. Fluorescence emission intrinsically depends on the absorption and emitting cross-sections of the fluorophores detected, such as organic molecules12,13 and quantum dots (QDs).14–17 Meanwhile, fluorescence intensity is extrinsically a function of the electromagnetic field where the fluorophores are situated. When the fluorophores reside in close proximity to the metal surface, they exhibit fluorescence emission, which is different from that it would exhibit in free space. In the optimal experimental configurations, more photons can be trapped by the fluorophores, resulting in more electrons that can be excited to high energy levels. On the other hand, increased radiative relaxation of the excited fluorophores occurs as energy is coupled to surface plasmons on the metal surface.2,18
To enhance the fluorescence emission of the fluorophores, the optimal location of the SPR band becomes the first consideration. So far, gold nanostructures with distinct morphologies, such as metallic grating,19 nanorods20,21 and nanopores22etc., have been reported to enhance the fluorescence emission of some organic molecules.
While only a few investigations focus on the enhanced fluorescence of QDs including CdTe,23 CdSe,24,25 and Si QDs,26,27 especially the enhanced fluorescence of the QDs in near-infrared (NIR) regimes.28 In comparison with the PEF in the visible window, the enhanced fluorescence excited and emitted in the NIR regimes holds the potential applications in biological sensing,29–31 cellular imaging32 and remote tracking of the drug delivery or release33 due to the transparency of human skin within this window. In our previous investigation, a silver nanowire is applied as the optical antenna to enhance the fluorescence spectroscopy of CdTe QDs, while emitting behavior significantly depends on laser polarization because different plasmonic modes are excited within an anisotropic nanowire. PbS QDs exhibit fluorescence emission upon excitation with the NIR laser, and they can serve as the fluorescence label for cell imaging. To improve the brightness of PbS QDs and the imaging depth, isotropic metal NPs with the SPR band in the NIR regime are required to enhance fluorescence emission of PbS QDs, which is independent of laser polarization. Herein, we demonstrate the precise control over the nearly-isotropic geometries of Au NPs during the seed-mediated growth. The plasmon band of Au NPs can be tuned from the visible to NIR regime, so that they can be utilized to enhance the fluorescence signal of PbS QDs with the excitation of the NIR laser. This optimized performance facilitates the direct imaging of the PbS QDs by remotely collecting their scattered fluorescence.
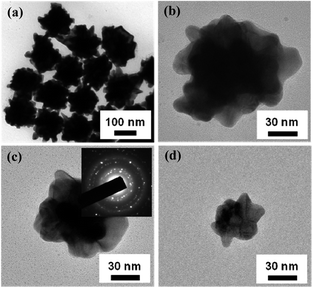
Gold seeds with a diameter of 5 nm are synthesized by chemical reduction in aqueous solution cooled by ice.34 Gold NPs with the larger diameters are fabricated by controlling the secondary growth of Au seeds.35Fig. 1 shows the typical morphology of Au NPs with an average diameter of ∼170 nm according to the statistical analysis. All the NPs with many nanoscale protrusions exhibit the shape of urchin as shown in Fig. 1(a). Most protrusions have a sharp apex, whose curvature can be as small as ∼5 nm. Selected area electron diffraction of an individual NP shows the discontinuous diffraction ring, implying that the Au NP consists of many polycrystals rather than a single crystal. These polycrystals usually result from the secondary growth on the primary Au seeds.36 Geometrical parameters including the nanoparticle size and surface roughness normally depend on the concentrations of Au seeds and surface agents in aqueous solution during the secondary growth. In this work, by adjusting the concentration of Au seeds in the growth solution, a monotonic tailoring of the nanoparticle size from 170 to 50 nm can be achieved as shown in Fig. 1(b)–(d). Interestingly, the nanoscale protrusions within each type of Au NP still remain although the Au NP is as small as 50 nm.
 | ||
| Fig. 1 TEM images of Au NPs with different surface morphologies. (a) A typical microstructure of Au NPs with a shape of urchin. (b–d) Gold NPs with various diameters. The inset in Fig. 1(c) is the selected area electron diffraction of an individual Au NP. | ||
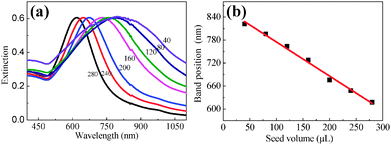
Fig. 2(a) illustrates the extinction spectra of Au NPs with various diameters, each of which exhibits an individual extinction peak, implying the uniform size distribution. This extinction peak results from the excitation of SPR. The SPR band monotonically shifts from 606 to 826 nm with the seed volume decreasing from 280 to 40 ml. The linear relationship between the position of the SPR band and the seed volume as shown in Fig. 2(b) can offer a reliable experimental procedure to tune the location of the SPR band towards the NIR window. This well-tuned feature of the SPR band provides us an opportunity to enhance the fluorescence emission of PbS QDs in the NIR region.
For PbS QDs located near metal nanostructures, their enlarged distance will make a continuous transition from fluorescence quenching to fluorescence enhancement. In this work, silica (SiO2) is deposited onto the surface of Au NPs as a spacer to isolate PbS QDs. Fig. S1 (ESI†) shows that Au NPs can be covered by the SiO2 shell, whose thickness almost remains constant independent of the local morphology and the curvature of Au NPs. The detailed characterization indicates that SiO2 is in the amorphous state as shown in Fig. S1(e) (ESI†). Therefore, the thickness of the SiO2 shell can be precisely tuned from 5 to 20 nm by using different doses of tetraethylorthosilicate (TEOS), so that fluorescence intensity of PbS QDs can be optimized by tuning the thickness of the SiO2 spacer. Most PbS QDs have an average size of ∼4.7 nm according to statistical analysis as shown in Fig. S1(h) (ESI†). In order to observe the distribution of PbS QDs on Au@SiO2 NPs for TEM observations, a drop of the aqueous hybrid is dispersed onto a carbon supported copper grid until the completion of water evaporation. The PbS QDs attached onto Au@SiO2 NPs as shown in Fig. S1(f) (ESI†) have a comparable size (it is evidenced by the lattice fringes in the inset) with free PbS QDs in Fig. S1(g) (ESI†). This indicates that the aggregation of PbS QDs to form a larger size cluster in the aqueous mixture or on the supported grid does not occur.
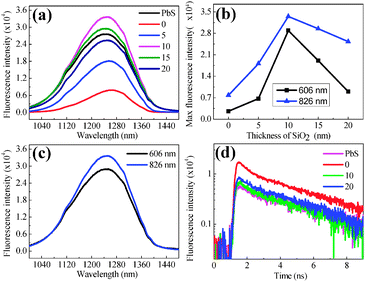
For avoiding the possible aggregation of PbS QDs and enhancing the spectrum comparability to a great extent, all the fluorescence spectra are collected in aqueous solution, so that the PbS QDs can be considered to swim around the Au@SiO2 NPs. For the hybrid consisting of PbS QDs and bare Au NPs without a SiO2 spacer, fluorescence intensity is slightly weaker than that of pure QDs, indicating that fluorescence quenching occurs. When one increases the thickness of the SiO2 shell from 0 to 10 nm, fluorescence intensity increases by a magnitude of 5–6 times as shown in Fig. 3(a). Maximum fluorescence emission can be obtained when the thickness of the SiO2 shell is 10 nm, and the subsequent decrement of fluorescence intensity is observed with further thickening (Fig. 3(b)). It must be noted that the concentrations of Au NPs or Au@SiO2 NPs and PbS QDs in each aqueous solution in Fig. 3(a) are ∼1.8 × 10¹⁰ ml−1 and ∼4 × 10¹⁴ ml−1 respectively, which can assure the reliable comparison of fluorescence intensity.
In order to clarify the intrinsic mechanism of fluorescence enhancement, fluorescence spectroscopy can be collected in the same experimental configuration except for selecting Au NPs with different SPR bands. During spectra collection, the laser with the same wavelength is utilized. Fluorescence intensity as shown in Fig. 3(c) exhibits significant reduction when the SPR band of Au NPs is changed from 826 to 606 nm, implying that fluorescence enhancement is really related to the electromagnetic fields due to SPR excitation of Au NPs (the PbS QD concentration within the aqueous solution is identical for each spectrum acquisition, ensuring that the total quantity of PbS QDs in the optical path is constant. The optical path diagram is shown in Fig. S2, ESI†).
Fluorescence emission of PbS QDs near the Au NPs mainly depends on two factors: field enhancement and an increment in the intrinsic decay rate of fluorophores. The first factor promotes excitation rates, but does not modify the fluorescence lifetime of the PbS QDs. Fluorescence intensity is usually proportional to the square of local electromagnetic fields where the QDs reside. In order to quantitatively evaluate field enhancement, finite difference time domain (FDTD) simulations conduce to calculate the extinction spectrum of an individual Au NP and estimate its field distributions in the surrounding medium.37 Field distribution near the apex of an individual Au NP exhibits 5–6 times enhancement as shown in Fig. S3 (ESI†) (the exact value depends on the curvature of the sharp apex). By considering the exponential attenuation of the electromagnetic field normal to the metal surface, field enhancement at a distance of 10 nm away from the surface of Au NPs exhibits a 2–4 times difference. In theory, two powers of field enhancements correspond to 4–16 times in fluorescence intensity, which is comparable to the experimental data. The second factor changes the quantum yield and the lifetime of the fluorophore. The fluorescence lifetime of QDs hybridized onto Au NPs is implemented using time-correlated single photon counting by plotting a histogram of time lags between the excitation pulses and the detected fluorescence photons. Experimental results in Fig. 3(d) indicate the radiation decay rate modification of the PbS QDs in close proximity to the Au NPs.
For pure PbS QDs, the single-exponential function can be utilized to fit the lifetime of PbS QDs in Fig. S4 (ESI†) (τ1 = 4.51 ns). While for the aqueous solution consisting of Au@SiO2 NPs and PbS QDs, an additional decay mechanism might exist due to the SPR excitation. Therefore, we can use a double-exponential function to fit their lifetime. Herein, τ1 is fixed as 4.51 ns, while τ2 is flexible to describe the fluorescence emission of PbS QDs affected by the near-field coupling between SPR of Au@SiO2 NPs.38 Therefore, τ2 results from the PbS QDs located in the local field of Au NPs. We observed a considerably small lifetime τ2 of 0.45 ns when PbS QDs are mixed with Au NPs without the SiO2 spacer. In this case, the fluorescence decay is faster than free PbS QDs, implying energy transfer at the interface between Au NPs and PbS QDs and local field enhancement on the surface of Au NPs. Energy transfer becomes weaker and field enhancement becomes relatively dominant when the SiO2 spacer becomes thicker towards 10 nm, so that a τ2 of 0.30 ns can be observed. The significant reduction of lifetime implies the enhanced recombination rate of PbS QDs because of their coupling with SPR of Au NPs, which is also detected in CdSe QDs.39
To prove the advantage of urchin-like Au NPs in comparison with Au NPs with smooth surfaces, fluorescence spectra are also collected from Au NPs with different surface morphologies but a comparable diameter (∼55 nm) and the same SiO2 shell (10 nm) (see Fig. S5, ESI†). They indicate that Au NPs with the rough surfaces have a larger fluorescence enhancement for PbS QDs than Au NPs with the smooth surfaces. Fluorescence intensity is comparable for each curve because both the quantity of PbS QDs within the optical path and the experimental parameter during spectrum acquisition are identical.
In our experiment, the PbS QDs can be considered to swim around the Au@SiO2 NPs, and there exists an effective fluorescence enhancement distance between the PbS QDs and the Au@SiO2 NPs under laser irradiation. Thus only PbS QDs within the local field of the Au@SiO2 NPs will make an effective contribution to the overall fluorescence enhancement, while free QDs far away from Au@SiO2 NPs have negligible contributions to signal enhancement. This might be the reason for the observation that fluorescence enhancement in this work is weaker than the experimental results reported in some previous investigations.13,14 Meanwhile, the experimental enhancement factor (∼2) of Au@SiO2 NPs is smaller than the maximum factor estimated by FDTD simulations (4–16). The optimized distance between Au@SiO2 NPs and QDs usually depends on many factors: the aqueous or solid states of their hybrids, the exact diameter of Au NPs, and the surface roughness of Au NPs. In our experiments, the aqueous solution consisting of Au@SiO2 NPs and PbS QDs is utilized to characterize the magnitude of fluorescence enhancement. In this case, most QDs might not be directly attached onto the surface of Au@SiO2 NPs, which is different from the hybrid consisting of the Au@SiO2 NPs and dye molecules that are linked by some functionalized molecules. In the latter case, the exact distance between NPs and QDs should be smaller than that in the aqueous solution. Therefore, the optimized thickness of the SiO2 shell is a little smaller than the NP/dye distances where largest fluorescence enhancement is observed.13
In principle, fluorescence enhancement mainly results from both excitation and emission enhancement by Au NPs. In our investigation, Au NPs exhibit a sharp apex, therefore the near-field enhancement can result from a combination of the lightning rod effect and plasmonic resonance.1,2 At first, larger field enhancement near the sharper apex can be observed in the FDTD simulation (see Fig. S3, ESI†). Secondly, on resonance of SPR will induce larger field enhancement than off resonance, which can be confirmed by collecting the fluorescence of PbS QDs hybridized onto Au@SiO2 NPs with different SPR bands. The fluorescence intensity from 170 nm Au NPs is larger than that from 50 nm Au NPs, and this phenomenon results from larger NPs holding a SPR band much closer to the wavelength of the exciting laser (826 nm) and the emission wavelength (1225 nm) as well (see Fig. S6, ESI†). Thus, high enhancement that we observe here is most likely a combination of excitation and emission enhancements in the optimal shell thickness. The other factor affecting fluorescence emission is the changing decay rate of the fluorophore, which can be reflected in its lifetime.2,18 In the hybrid consisting of Au NPs and PbS QDs, the lifetime τ2 is significantly reduced in comparison with the τ1 of pure PbS QDs. This is well related to the field enhancement due to SPR excitation and fluorescence quenching due to the energy transfer at Au/PbS interfaces. While for the hybrid consisting of Au–SiO2 NPs with 10 nm thick shells and PbS QDs, fluorescence quenching will become weaker because energy transfer at Au/PbS interfaces is partially suppressed, and field enhancement resulting from SPR excitation will make more contribution to the effective path of radiative decay in comparison to non-radiative decay due to fluorescence quenching. In general, our present data imply that PEF observed in PbS QDs is primarily affected by the field enhancement on the surfaces of Au@SiO2 NPs.
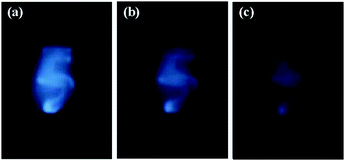
The results described above indicate that the fluorescence emission of PbS QDs can be enhanced when the thickness of the SiO2 spacer is optimized. This property offers us an opportunity to image the QD/Au@SiO2 NP hybrid by collecting the scattered fluorescence remotely. Fig. 4 shows the optical images of the QD/Au@SiO2 NP hybrid with a character of “5” (SiO2 shell is 10 nm in thickness) taken from different distances in a range of 35–70 cm. This character can be clearly seen when the hybrid label is 35 cm away from the CCD. The remote imaging of PbS QDs in the NIR region might bring some applications including biological imaging and the real-time tracking of drug delivery. Especially human skin is transparent in the NIR region, which will benefit the medical diagnosis, thermotherapy and in vivo imaging of tumors.
 | ||
| Fig. 4 The NIR imaging of a character of “5” written by a Au@SiO2-PbS QD hybrid. The images are taken from different distances of 35, 50, and 70 cm. | ||
In summary, fluorescence imaging in the NIR window has found widespread applications in biological science including clinical diagnosis and real-time tracking of internal medicine. Gold NPs with nanoscale protrusions/or surface roughness are fabricated by controlling the kinetics of the secondary growth of Au seeds. A surface plasmon band tuned from 606 to 826 nm shows the linear dependence on the amount of Au seeds during chemical synthesis, with a subsequent monotonic shift towards the NIR region by enlarging the NP diameter from 50 to 170 nm. Gold NPs with the plasmon band at 826 nm can enhance the fluorescence emission of PbS QDs excited by the NIR laser, so that remote imaging of QDs can be achieved by acquisition of the scattered fluorescence at a wavelength of 1225 nm.
This work was partially supported by Innovation Funding of HUST for International Collaborations (2014ZZGH018), Specialized Research Fund for the Doctoral Program of Higher Education (20130142120089), and National Science Foundation of China (51371084). We also appreciate Professor Jianfeng Li in Xiamen University for providing us Au@SiO2 NPs with smooth surface morphologies for PEF comparison.
Notes and references
- W. Wang, Z. P. Li, B. H. Gu, Z. Y. Zhang and H. X. Xu, ACS Nano, 2009, 3, 3493 CrossRef CAS PubMed.
- A. Hartschuh, Angew. Chem., Int. Ed., 2008, 47, 8178 CrossRef CAS PubMed.
- F. Tam, G. P. Goodrich, B. R. Johnson and N. J. Halas, Nano Lett., 2007, 7, 496 CrossRef CAS PubMed.
- X. Y. Lang, P. F. Guan, L. Zhang, T. Fujita and M. W. Chen, Appl. Phys. Lett., 2010, 96, 073701 CrossRef PubMed.
- S. H. Guo, D. G. Britti, J. J. Heetderks, H. C. Kan and R. J. Phaneuf, Nano Lett., 2009, 9, 2666 CrossRef PubMed.
- M. Moskovits, Rev. Mod. Phys., 1985, 57, 783 CrossRef CAS.
- D. A. Weitz, S. Garoff, J. I. Gersten and A. Nitzan, J. Chem. Phys., 1983, 78, 5324 CrossRef CAS PubMed.
- C. D. Geddes, H. Cao, I. Gryczynski, Z. Gryczynski, J. Y. Fang and J. R. Lakowicz, J. Phys. Chem. A, 2003, 107, 3443 CrossRef CAS.
- Y. F. Kong, J. Chen, F. Gao, R. Brydson, B. Johnson, G. Heath, Y. Zhang, L. Wu and D. J. Zhou, Nanoscale, 2013, 5, 1009 RSC.
- Z. Li, Q. Sun, Y. Zhu, B. Tan, Z. P. Xu and S. X. Dou, J. Mater. Chem. B, 2014, 2, 2793 RSC.
- H. Y. Chen, S. L. Li, B. W. Li, X. Y. Ren, S. N. Li, D. M. Mahounga, S. S. Cui, Y. Q. Gu and S. Achilefu, Nanoscale, 2012, 4, 6050 RSC.
- Y. Fu, J. Zhang, K. Nowaczyk and J. R. Lakowicz, Chem. Commun., 2013, 49, 10874 RSC.
- P. Reineck, D. Gomez, S. H. Ng, M. Karg, T. Bell, P. Mulvaney and U. Bach, ACS Nano, 2013, 7, 6636 CrossRef CAS PubMed.
- L. Zhang, Y. K. Song, T. Fujita, Y. Zhang, M. W. Chen and T. H. Wang, Adv. Mater., 2014, 26, 1289 CrossRef CAS PubMed.
- O. Kulakovich, N. Strekal, A. Yaroshevich, S. Maskevich, S. Gaponenko, I. Nabiev, U. Woggon and M. Artemyev, Nano Lett., 2002, 2, 1449 CrossRef CAS.
- K. Ray, R. Badugu and J. R. Lakowicz, J. Am. Chem. Soc., 2006, 128, 8998 CrossRef CAS PubMed.
- E. Hwang, I. I. Smolyaninov and C. C. Davis, Nano Lett., 2010, 10, 813 CrossRef CAS PubMed.
- C. H. Wang, C. W. Chen, Y. T. Chen, C. M. Wei, Y. F. Chen, C. W. Lai, M. L. Ho, P. T. Chou and M. Hofmann, Appl. Phys. Lett., 2010, 96, 071906 CrossRef PubMed.
- K. Tawa, H. Hori, K. Kintaka, K. Kiyosue, Y. Tatsu and J. Nishii, Opt. Express, 2008, 16, 9781 CrossRef CAS.
- H. F. Yuan, S. Khatua, P. Zijlstra, M. Yorulmaz and M. Orrit, Angew. Chem., Int. Ed., 2013, 52, 1217 CrossRef CAS PubMed.
- M. Fu, L. H. Qian, H. Long, K. Wang, P. X. Lu, Y. P. Rakovich, F. Hetsch, A. S. Susha and A. L. Rogach, Nanoscale, 2014, 6, 9192 RSC.
- X. Y. Lang, L. H. Qian, P. F. Guan, J. Zi and M. W. Chen, Appl. Phys. Lett., 2011, 98, 093701 CrossRef PubMed.
- A. E. Ragab, A. S. Gadallah, T. Da Ros, M. B. Mohamed and I. M. Azzouz, Opt. Commun., 2014, 314, 86 CrossRef CAS PubMed.
- Y. H. Chan, J. X. Chen, S. E. Wark, S. L. Skiles, D. H. Son and J. D. Battea, ACS Nano, 2009, 3, 1735 CrossRef CAS PubMed.
- K. Munechika, Y. Chen, A. F. Tillack, A. P. Kulkarni, I. J. L. Plante, A. M. Munro and D. S. Ginger, Nano Lett., 2010, 10, 2598 CrossRef CAS PubMed.
- N. A. Harun, M. J. Benning, B. R. Horrocks and D. A. Fulton, Nanoscale, 2013, 5, 3817 RSC.
- A. Benami, A. Lopez-Suarez, L. Rodriguez-Fernandez, A. Crespo-Sosa, J. C. Cheang-Wong, J. A. Reyes-Esqueda and A. Oliver, AIP Adv., 2012, 2, 012193 CrossRef PubMed.
- N. Gandra, C. Portz, L. M. Tian, R. Tang, B. G. Xu, S. Achilefu and S. Singamaneni, Angew. Chem., Int. Ed., 2014, 53, 866 CrossRef CAS PubMed.
- M. Toma, U. Jonas, A. Mateescu, W. Knoll and J. Dostalek, J. Phys. Chem. C, 2013, 117, 11705 CAS.
- C. Y. Zhang, H. C. Yeh, M. T. Kuroki and T. H. Wang, Nat. Mater., 2005, 4, 826 CrossRef CAS.
- J. Cao, T. Sun and K. T. V. Grattan, Sens. Actuators, B, 2014, 195, 332 CrossRef CAS PubMed.
- X. Wu, X. X. He, K. M. Wang, C. Xie, B. Zhou and Z. H. Qing, Nanoscale, 2010, 2, 2244 RSC.
- E. C. Cho, Y. Zhang, X. Cai, C. M. Moran, L. H. V. Wang and Y. N. Xia, Angew. Chem., Int. Ed., 2013, 52, 1152 CrossRef CAS PubMed.
- F. R. Fan, D. Y. Liu, F. Y. Wu, S. Duan, Z. X. Xie, Z. Y. Jiang and Z. Q. Tian, J. Am. Chem. Soc., 2008, 130, 6949 CrossRef CAS PubMed.
- J. X. Fang, S. Y. Du, S. Lebedkin, Z. Y. Li, R. Kruk, M. Kappes and H. Hahn, Nano Lett., 2010, 10, 5006 CrossRef CAS PubMed.
- X. H. Liu, R. Huang and J. Zhu, Chem. Mater., 2008, 20, 192 CrossRef CAS.
- L. H. Qian, B. Das, Y. Li and Z. L. Yang, J. Mater. Chem., 2010, 20, 6891 RSC.
- A. F. van Driel, I. S. Nikolaev, P. Vergeer, P. Lodahl, D. Vanmaekelbergh and W. L. Vos, Phys. Rev. B: Condens. Matter Mater. Phys., 2007, 75, 035329 CrossRef.
- T. J. Lin, W. J. Chuang, S. Cheng and Y. F. Chen, Appl. Phys. Lett., 2009, 94, 173506 CrossRef PubMed.
Footnote |
| † Electronic supplementary information (ESI) available: Experimental procedures and supporting figures. See DOI: 10.1039/c4cc07783k |
| This journal is © The Royal Society of Chemistry 2015 |


