Effect of preparation methods on the activity of VOx/CeO2 catalysts for the selective catalytic reduction of NOx with NH3†
Zhihua
Lian
,
Fudong
Liu
and
Hong
He
*
State Key Joint Laboratory of Environment Simulation and Pollution Control, Research Center for Eco-Environmental Sciences, Chinese Academy of Sciences, 18 Shuangqing Road, Haidian District, Beijing 100085, China. E-mail: honghe@rcees.ac.cn; Fax: +86 10 62849123; Tel: +86 10 62849123
First published on 27th August 2014
Abstract
The effect of preparation methods on the activity of VOx/CeO2 catalysts for the selective catalytic reduction of NOx with NH3 was fully studied. VOx/CeO2 prepared by a simple homogeneous precipitation method showed higher NH3-SCR activity and higher SO2 and H2O resistance than catalysts prepared by other methods. Lower CeO2 crystallinity on the surface, better dispersion of vanadium species, and higher surface concentration of vanadium species together with more acid sites were all responsible for the higher SCR activity of VOx/CeO2 prepared by the homogeneous precipitation method. The NH3-SCR reaction over VOx/CeO2 catalysts mainly followed the Eley–Rideal mechanism, in which gaseous NO reacted with adsorbed NH3 species to finally form N2 and H2O.
1. Introduction
Nitrogen oxides (NO and NO2), one of the major sources of air pollution, result from automobile exhaust gas and industrial combustion of fossil fuels.1 They contribute to a variety of environmentally harmful effects such as photochemical smog, acid rain, and haze formation.2 The selective catalytic reduction of NOx with NH3 (NH3-SCR) in the presence of excess oxygen has proved to be the most efficient technology for the removal of nitrogen oxides from stationary and mobile sources.2,3 Many catalysts have been investigated, and V2O5–WO3(MoO3)/TiO2 has been widely applied as an industrial catalyst for many years due to its high catalytic activity and SO2 resistance.4,5 However, some problems remain for the use of V2O5–WO3(MoO3)/TiO2, such as the narrow operation temperature window of 300–400 °C, low N2 selectivity and high conversion of SO2 to SO3 at high temperatures.4,6,7 In addition, the high concentration of ash containing K2O, CaO, As2O3, etc. in the flue gas reduces the performance and longevity of V2O5–WO3(MoO3)/TiO2 catalyst in this temperature range.8,9 Therefore, a lot of studies have been performed to develop new NH3-SCR catalyst systems or to improve vanadium-based catalysts, especially at low temperatures.10–15Vanadium-based catalysts with high loading amounts usually exhibit high NH3-SCR activity and SO2 resistance at low temperatures.16,17 For example, V2O5/AC catalysts were found to exhibit high catalytic activity in the NO–NH3–O2 reaction at low temperatures.18–20 Therefore, we chose to investigate and optimize vanadium-based catalysts for practical applications. On the other hand, cerium-based catalysts have also been studied extensively due to their high oxygen storage capacity and excellent redox properties, showing high NH3-SCR activity in the medium or high temperature ranges. In our previous study, Ce/TiO2 catalysts have exhibited highly effective NH3-SCR activity.21,22 Furthermore, V2O5/CeO2 catalysts have also been attracting much attention for their performance in various catalytic reactions. Gu et al.23 have used V2O5/CeO2 catalysts for the selective oxidation of toluene and found that the loading of V2O5 and the calcination temperature influenced the surface structures of dispersed vanadium species as well as the surface acidity and redox properties, which have significant effects on the catalytic activity. In the NH3-SCR reaction, a previous study by Li et al.24 showed that V2O5/CeO2 catalysts exhibited high NH3-SCR activity at low temperature, and the NO conversion increased significantly with increasing V2O5 loading. It was reported that the V0.75Ce oxide catalyst exhibited higher NH3-SCR activity than the conventional V2O5–WO3/TiO2 catalyst below 350 °C.25 Although V/Ce oxide catalysts have shown great catalytic activity, their properties are not well understood and should be investigated in more detail. It is also necessary to decrease the vanadium content due to its toxicity.
In many cases, the activity of catalysts is highly dependent on the preparation method. Therefore, in this study we systematically investigated VOx/CeO2 catalysts in depth, especially the effects of preparation methods on the catalyst structure and activity in NH3-SCR of NOx. Even with low loading content of vanadia, the catalysts could still exhibit excellent catalytic performance for the DeNOx process. In addition, the VOx/CeO2 catalyst prepared by a simple homogeneous precipitation method (VOx/CeO2(P)) showed higher NH3-SCR activity and better SO2 resistance than catalysts prepared by other methods, mainly due to lower CeO2 crystallinity on the surface, better dispersion of vanadium species, and higher surface concentration of vanadium species together with more acid sites.
2. Experiments
2.1 Catalyst synthesis and activity tests
The 3 wt.% VOx/CeO2 catalysts were prepared by four methods: the homogeneous precipitation method, rotary evaporation impregnation, incipient wetness impregnation and the sol–gel method. All of the materials were purchased from Sinopharm Chemical Reagent Co., Ltd (China) and were analytically pure, except the CeO2 supports which were prepared by the homogeneous precipitation method, as described below.Before NH3-SCR activity testing, the catalysts were pressed, crushed and sieved to 40–60 mesh. The SCR activity tests were performed in a fixed-bed quartz flow reactor at atmospheric pressure. The reaction conditions were controlled as follows: 500 ppm NO, 500 ppm NH3, 5 vol.% O2, 5 vol.% H2O (when used), 100 ppm SO2 (when used), N2 balance. Under ambient conditions, the total flow rate was 500 ml min−1 and the gas hourly space velocity (GHSV) was 50![[thin space (1/6-em)]](https://www.rsc.org/images/entities/char_2009.gif) 000 h−1. The effluent gas including NO, NH3, NO2 and N2O was continuously analyzed with an FTIR spectrometer (Nicolet Nexus 670) equipped with a heated, low-volume multiple-path gas cell (2 m). FTIR spectra were collected after the SCR reaction reached a steady state, and the NOx conversion and N2 selectivity were calculated as follows:
000 h−1. The effluent gas including NO, NH3, NO2 and N2O was continuously analyzed with an FTIR spectrometer (Nicolet Nexus 670) equipped with a heated, low-volume multiple-path gas cell (2 m). FTIR spectra were collected after the SCR reaction reached a steady state, and the NOx conversion and N2 selectivity were calculated as follows:
2.2 Characterization of catalysts
The surface area and pore characterization of the catalysts were obtained from N2 adsorption/desorption analysis at −196 °C using a Quantachrome Quadrasorb SI-MP. Prior to N2 physisorption, the catalysts were degassed at 300 °C for 5 h. Surface areas were determined by the BET equation in the 0.05–0.35 partial pressure range. Pore volumes and average pore diameters were determined by the Barrett–Joyner–Halenda (BJH) method from the desorption branches of the isotherms.Powder X-ray diffraction measurements of the catalysts were performed using a computerized PANalytical X'Pert Pro diffractometer with Cu Kα (λ = 0.15406 nm) radiation. The data of 2θ from 10 to 80° were collected at 8° min−1 with a step size of 0.07°.
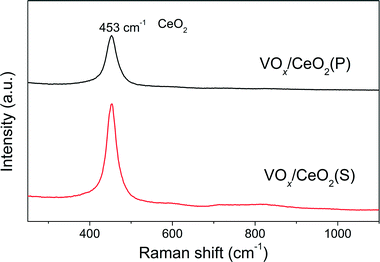
Visible Raman spectra of the VOx/CeO2 catalysts were collected at room temperature using a Spex 1877 D Triplemate spectrometer with a spectral resolution of 2 cm−1. A 532 nm diode-pump solid semiconductor (DPSS ) laser was used as the excitation source and the power output was about 40 mW. Before measurements, the catalysts were ground well and mounted on a spinning holder to avoid thermal damage during scanning. Raman signals were collected with conventional 90° geometry and the time for recording each spectrum was 1000 ms. The Raman spectra used in this paper were original and unsmoothed.
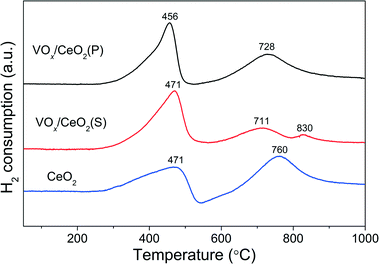
The H2-TPR experiments were performed with a Micromeritics AutoChem 2920 chemisorption analyzer. The samples (50 mg) were pretreated at 300 °C under a flow of 20 vol.% O2/Ar (50 ml min−1) for 0.5 h in a quartz reactor and cooled down to room temperature (30 °C) followed by Ar purging for 0.5 h. A 50 ml min−1 gas flow of 10% H2 in Ar was then passed over the samples through a cold trap to the detector. The reduction temperature was raised at 10 °C min−1 from 30 to 1000 °C.
X-ray photoelectron spectroscopy (XPS) spectra of the catalysts were recorded with a scanning X-ray microprobe (AXIS Ultra, Kratos Analytical Ltd.) using Al Kα radiation (1486.7 eV). All of the binding energies were calibrated using the C 1s peak (BE = 284.8 eV) as the standard.
2.3 NH3-TPD studies
NH3-TPD experiments were performed using a quadrupole mass spectrometer (HPR-20, Hiden Analytical Ltd.) to record the signal of NH3 (m/z = 15 for NH). Prior to TPD experiments, the samples (100 mg) were pretreated at 400 °C under a flow of 20 vol.% O2/Ar (50 ml min−1) for 0.5 h and cooled down to room temperature (30 °C). The samples were then exposed to a flow of 2500 ppm NH3/Ar (50 ml min−1) at 30 °C for 1 h, followed by Ar purging for another 1 h. Finally, the temperature was raised to 600 °C under Ar flow at a rate of 10 °C min−1.2.4 In situ DRIFTS studies
In situ DRIFTS experiments were performed using an FTIR spectrometer (Nicolet Nexus 670) equipped with a smart collector and an MCT/A detector cooled by liquid nitrogen. The reaction temperature was controlled precisely by an Omega programmable temperature controller. Prior to each experiment, the sample was pretreated at 400 °C for 0.5 h under a flow of 20 vol.% O2/N2 and then cooled to 200 °C. The background spectra were collected under flowing N2 and automatically subtracted from the sample spectrum. The reaction conditions were controlled as follows: 300 ml min−1 total flow rate, 500 ppm NH3 or/and 500 ppm NO + 5 vol.% O2, and N2 balance. All spectra were recorded by accumulating 100 scans with a resolution of 4 cm−1.3. Results
3.1 Catalytic performance
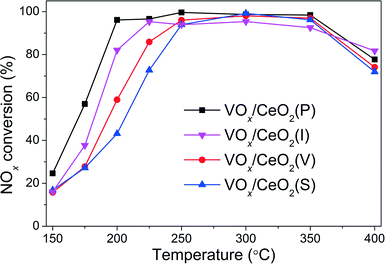
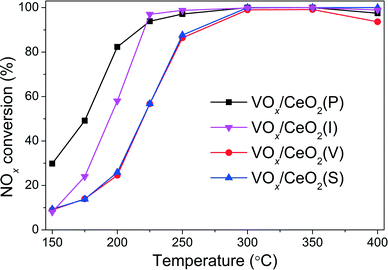
The NOx conversion over VOx/CeO2 catalysts prepared by different methods is shown in Fig. 1. It is obvious that the preparation methods affected the catalytic activity, especially in the relatively low temperature range. VOx/CeO2 prepared by the simple homogeneous precipitation method exhibited the best catalytic activity, with nearly 100% NOx conversion and 100% N2 selectivity at temperatures above 200 °C. VOx/CeO2 catalysts prepared by rotary evaporation impregnation and incipient wetness impregnation method showed lower NOx conversion than that prepared by the homogeneous precipitation method, and the catalyst prepared by the sol–gel method showed the lowest catalytic activity. All of the catalysts presented higher than 90% N2 selectivity and only a small amount of N2O was produced at the temperature that we investigated (as shown in Fig. S2†). The preparation methods could affect the structural properties, redox ability and surface acidity of the catalysts, resulting in different catalytic activities, which will be discussed later in this paper.
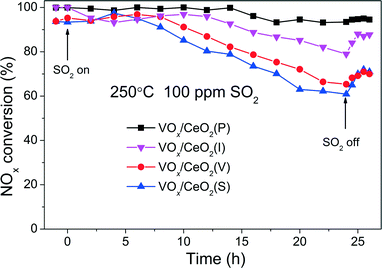
Fig. 3 shows the effect of SO2 on the catalytic activity over VOx/CeO2 catalysts at 250 °C. When 100 ppm SO2 was introduced to the gas inlet, the NOx conversion over VOx/CeO2(S) decreased rapidly to as low as 60% in 24 h and could not recover to the initial activity after the removal of SO2. The NOx conversion over VOx/CeO2(V) and VOx/CeO2(I) catalysts also decreased, and after the introduction of SO2, the catalytic activity recovered to some extent. However, the SO2 poisoning behaviour over VOx/CeO2(P) was quite different. The NOx conversion decreased slowly, and 93% NOx conversion was obtained in the presence of 100 ppm SO2 for a 24 h test. VOx/CeO2(P) exhibited the highest catalytic activity and the strongest resistance to SO2. The NH3-SCR performance of VOx/CeO2 catalysts after SO2 poisoning for 24 h is shown in Fig. S3.† The activity over VOx/CeO2(P) was still higher than those over the other catalysts. 100% NOx conversion could be obtained over the VOx/CeO2(P) catalyst at 250 °C and 70% over VOx/CeO2(S). This proved again that the VOx/CeO2(P) catalyst showed the strongest SO2 resistance.
3.2 Catalyst characterization
Table 1 also shows the surface atomic concentrations of VOx/CeO2 catalysts derived from XPS results. VOx/CeO2(P) and VOx/CeO2(S) catalysts exhibited similar surface Ce and O concentrations. The surface V concentration of the VOx/CeO2(P) catalyst was 2.4%, which is much higher than that of VOx/CeO2(S) (1.6%). The V/Ce atomic ratio was 0.072 and 0.047 for VOx/CeO2(P) and VOx/CeO2(S), respectively. The higher surface concentration of vanadium species could result in better SCR activity.
3.3 NH3-TPD
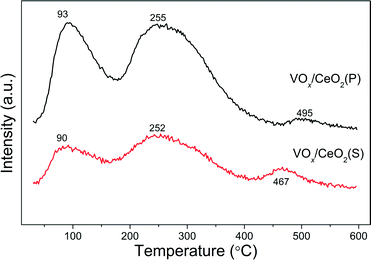
Fig. 7 shows NH3-TPD results over VOx/CeO2 catalysts using the fragment of m/z = 15 (NH) to identify NH3. There were three NH3 desorption peaks around 90, 250 and 470 °C on both catalysts. The desorption peaks at 90 °C were ascribed to the desorption of physisorbed NH3. The broad desorption peaks between 150 °C and 400 °C were assigned to weak and moderate acid sites on the catalyst surface. With increasing temperature, small peaks between 400 °C and 600 °C occurred in the NH3-TPD profiles, which are related to NH3 molecules adsorbed on the strong acid sites of the catalysts.31 Although the desorption temperature of VOx/CeO2(P) was a litter higher than that of the VOx/CeO2(S) catalyst, the amount of NH3 desorption from the former was notably larger than that from the latter. This indicates that there are more acid sites on the VOx/CeO2(P) catalyst.3.4 In situ DRIFTS
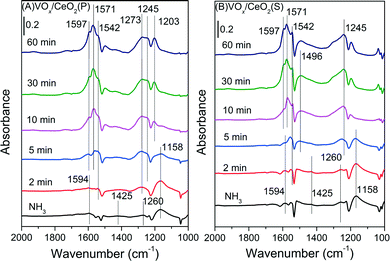 | ||
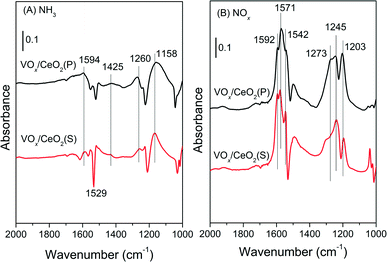
| Fig. 9 In situ DRIFT spectra of VOx/CeO2(P) (A) and VOx/CeO2(S) (B) pretreated by exposure to 500 ppm NH3 followed by exposure to 500 ppm NO + 5 vol.% O2 at 200 °C. | ||
For the VOx/CeO2(S) catalyst (Fig. 9(B)), similar bands due to NH3 adsorption were observed after NH3 pre-adsorption and N2 purging. After the introduction of NO + O2, the adsorbed NH3 species decreased in intensity and totally vanished after 10 min, followed by the appearance of nitrate species. The adsorbed NH3 species on VOx/CeO2(S) could also participate in the SCR reaction, similar to VOx/CeO2(P).
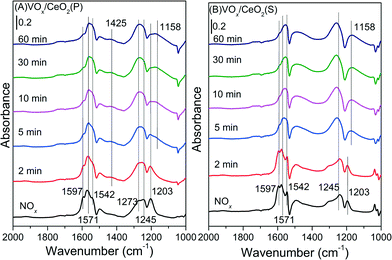 | ||
| Fig. 10 In situ DRIFT spectra of VOx/CeO2(P) (A) and VOx/CeO2(S) (B) pretreated by exposure to 500 ppm NO + 5 vol.% O2 followed by exposure to 500 ppm NH3 at 200 °C. | ||
For the VOx/CeO2(S) catalyst (Fig. 10(B)), similar bands ascribed to nitrate species were observed after NO + O2 adsorption and N2 purging. When NH3 was introduced, the intensity of bridging nitrate decreased slowly and the bands attributed to monodentate and bidentate nitrate species remained unchanged. Adsorbed NH3 species began to form on the VOx/CeO2(S) catalyst surface after 2 min upon NH3 introduction. The adsorbed nitrate could not easily take part in the NH3-SCR reaction.
4. Discussion
4.1 The effect of preparation methods on catalytic activity
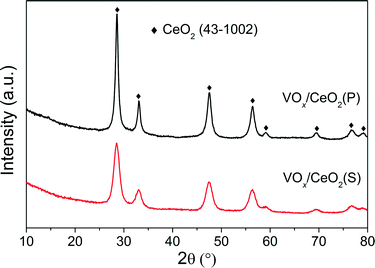
The effect of preparation methods on the catalytic activity of VOx/CeO2 catalysts was investigated in detail in this study. VOx/CeO2 prepared by the homogeneous precipitation method showed the highest SCR activity, and nearly 100% NOx conversion plus 100% N2 selectivity was obtained above 200 °C. In addition, VOx/CeO2(P) exhibited the strongest resistance to H2O and SO2 in NH3-SCR.Based on the XRD results, the crystallinity of the CeO2 phase in the VOx/CeO2(P) catalyst was higher than that in VOx/CeO2(S). However, the Raman spectra showed that the homogeneous precipitation method restrained the crystallization of CeO2 on the surface layer of the VOx/CeO2(P) catalyst. The lower surface crystallinity signifies more defects on the catalyst surface and better dispersion of vanadium species, which could enhance catalytic activity. Higher surface vanadium concentration on the VOx/CeO2(P) catalyst, as shown by XPS results, indicated more active sites and improved the NH3-SCR performance.
In addition, the surface acidity of a catalyst plays an important role in the NH3-SCR reaction. VOx/CeO2(P) and VOx/CeO2(S) showed similar specific surface areas, but the NH3 desorption amount from the former was much larger, indicating that the VOx/CeO2(P) catalyst could provide more acid sites. This could result from the higher surface concentration of vanadium species, since acid sites are more prevalent on vanadium oxide than on cerium oxide. More acid sites on the VOx/CeO2(P) catalyst could facilitate the adsorption and activation of NH3 during the catalytic reaction and thus enhance its catalytic activity in NH3-SCR.
Furthermore, according to the literature,37,38 vanadium oxide shows excellent SO2 resistance in NH3-SCR. Therefore, a higher surface concentration of vanadium species on the catalyst surface could enhance SO2 resistance. The VOx/CeO2(P) catalyst showed higher catalytic activity in the presence of 100 ppm SO2 than VOx/CeO2(S).
4.2 SCR reaction mechanism
NH3 could adsorb on VOx/CeO2(P) and VOx/CeO2(S) catalysts to form NH4+ and coordinated NH3. When NOx was introduced, NH3 adsorbed species disappeared quickly. Both NH4+ and coordinated NH3 could react with NOx. Monodentate, bridging and bidentate nitrates were deposited on the catalyst surface when NO + O2 were introduced. Adsorbed nitrate species were mostly inactive in the NH3-SCR reaction. After NH3 was introduced, the number of monodentate and bridging nitrates reduced slightly, but the amount of bidentate nitrate increased. Gaseous NO mainly interacted with adsorbed NH3 species on VOx/CeO2 catalysts to form an activated intermediate and subsequently decomposed to N2 and H2O according to the Eley–Rideal mechanism.395. Conclusions
VOx/CeO2 catalysts exhibited excellent NH3-SCR performance. VOx/CeO2 prepared by a simple homogeneous precipitation method showed higher catalytic activity and better H2O and SO2 resistance than catalysts prepared by other methods. As high as 93% NOx conversion was obtained in the presence of 100 ppm SO2 for a 24 h test over the VOx/CeO2(P) catalyst.The weaker crystallinity of CeO2 in the surface layers of VOx/CeO2(P) implied more defects on its surface and better dispersion of vanadium species than that on VOx/CeO2(S).The higher surface vanadium concentration led to more acid sites on VOx/CeO2(P), which can absorb and activate more NH3 species. All of these factors contributed to the higher SCR activity and SO2 resistance of VOx/CeO2(P). The NH3-SCR reaction over VOx/CeO2(P) and VOx/CeO2(S) catalysts mainly followed the Eley–Rideal mechanism, in which gaseous NO reacted with adsorbed NH3 species to finally form N2 and H2O.
Acknowledgements
This work was financially supported by the National Natural Science Foundation of China (51108446) and the Ministry of Science and Technology of China (2012AA062506, 2013AA065301).Notes and references
- G. S. Qi, R. T. Yang and R. Chang, Appl. Catal., B, 2004, 51, 93–106 CrossRef CAS.
- H. Bosch and F. Janssen, Catal. Today, 1988, 2, 369–379 CrossRef CAS.
- Z. G. Huang, Z. P. Zhu, Z. Y. Liu and Q. Y. Liu, J. Catal., 2003, 214, 213–219 CrossRef CAS.
- G. Busca, L. Lietti, G. Ramis and F. Berti, Appl. Catal., B, 1998, 18, 1–36 CrossRef CAS.
- G. Busca, M. A. Larrubia, L. Arrighi and G. Ramis, Catal. Today, 2005, 107–108, 139–148 CrossRef CAS.
- J. P. Dunn, P. R. Koppula, H. G. Stenger and I. E. Wachs, Appl. Catal., B, 1998, 19, 103–117 CrossRef CAS.
- P. Balle, B. Geiger and S. Kureti, Appl. Catal., B, 2009, 85, 109–119 CrossRef CAS.
- I. E. Wachs and B. M. Weckhuysen, Appl. Catal., A, 1997, 157, 67–90 CrossRef CAS.
- D. A. Bulushev, F. Rainone, L. Kiwi-Minsker and A. Renken, Langmuir, 2001, 17, 5276–5282 CrossRef CAS.
- Z. Huang, X. Gu, W. Wen, P. Hu, M. Makkee, H. Lin, F. Kapteijn and X. Tang, Angew. Chem., Int. Ed., 2012, 51, 1–6 CrossRef.
- M. Stanciulescu, G. Caravaggio, A. Dobri, J. Moir, R. Burich, J. P. Charland and P. Bulsink, Appl. Catal., B, 2012, 123–124, 229–240 CrossRef CAS.
- R. Q. Long, R. T. Yang and R. Chang, Chem. Commun., 2002, 452–453 RSC.
- A. Sultana, M. Sasaki and H. Hamada, Catal. Today, 2011, 185, 184–289 Search PubMed.
- Z. Lian, F. Liu, H. He, X. Shi, J. Mo and Z. Wu, Chem. Eng. J., 2014, 250, 390–398 CrossRef CAS.
- B. Q. Jiang, Y. Liu and Z. B. Wu, J. Hazard. Mater., 2009, 162, 1249–1254 CrossRef CAS PubMed.
- Q. Li, H. S. Yang, A. M. Nie, X. Y. Fan and X. B. Zhang, Catal. Lett., 2011, 141, 1237–1242 CrossRef CAS.
- W. Cha, S. Chin, E. Park, S.-T. Yun and J. Jurng, Appl. Catal., B, 2013, 140–141, 708–715 CrossRef CAS.
- Z. P. Zhu, Z. Y. Liu, S. J. Liu and H. X. Niu, Appl. Catal., B, 1999, 23, L229–L233 CrossRef CAS.
- Z. P. Zhu, Z. Y. Liu, S. J. Liu and H. X. Niu, Appl. Catal., B, 2001, 30, 267–276 CrossRef CAS.
- W. Zhao, Q. Zhong, Y. X. Pan and R. Zhang, Chem. Eng. J., 2013, 228, 815–823 CrossRef CAS.
- W. Xu, Y. Yu, C. Zhang and H. He, Catal. Commun., 2008, 9, 1453–1457 CrossRef CAS.
- W. Shan, F. Liu, H. He, X. Shi and C. Zhang, Catal. Today, 2012, 184, 160–165 CrossRef CAS.
- X. Gu, J. Ge, H. Zhang, A. Auroux and J. Shen, Thermochim. Acta, 2006, 451, 84–93 CrossRef CAS.
- C. Li, Q. Li, P. Lu, H. Cui and G. Zeng, Front. Environ. Sci. Eng., 2012, 6, 156–161 CrossRef.
- Y. Peng, C. Wang and J. Li, Appl. Catal., B, 2014, 144, 538–546 CrossRef CAS.
- J. Twu, C. J. Chuang, K. I. Chang, C. H. Yang and K. H. Chen, Appl. Catal., B, 1997, 12, 309–324 CrossRef CAS.
- Q. Li, X. X. Hou, H. S. Yang, Z. X. Ma, J. W. Zheng, F. Liu, X. B. Zhang and Z. Y. Yuan, J. Mol. Catal. A: Chem., 2012, 356, 121–127 CrossRef CAS.
- Y. Peng, J. Li, L. Chen, J. Chen, J. Han, H. Zhang and W. Han, Environ. Sci. Technol., 2012, 46, 2864–2869 CrossRef CAS PubMed.
- M. A. Reiche and A. Baiker, Appl. Catal., B, 1999, 23, 187–203 CrossRef CAS.
- L. Chen, J. H. Li and M. F. Ge, J. Phys. Chem. C, 2009, 113, 21177–21184 CAS.
- S. Cai, D. Zhang, L. Zhang, L. Huang, H. Li, R. Gao, L. Shi and J. Zhang, Catal. Sci. Technol., 2014, 4, 93–101 CAS.
- R. Gao, D. Zhang, X. Liu, L. Shi, P. Maitarad, H. Li, J. Zhang and W. Cao, Catal. Sci. Technol., 2013, 3, 191–199 CAS.
- L. Zhang, J. Pierce, V. Leung, D. Wang and W. S. Epling, J. Phys. Chem. C, 2013, 117, 8282–8289 CAS.
- K. I. Hadjiivanov, Catal. Rev.: Sci. Eng., 2000, 42, 71–144 CAS.
- C. Liu, L. Chen, J. Li, L. Ma, H. Arandiyan, Y. Du, J. Xu and J. Hao, Environ. Sci. Technol., 2012, 46, 6182–6189 CrossRef CAS PubMed.
- Z. Si, D. Weng, X. Wu, Z. Ma, J. Ma and R. Ran, Catal. Today, 2013, 201, 122–130 CrossRef CAS.
- P. Forzatti, Appl. Catal., A, 2001, 222, 221–236 CrossRef CAS.
- F. D. Liu, W. P. Shan, X. Y. Shi and H. Hong, Prog. Chem., 2012, 24, 445–455 CAS.
- W. S. Kijlstra, D. S. Brands, H. I. Smit, E. K. Poels and A. Bliek, J. Catal., 1997, 171, 219–230 CrossRef CAS.
Footnote |
| † Electronic supplementary information (ESI) available: NOx conversion over VOx/CeO2 with different loadings; the N2 selectivity in NH3-SCR reaction; NH3-SCR activity after SO2 poisoning; NH3/NO conversion in separate NH3 or NO oxidation reactions; and the band intensity of nitrate species calculated from DRIFTS of VOx/CeO2 catalysts. See DOI: 10.1039/c4cy00935e |
| This journal is © The Royal Society of Chemistry 2015 |


