Prussian blue/TiO2 nanocomposites as a heterogeneous photo-Fenton catalyst for degradation of organic pollutants in water†
Xuning
Li
ab,
Junhu
Wang
*a,
Alexandre I.
Rykov
a,
Virender K.
Sharma
c,
Huangzhao
Wei
a,
Changzi
Jin
a,
Xin
Liu
a,
Mingrun
Li
a,
Songhua
Yu
a,
Chenglin
Sun
a and
Dionysios D.
Dionysiou
d
aDalian Institute of Chemical Physics, Chinese Academy of Sciences, 457 Zhongshan Road, Dalian 116023, China. E-mail: wangjh@dicp.ac.cn; Fax: +86 411 84685940; Tel: +86 411 84379159
bUniversity of Chinese Academy of Sciences, Beijing 100049, China
cDepartment of Environmental and Occupational Health, School of Public Health, Texas A&M University, 1266 TAMU, College Station, Texas 77843, USA
dEnvironmental Engineering and Science Program, Department of Biomedical, Chemical and Environmental Engineering, 705 Engineering Research Center, University of Cincinnati, Cincinnati, OH 45221, USA
First published on 4th September 2014
Abstract
Nowadays, a lot of research focuses on accelerating FeII/FeIII redox cycles to increase the pseudo first-order rates of the Fenton reaction. Here, Prussian blue/titanium dioxide nanocomposites (PB/TiO2 NPs) were designed as heterogeneous photo-Fenton catalysts to increase the FeII recovery in degrading organic contaminants in water for the first time. The PB/TiO2 NPs were characterized by various analytical techniques to obtain the optimum ratio of PB and TiO2 for efficient degradation of organics. The performance of the catalysts was tested by following the removal of rhodamine B dye, salicylic acid, m-cresol, and isophorone under various conditions (pH, ratios of PB and TiO2, H2O2, and temperature). Formation of the intermediates of iron (FeII/FeIII) in the studied system using Mössbauer spectroscopy was explored for the first time and presents important insights into the relevant catalytic phenomena. The generation of ˙OH radicals in the reaction system was identified using electron paramagnetic resonance spectroscopic techniques. Results demonstrated that the developed PB/TiO2 NPs were stable and could degrade organic contaminants in water efficiently.
1. Introduction
Several industrial activities create streams of wastewater. Often, industrial effluents in several countries are not well treated but flow into lakes, rivers, and groundwater reservoirs.1 Wastewaters contain a wide range of toxic organic compounds of varying concentrations, which have long-term effects on aquatic life and human health.2 Furthermore, the use of untreated water is exacerbated by the increasing utilization of renewable freshwater sources for industrial and agricultural activities.3,4 The treatment of contaminated water presents an effective strategy to curtail effects to the environment and also to sustain the increasing demand of purified water. Among the various treatment methods, advanced oxidation processes (AOPs) are appealing since they utilize the highly reactive hydroxyl radical (˙OH) to degrade organic compounds.5,6 Iron-based species can generate ˙OH through Fenton and photo-Fenton reactions (reactions (1)–(3)).7–9| Fe2+ + H2O2 → Fe3+ + ˙OH + OH− | (1) |
| Fe3+ + H2O + UV → Fe2+ + H+ + ˙OH | (2) |
| Fe(OH)2+ + UV → Fe2+ + ˙OH | (3) |
The Fenton reaction is favorable at a pH of around 3 and needs a large amount of iron salts for complete degradation of the organic contaminants, which limits its use for treating wastewater.10 Furthermore, the presence of dissolved iron in the effluent and significant generation of ferric oxide sludge during neutralization of the acidic effluents further limit the application of Fenton reactions in treating contaminated water.
Heterogeneous processes have been proposed to overcome the drawbacks of homogeneous Fenton reactions.11–13 This paper focuses on the development of a novel heterogeneous photo-Fenton reaction system consisting of nanocomposites in combination with H2O2 and UV. The scheme given in Fig. 1 was hypothesized to utilise the advantages of titanium dioxide (TiO2) and Prussian blue (FeIII4[FeII(CN)6]3) nanocomposites (hereafter marked as PB/TiO2 NPs), which not only absorb light of wavelengths within most of the solar spectrum, but also have the capability to carry out electron-transfer processes (reaction (4)).14–17
| FeIIIFeIII(CN)6 + e− → FeIIIFeII(CN)6− | (4) |
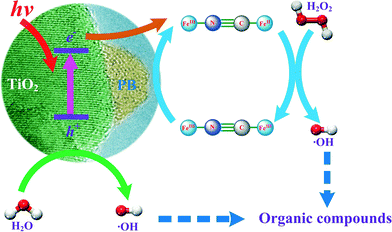 | ||
| Fig. 1 Proposed reaction scheme for the degradation of organic pollutants by the PB/TiO2–UV–H2O2 system. | ||
With the addition of H2O2, a Fenton reaction process can be performed in which regeneration of Fe(II) can be established at nearly neutral pH (Fig. 1). Furthermore, photo-Fenton reactions using UV light may also increase the efficiency of generating ˙OH by two processes: (i) PB captures the conduction band electron and therefore decreases the recombination of electron–hole pairs, and (ii) increase the reduction of FeIII to FeII in PB on the surface of TiO2, which facilitates the Fenton reaction. Understanding the efficient generation of ˙OH to degrade organic pollutants effectively was thus the main objective of this paper.
The aims of the paper are to: (i) synthesize and characterize PB/TiO2 NPs with an optimum loading of PB on the surface of TiO2 nanoparticles by using different surface analytical techniques, (ii) unveil the mechanism of the coupling and explore any synergistic effects of TiO2 photocatalysis and PB Fenton systems mainly by Mössbauer and electron paramagnetic resonance (EPR), (iii) evaluate the catalytic activity of synthesized material, based on the scheme given in Fig. 1, in the oxidation of selected organic pollutants (rhodamine B, m-cresol, isophorone, and salicylic acid) under various conditions and examine the roles of different process parameters, and (iv) determine the stability of PB/TiO2 NPs in the photo-Fenton process.
2. Experimental
2.1. Materials and chemicals
Rhodamine B (RhB) was purchased from Sigma-Aldrich. Isophorone, m-cresol, and salicylic acid were obtained from Tianjin Guangfu fine chemical research institute, China. Ferric chloride, 30% hydrogen peroxide aqueous solution, and potassium ferrocyanide were acquired from Tianjin Kermel Chemical Reagent Co., Ltd, China. Titanium dioxide (P25) was purchased from Evonik Co. (Frankfurt-Main, Germany). All chemicals were used without further purification. Doubly-distilled deionized water was used throughout this study.2.2. Preparation of PB/TiO2 NPs
PB/TiO2 NPs with different loadings of PB were synthesized by a simple chemical solution deposition method.18 Briefly, a ferrocyanide solution (0.03 M) and a TiO2 solid powder at different stoichiometric molar ratios of PB and TiO2 were dissolved in 15 mL water, followed by magnetic stirring for 30 min at ambient temperature. In the mixed colloid solution, 15 mL ferric chloride solution (0.04 M) was added slowly with continuous stirring for another 30 min. The colloid solution was aged for at least 12 hours, which resulted in precipitates. Finally, the precipitate was centrifuged and washed with deionized water three times and the resulting product was dried in an oven at 333 K for 12 hours. One 57Fe enriched PB (57FeIII4[FeII(CN)6]3)/TiO2 sample with a molar ratio of 1![[thin space (1/6-em)]](https://www.rsc.org/images/entities/char_2009.gif) :
:![[thin space (1/6-em)]](https://www.rsc.org/images/entities/char_2009.gif) 60 was prepared by the same method as that used to synthesize the other samples but instead of an FeCl3 solution, a 57FeCl3 stock solution was used for Mössbauer characterization.
60 was prepared by the same method as that used to synthesize the other samples but instead of an FeCl3 solution, a 57FeCl3 stock solution was used for Mössbauer characterization.
2.3. Characterization of PB/TiO2 NPs
The powder X-ray diffraction (XRD) patterns were recorded on a PANalytical X'Pert PRO X-ray diffractometer with Cu Kα (λ = 0.15406 nm) radiation and a 2θ range from 10° to 80°. The surface morphology and the element distribution were determined by using a Tecnai G2 Spirit transmission electron microscope (TEM) coupled with an energy-dispersive X-ray (EDX) spectrometer at an accelerating voltage of 120 kV. The images of high resolution transmission electron microscopy (HRTEM) were taken on a Tecnai G2 F30 S-Twin TEM operating at an accelerating voltage of 300 kV. The UV-vis diffuse reflection spectra were collected using a UV-vis spectrophotometer (V-550, Jasco, Japan).The room temperature 57Fe Mössbauer spectra of the selected PB/TiO2 NPs with a molar ratio of 1![[thin space (1/6-em)]](https://www.rsc.org/images/entities/char_2009.gif) :
:![[thin space (1/6-em)]](https://www.rsc.org/images/entities/char_2009.gif) 60 were recorded under various simulated conditions by using a Topologic 500A spectrometer and a proportional counter. A 57Co(Rh), moving with a constant acceleration mode, was used as the γ-ray radioactive source. The velocity was calibrated by a standard α-iron foil. Fig. S1† shows the Mössbauer measurement setup in this study. A 27 W black light lamp (FPL27BLB, Sankyo Denki, Japan) was added between the γ-ray detector and the PB/TiO2 sample holder to perform Mössbauer measurements under UV irradiation. The PB/TiO2 sample was treated with 30% H2O2 aqueous solution and/or irradiated by UV lamp for these in situ Mössbauer measurements, respectively. The spectra were fitted with the appropriate superpositions of Lorentzian lines using the MossWinn 3.0i computer program. In this way, the 57Fe Mössbauer spectral parameters could be determined, including the isomer shift (IS), the electric quadrupole splitting (QS), the full width at half maximum, and the relative resonance areas of the different components of the absorption patterns.
60 were recorded under various simulated conditions by using a Topologic 500A spectrometer and a proportional counter. A 57Co(Rh), moving with a constant acceleration mode, was used as the γ-ray radioactive source. The velocity was calibrated by a standard α-iron foil. Fig. S1† shows the Mössbauer measurement setup in this study. A 27 W black light lamp (FPL27BLB, Sankyo Denki, Japan) was added between the γ-ray detector and the PB/TiO2 sample holder to perform Mössbauer measurements under UV irradiation. The PB/TiO2 sample was treated with 30% H2O2 aqueous solution and/or irradiated by UV lamp for these in situ Mössbauer measurements, respectively. The spectra were fitted with the appropriate superpositions of Lorentzian lines using the MossWinn 3.0i computer program. In this way, the 57Fe Mössbauer spectral parameters could be determined, including the isomer shift (IS), the electric quadrupole splitting (QS), the full width at half maximum, and the relative resonance areas of the different components of the absorption patterns.
The DMPO (5,5-dimethyl-1-pyrroline-N-oxide) trapped EPR spectra of the selected PB/TiO2 NPs with a molar ratio of 1![[thin space (1/6-em)]](https://www.rsc.org/images/entities/char_2009.gif) :
:![[thin space (1/6-em)]](https://www.rsc.org/images/entities/char_2009.gif) 60 were obtained using a Brucker ESR I200 spectrometer at room temperature, which was operated at X-field with a center field at 3350 G and with a sweep width of 100 G. The microwave frequency was 9.405 GHz and the power was 2.979 mW. The sweep time of the signal channel was 81.9 s, with a 10
60 were obtained using a Brucker ESR I200 spectrometer at room temperature, which was operated at X-field with a center field at 3350 G and with a sweep width of 100 G. The microwave frequency was 9.405 GHz and the power was 2.979 mW. The sweep time of the signal channel was 81.9 s, with a 10![[thin space (1/6-em)]](https://www.rsc.org/images/entities/char_2009.gif) 000 gain at the receiver. Before the test, 5 mg of PB/TiO2 NPs were added to 5 mL diluted H2O2 aqueous solution and H2O2 ethanol solution ([H2O2] = 0.4 M), respectively. After the mixture was prepared, an aliquot of about 100 μL was taken and injected into 50 μL DMPO (Aladinn, 30 mM freshly diluted by doubly-distilled water on the day of the experiment) immediately. The obtained solution was transferred into an EPR capillary tube (inner diameter: 0.15 mm), which was then fixed in the resonant cavity of the spectrometer. The EPR signal was measured in a time-resolved manner.
000 gain at the receiver. Before the test, 5 mg of PB/TiO2 NPs were added to 5 mL diluted H2O2 aqueous solution and H2O2 ethanol solution ([H2O2] = 0.4 M), respectively. After the mixture was prepared, an aliquot of about 100 μL was taken and injected into 50 μL DMPO (Aladinn, 30 mM freshly diluted by doubly-distilled water on the day of the experiment) immediately. The obtained solution was transferred into an EPR capillary tube (inner diameter: 0.15 mm), which was then fixed in the resonant cavity of the spectrometer. The EPR signal was measured in a time-resolved manner.
2.4. Catalytic activity measurements of PB/TiO2 NPs
All of the experiments were performed in a dark box. The performance of the PB/TiO2 NPs–H2O2 system was first tested for the removal of RhB dye in doubly-distilled water. In all of the experiments, 50 mg PB/TiO2 NPs were added to a 50 mL RhB solution (initial 12 mg L−1) and then stirred in a water bath for 30 min at a certain temperature to establish the adsorption/desorption equilibrium. The temperature of the reaction solution was maintained using a temperature-controlled water bath. If necessary, the pH of the PB/TiO2 suspension RhB aqueous solution was adjusted by using either 0.1 M HNO3 or 0.1 M NaOH aqueous solution. The reaction was initiated by separately adding different amounts of H2O2 aqueous solution (simultaneously turning on the lamp for the UV or visible-light irradiation experiments). In the UV irradiation experiments, the reaction solution was irradiated using a 27 W black light lamp (FPL27BLB, Sankyo Denki, Japan), which emitted light with a wavelength of 368 nm. In the visible-light irradiation experiments, the reaction solution was irradiated using a xenon lamp (MAX-303, Asahi Spectra Co., Ltd), which had a light intensity of 13.3 mW cm−2. Fig. S2 and S3† show the emission spectra of the UV and visible light lamps, respectively. The distance between the lamp and the solution was 15.0 cm. The intensity of the UV light was adjusted to ~2.5 mW cm−2. During the reaction, 2 mL samples were periodically taken out and centrifuged at 12![[thin space (1/6-em)]](https://www.rsc.org/images/entities/char_2009.gif) 000 rpm before measuring the UV-vis absorption spectra of solutions. The concentration and mineralization of RhB were investigated using a UV-vis absorption spectrophotometer (Cintra, GBC, Australia) and a total organic carbon analyzer (TOC-VCPH/CPN, Shimadzu, Japan), respectively. There was no considerable RhB adsorption on the surface of the PB/TiO2 NPs. In addition, removal of RhB was not detected in the presence of UV irradiation alone. For comparison, the RhB–H2O2 system was also investigated without the addition of PB/TiO2 NPs using the same procedure.
000 rpm before measuring the UV-vis absorption spectra of solutions. The concentration and mineralization of RhB were investigated using a UV-vis absorption spectrophotometer (Cintra, GBC, Australia) and a total organic carbon analyzer (TOC-VCPH/CPN, Shimadzu, Japan), respectively. There was no considerable RhB adsorption on the surface of the PB/TiO2 NPs. In addition, removal of RhB was not detected in the presence of UV irradiation alone. For comparison, the RhB–H2O2 system was also investigated without the addition of PB/TiO2 NPs using the same procedure.
The performance of the PB/TiO2 NPs–H2O2 system was further tested for the removal of three other model organic pollutants, isophorone, m-cresol, and salicylic acid, under the selected reaction conditions ([substrate] = 50 mg L−1, [H2O2] = 0.4 M, catalyst = 1.0 g L−1, T = 308 K, and a 27 W black light with an average intensity of 2.5 mW cm−2) following a similar procedure to that used in RhB degradation experiments. Isophorone is used as a solvent and chemical intermediate in plastics, pesticides, and pharmaceuticals and is thus found in wastewater. The USA Environmental Protection Agency has classified isophorone as a group C contaminant, which is a possible human carcinogen.19 The concentrations of these pollutants in the samples were determined by high performance liquid chromatography (HPLC). The column used was a C18 reverse phase Phenomenex Bondclone (300 × 3.9 mm). The instrument was a Perkin-Elmer series 200, USA. The mobile phase was a methanol–water mixture at ratios of 70![[thin space (1/6-em)]](https://www.rsc.org/images/entities/char_2009.gif) :
:![[thin space (1/6-em)]](https://www.rsc.org/images/entities/char_2009.gif) 30, 80
30, 80![[thin space (1/6-em)]](https://www.rsc.org/images/entities/char_2009.gif) :
:![[thin space (1/6-em)]](https://www.rsc.org/images/entities/char_2009.gif) 20, and 20
20, and 20![[thin space (1/6-em)]](https://www.rsc.org/images/entities/char_2009.gif) :
:![[thin space (1/6-em)]](https://www.rsc.org/images/entities/char_2009.gif) 80 (V/V) while the detection wavelength was set at 243 nm, 272 nm, and 300 nm for isophorone, m-cresol, and salicylic acid, respectively. The flow rate of the mobile phase was 1.0 mL min−1.
80 (V/V) while the detection wavelength was set at 243 nm, 272 nm, and 300 nm for isophorone, m-cresol, and salicylic acid, respectively. The flow rate of the mobile phase was 1.0 mL min−1.
3. Results and discussion
3.1. Characterization of PB/TiO2 NPs
Initially, PB/TiO2 NPs were characterized by XRD analysis as shown in Fig. 2. The observed peaks of (101), (110), (004), (105), and (204) in Fig. 2 correspond to the characteristic peaks of anatase and rutile contained in Evonik P25 while the peaks of (200) and (400) are assigned to PB.20 The intensity of the (200) peak of PB became stronger with the increase in the molar ratios of PB to TiO2. The XRD results verified the successful synthesis of PB/TiO2 NPs. The PB/TiO2 NPs were synthesized in a mild acidic solution and therefore the surface of the TiO2 nanoparticles was positively charged (zipc ≈ 7.0),21 which could interact with negatively charged cyanoferrate anions ([Fe(CN)6]4−) to produce PB/TiO2 NPs.22 It seems that the reaction of Fe3+ with [Fe(CN)6]4− grafted on the TiO2 surface led to the formation of PB nanoparticles on the surface of TiO2. After separation of the blue precipitates by centrifugation, the solution was very clear, indicating that PB and TiO2 formed compressed composites in the investigated molar ratios of PB and TiO2 from 1![[thin space (1/6-em)]](https://www.rsc.org/images/entities/char_2009.gif) :
:![[thin space (1/6-em)]](https://www.rsc.org/images/entities/char_2009.gif) 15 to 1
15 to 1![[thin space (1/6-em)]](https://www.rsc.org/images/entities/char_2009.gif) :
:![[thin space (1/6-em)]](https://www.rsc.org/images/entities/char_2009.gif) 200.
200.
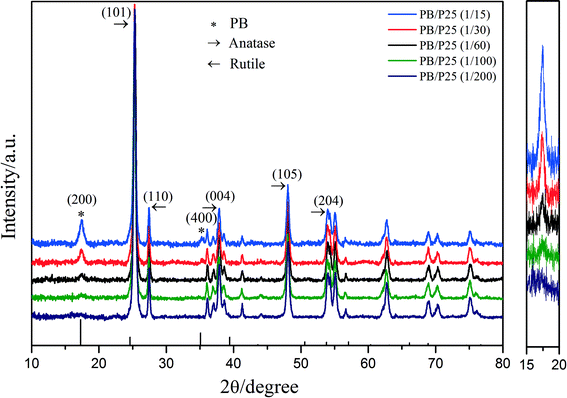 | ||
| Fig. 2 Left: X-ray diffraction patterns of PB/TiO2 NPs with different molar ratios; right: enlargement of the intensity change of PB's characteristic peak (200). | ||
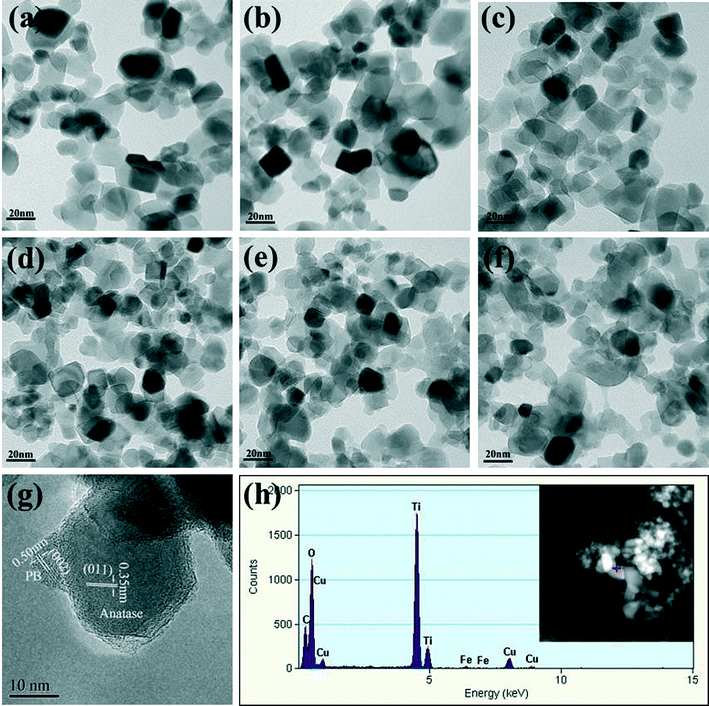
The morphology, element distribution, and structure of the PB/TiO2 NPs were characterized by TEM-EDX and HRTEM techniques and the results are presented in Fig. 3a–g. It can be clearly seen that the increasing mole ratios of PB increased the content of PB nanoparticles over the surface of TiO2. Fig. 3g shows the HRTEM image of PB/TiO2 NPs with a molar ratio of 1![[thin space (1/6-em)]](https://www.rsc.org/images/entities/char_2009.gif) :
:![[thin space (1/6-em)]](https://www.rsc.org/images/entities/char_2009.gif) 60. The observed lattice fringes of the smaller crystallite correspond to the {002} planes of PB (∼0.51 nm).17 The lattice fringes of the larger particle could be assigned to the {011} planes of anatase in Evonik P25 (∼0.35 nm).23 The HRTEM results demonstrated that well crystallized PB nanoparticles were uniformly dispersed on the surface of TiO2 nanoparticles and without the formation of thin film, similar to the findings of a previous study.24 The elemental distribution obtained from the EDX spectrum of PB/TiO2 NPs with a molar ratio of 1
60. The observed lattice fringes of the smaller crystallite correspond to the {002} planes of PB (∼0.51 nm).17 The lattice fringes of the larger particle could be assigned to the {011} planes of anatase in Evonik P25 (∼0.35 nm).23 The HRTEM results demonstrated that well crystallized PB nanoparticles were uniformly dispersed on the surface of TiO2 nanoparticles and without the formation of thin film, similar to the findings of a previous study.24 The elemental distribution obtained from the EDX spectrum of PB/TiO2 NPs with a molar ratio of 1![[thin space (1/6-em)]](https://www.rsc.org/images/entities/char_2009.gif) :
:![[thin space (1/6-em)]](https://www.rsc.org/images/entities/char_2009.gif) 60 as shown in Fig. 3h also supported the coexistence of PB and TiO2 in the PB/TiO2 NPs.
60 as shown in Fig. 3h also supported the coexistence of PB and TiO2 in the PB/TiO2 NPs.
Furthermore, the UV-vis diffuse reflectance spectra of PB/TiO2 NPs with different molar ratios were measured as shown in Fig. 4. Pure P25 TiO2 had only a strong absorption at a light wavelength (λ) of < 400 nm. New absorption bands of the PB nanoparticles appeared between 400 and 800 nm after the formation of the P25-PB composites indicating that the PB/TiO2 NPs can absorb not only UV light but also visible light and thus they are potential candidate materials for the degradation of organic pollutants using photo-Fenton processes driven by solar light.
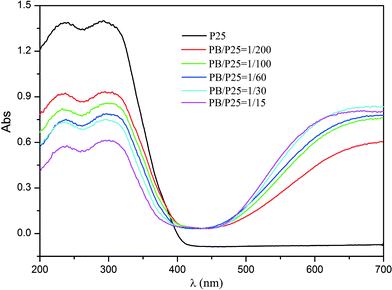 | ||
| Fig. 4 UV-vis diffuse reflectance spectra of pure TiO2 (P25) and PB/TiO2 NPs with different molar ratios. | ||
3.2. Reaction mechanism and reactive intermediates
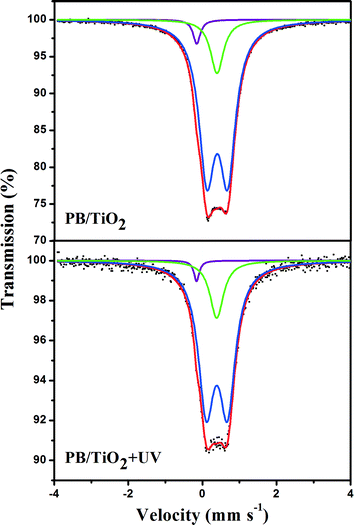
Initially, attempts were made to examine if any change in the valence of iron via electron-transfer occurred in the studied heterogeneous system. 57Fe Mössbauer spectroscopy is an ideal method for determining the oxidation state and spin-state of iron ions in a solid. The parameters of the Mössbauer spectroscopy, isomer shift (IS) and quadrupole splitting (QS) are listed in Tables 1 and 2. IS is sensitive to the iron valence state while QS varies with the coordination environment. Fig. 5 shows the Mössbauer spectra of the 57Fe enriched PB(57FeIII4[FeII(CN)6]3)/TiO2 NPs sample with and without UV irradiation. The 57Fe enrichment into the high-spin site FeIII allowed us to confirm that the UV irradiation had no effect on the values of the hyperfine parameters of this site. This suggests that high-spin FeIII in PB/TiO2 NPs could not be reduced to high-spin FeII by photo-induced electrons of TiO2. It could be that the electron-transfer in PB/TiO2 in the photo-Fenton process only occurred on the low-spin FeII.| System | Component | IS (mm s−1) | QS (mm s−1) | Area (%) |
|---|---|---|---|---|
| a Experimental errors are ±0.001 mm s−1 for isomer shift (IS), ±0.005 mm s−1 for quadrupole splitting (QS) and 1% for relative area. IS is relative to α-iron foil. | ||||
| PB/TiO2 | LS FeII | −0.152 | 19 | |
| LS FeIII | −0.143 | 0.144 | 16 | |
| HS FeIII | 0.393 | 0.583 | 65 | |
| PB/TiO2 + H2O2 | LS FeII | −0.152 | 15 | |
| LS FeIII | −0.147 | 0.144 | 20 | |
| HS FeIII | 0.387 | 0.595 | 65 | |
| PB/TiO2 + H2O2 + UV | LS FeII | −0.154 | 19 | |
| LS FeIII | −0.149 | 0.144 | 15 | |
| HS FeIII | 0.383 | 0.606 | 66 | |
| System | Component | IS (mm s−1) | QS (mm s−1) | Area (%) |
|---|---|---|---|---|
| a Experimental errors are ±0.001 mm s−1 for isomer shift (IS), ±0.005 mm s−1 for quadrupole splitting (QS) and 1% for relative area. IS is relative to α-iron foil. | ||||
| PB/TiO2 | LS FeII/III | −0.152 | 35 | |
| HS FeIII | 0.384 | 0.602 | 65 | |
| PB/TiO2 + H2O2 | LS FeII/III | −0.142 | 35 | |
| HS FeIII | 0.389 | 0.565 | 65 | |
| PB/TiO2 + H2O2 + UV | LS FeII/III | −0.153 | 34 | |
| HS FeIII | 0.377 | 0.621 | 66 | |
| (57Fe) PB/TiO2 | LS FeII | 0.363 | 16 | |
| HS FeIII | 0.373 | 0.59 | 84 | |
| (57Fe) PB/TiO2 + UV | LS FeII | 0.362 | 17 | |
| HS FeIII | 0.366 | 0.598 | 83 | |
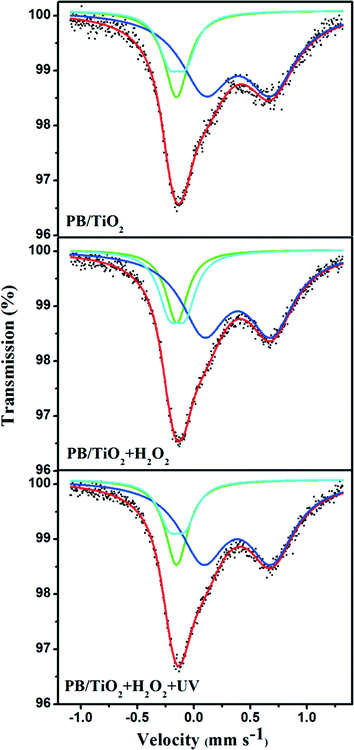
The electron-transfer in PB/TiO2 in the photo-Fenton process was investigated by carrying out a series of Mössbauer measurements focusing on the low-spin site in non-enriched samples. Low-spin FeII and FeIII are difficult to distinguish in bulk Prussian blue particles,25 but for the nanoparticles it was easier because of the large specific surface area and thus more electron-transfer reactions could happen. Considering that the electron-transfer rate (τr) related to the Fenton reaction cycle might be in two different regimes with respect to the characteristic time in Mössbauer spectroscopy (τM ≈ 10−8 s),26 the Mössbauer spectra were analyzed using two models, which are described below.
Model I: slow electron-transfer between low-spin FeII and FeIII. This model is applicable when the electron-transfer is slower than the characteristic time of Mössbauer spectroscopy. Because the low-spin FeIII has five electrons in the t2g orbital group, it should have some quadrupole splitting.27 The finite value of QS originates from the valence electron term if the electron-transfer on the surface of the nanoparticle is slower than 10−8 s. The spectra with a quadrupole doublet for low-spin FeIII and a singlet for low-spin FeII are shown in Fig. 6. From this model, we could identify the percentages of low-spin FeIII and FeII under different reaction conditions. The increase of low-spin FeIII was observed when the reaction with H2O2 was conducted, however, after irradiation by UV lamp, the percentage of low-spin FeIII changed back to its original value as listed in Table 1. This supports the reduction of low-spin FeIII by the photo-induced electrons of TiO2, proposed in the scheme given in Fig. 1.
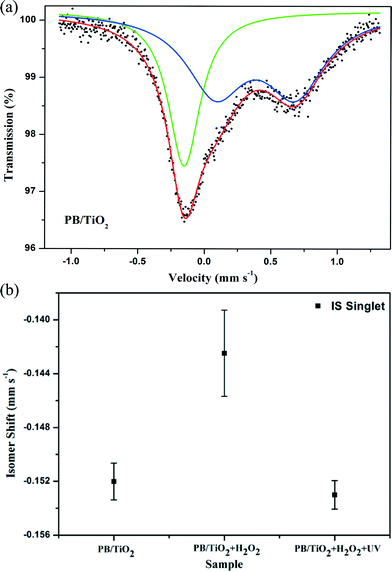
Model II: fast electron-transfer between low-spin FeII and FeIII. This model is applicable when the electron-transfer is faster than the characteristic time of Mössbauer spectroscopy. The spectra using the model of an average valence was analyzed. In this model, as the electron-transfer was very fast, we describe the state of low-spin iron (average between FeII and FeIII) by a singlet subspectrum as shown in Fig. 7. Since the crystallographic environments of the low-spin FeII and FeIII were very similar, the time averaging of the electron density would result in some intermediate value of the isomer shift.23 The isomer shift of the low-spin mixed-valent state FeII/FeIII changed from −0.152 mm s−1 to −0.142 mm s−1 when we conducted the in situ reaction with H2O2 (Table 2). This may be due to a shift of the electron density towards a more oxidized state (FeIII).28 After irradiation by UV lamp, the IS changed to its original value of −0.153 mm s−1. This indicates a shift of the average valence state towards a more reduced state (FeII) owing to the participation of the photo-induced electrons of TiO2, which also supports the reduction of low-spin FeIII by the photo-induced electrons of TiO2 (see the scheme in Fig. 1).
Formation of ˙OH in the suggested scheme given in Fig. 1 was explored by EPR techniques (Fig. 8). In the PB/TiO2–H2O2 aqueous system, the EPR signal for DMPO–˙OH adducts with a spacing of 15 G in the magnetic field appeared. The g factor of the signal was 2.0062 and the intensity ratio was 1![[thin space (1/6-em)]](https://www.rsc.org/images/entities/char_2009.gif) :
:![[thin space (1/6-em)]](https://www.rsc.org/images/entities/char_2009.gif) 2
2![[thin space (1/6-em)]](https://www.rsc.org/images/entities/char_2009.gif) :
:![[thin space (1/6-em)]](https://www.rsc.org/images/entities/char_2009.gif) 2
2![[thin space (1/6-em)]](https://www.rsc.org/images/entities/char_2009.gif) :
:![[thin space (1/6-em)]](https://www.rsc.org/images/entities/char_2009.gif) 1.29 As ˙OOH radicals are unstable in aqueous solution, the PB/TiO2–H2O2–ethanol system was further used to confirm their formation as shown in Fig. 8.30 There were no six-fold characteristic peak signals of ˙OOH radicals. The g factor of 2.0060 is characteristic of ˙OH. The slight change of the intensity may be because of the solvent effect. These results confirmed that ˙OH radicals were the main reactive intermediates.
1.29 As ˙OOH radicals are unstable in aqueous solution, the PB/TiO2–H2O2–ethanol system was further used to confirm their formation as shown in Fig. 8.30 There were no six-fold characteristic peak signals of ˙OOH radicals. The g factor of 2.0060 is characteristic of ˙OH. The slight change of the intensity may be because of the solvent effect. These results confirmed that ˙OH radicals were the main reactive intermediates.
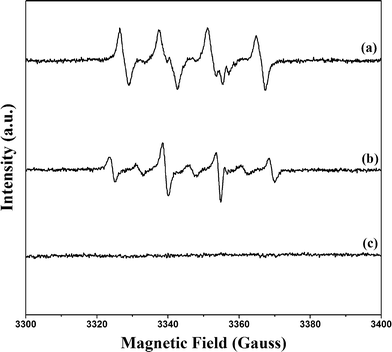 | ||
Fig. 8 DMPO trapped EPR spectra of three simulated systems. (a) PB/TiO2(1![[thin space (1/6-em)]](https://www.rsc.org/images/entities/char_2009.gif) : :![[thin space (1/6-em)]](https://www.rsc.org/images/entities/char_2009.gif) 60)–H2O2–ethanol system; (b) PB/TiO2(1 60)–H2O2–ethanol system; (b) PB/TiO2(1![[thin space (1/6-em)]](https://www.rsc.org/images/entities/char_2009.gif) : :![[thin space (1/6-em)]](https://www.rsc.org/images/entities/char_2009.gif) 60)–H2O2 aqueous system; (c) H2O2 aqueous system. 60)–H2O2 aqueous system; (c) H2O2 aqueous system. | ||
3.3. Catalytic activity of PB/TiO2 NPs
A series of experiments were carried out to demonstrate the catalytic activity of PB/TiO2 NPs with a molar ratio of 1![[thin space (1/6-em)]](https://www.rsc.org/images/entities/char_2009.gif) :
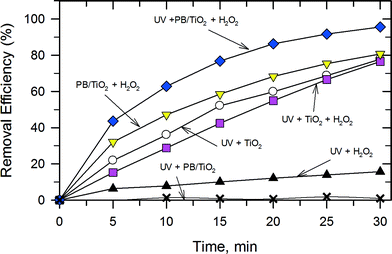
:![[thin space (1/6-em)]](https://www.rsc.org/images/entities/char_2009.gif) 60 under different conditions as shown in Fig. 9. The removal efficiency of RhB by the UV–TiO2 system was 77.8% in 30 min. A similar efficiency was found in the UV–TiO2–H2O2 system and a very low efficiency was found in the UV–H2O2 system. The PB/TiO2 NPs exhibited no significant activity under illumination with UV irradiation. This could be attributed to the partial coverage of TiO2 by PB. In such composites, PB served as a conductor which could facilitate recombination of holes with the photogenerated electrons on the TiO2 surface.15 Interestingly, with the addition of H2O2 in the reaction solution of the UV–PB/TiO2 system, the removal efficiency was clearly enhanced to 95.6% and the corresponding TOC removal efficiency of RhB was 38.5% in 30 min (Fig. S4†). This agrees with the increase in efficiency of the generation of ˙OH, based on the proposed scheme given in Fig. 1. Table 3 shows the rate constants (k) of the photo-Fenton reaction for RhB degradation over PB/TiO2 NPs under different conditions. The values of k were (5.34 ± 0.2) × 10−2 min−1 and (5.20 ± 0.5) × 10−3 min−1 for PB/TiO2–H2O2 and UV–H2O2, respectively. The sum of the values of k for these two processes is (5.86 ± 0.6) × 10−2 min−1, which is smaller than the rate constants for the UV–PB/TiO2–H2O2 system (k = (10.2 ± 0.2) × 10−2 min−1). These results demonstrate that a synergistic effect exists between photocatalysis and Fenton reactions; furthermore, the Fenton effect gives the dominant contribution for the high removal efficiency of RhB.
60 under different conditions as shown in Fig. 9. The removal efficiency of RhB by the UV–TiO2 system was 77.8% in 30 min. A similar efficiency was found in the UV–TiO2–H2O2 system and a very low efficiency was found in the UV–H2O2 system. The PB/TiO2 NPs exhibited no significant activity under illumination with UV irradiation. This could be attributed to the partial coverage of TiO2 by PB. In such composites, PB served as a conductor which could facilitate recombination of holes with the photogenerated electrons on the TiO2 surface.15 Interestingly, with the addition of H2O2 in the reaction solution of the UV–PB/TiO2 system, the removal efficiency was clearly enhanced to 95.6% and the corresponding TOC removal efficiency of RhB was 38.5% in 30 min (Fig. S4†). This agrees with the increase in efficiency of the generation of ˙OH, based on the proposed scheme given in Fig. 1. Table 3 shows the rate constants (k) of the photo-Fenton reaction for RhB degradation over PB/TiO2 NPs under different conditions. The values of k were (5.34 ± 0.2) × 10−2 min−1 and (5.20 ± 0.5) × 10−3 min−1 for PB/TiO2–H2O2 and UV–H2O2, respectively. The sum of the values of k for these two processes is (5.86 ± 0.6) × 10−2 min−1, which is smaller than the rate constants for the UV–PB/TiO2–H2O2 system (k = (10.2 ± 0.2) × 10−2 min−1). These results demonstrate that a synergistic effect exists between photocatalysis and Fenton reactions; furthermore, the Fenton effect gives the dominant contribution for the high removal efficiency of RhB.
| System | k, min−1 | r 2 |
|---|---|---|
UV + PB/TiO2(1![[thin space (1/6-em)]](https://www.rsc.org/images/entities/char_2009.gif) : :![[thin space (1/6-em)]](https://www.rsc.org/images/entities/char_2009.gif) 60) + H2O2 60) + H2O2 |
(10.2 ± 0.2) × 10−2 | 0.997 |
| UV + TiO2 + H2O2 | (4.76 ± 0.30) × 10−2 | 0.980 |
| UV + TiO2 | (4.87 ± 0.16) × 10−2 | 0.995 |
PB/TiO2(1![[thin space (1/6-em)]](https://www.rsc.org/images/entities/char_2009.gif) : :![[thin space (1/6-em)]](https://www.rsc.org/images/entities/char_2009.gif) 60) + H2O2 60) + H2O2 |
(5.34 ± 0.16) × 10−2 | 0.995 |
| UV + H2O2 | (5.20 ± 0.50) × 10−3 | 0.953 |
UV + PB/TiO2(1![[thin space (1/6-em)]](https://www.rsc.org/images/entities/char_2009.gif) : :![[thin space (1/6-em)]](https://www.rsc.org/images/entities/char_2009.gif) 60) 60) |
(4.00 ± 2.00) × 10−4 | 0.439 |
3.4. Synergistic effect of PB/TiO2 NPs as a heterogeneous photo-Fenton catalyst
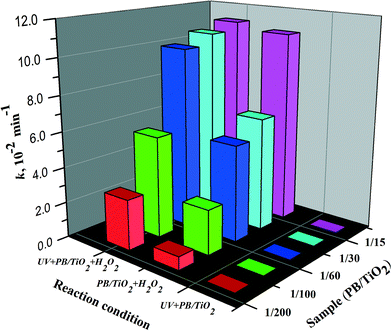
In order to evaluate the synergistic effects between photocatalysis and Fenton reactions, PB/TiO2 NPs with different loadings of PB were synthesized and a series of RhB degradation experiments were carried out for comparison. Fig. S5 and S6† show the results on the effect of PB content on the catalytic activity of PB/TiO2 NPs with or without UV irradiation, respectively. The degradation of RhB followed pseudo first-order kinetics.31Fig. 10 shows the first-order rate constants of PB/TiO2 NPs with different molar ratios in different reaction systems. There was no activity of PB/TiO2 NPs with different molar ratios under UV irradiation without H2O2. The reason should be the same as that mentioned above for the PB/TiO2 NPs with a molar ratio of 1![[thin space (1/6-em)]](https://www.rsc.org/images/entities/char_2009.gif) :
:![[thin space (1/6-em)]](https://www.rsc.org/images/entities/char_2009.gif) 60. This supports the synergism between TiO2 photocatalysis and the photo-Fenton process. With the assistance of UV and H2O2, the photo-induced electrons of TiO2 could reduce the FeIII in PB oxidized by H2O2, thus increasing the reaction rate.
60. This supports the synergism between TiO2 photocatalysis and the photo-Fenton process. With the assistance of UV and H2O2, the photo-induced electrons of TiO2 could reduce the FeIII in PB oxidized by H2O2, thus increasing the reaction rate.
The Fenton activity of PB/TiO2–H2O2 increased linearly with the increase of PB loading on the surface of TiO2. This is because PB (FeIII4[FeII(CN)6]3) contains FeII and the activity increases with the increase of iron. However, when the mole ratio of PB/TiO2 was 1![[thin space (1/6-em)]](https://www.rsc.org/images/entities/char_2009.gif) :
:![[thin space (1/6-em)]](https://www.rsc.org/images/entities/char_2009.gif) 15, UV light seemed to have no more contribution to the photo-Fenton reaction. This may be explained by considering that a high surface coverage of TiO2 by PB NPs could inhibit penetration of UV light to the surface of TiO2. In subsequent experiments, the mole ratio of PB/TiO2 = 1
15, UV light seemed to have no more contribution to the photo-Fenton reaction. This may be explained by considering that a high surface coverage of TiO2 by PB NPs could inhibit penetration of UV light to the surface of TiO2. In subsequent experiments, the mole ratio of PB/TiO2 = 1![[thin space (1/6-em)]](https://www.rsc.org/images/entities/char_2009.gif) :
:![[thin space (1/6-em)]](https://www.rsc.org/images/entities/char_2009.gif) 60 was chosen because it yielded the maximum synergism in the photo-Fenton process.
60 was chosen because it yielded the maximum synergism in the photo-Fenton process.
The steps of oxidation of organic pollutants in water by the photo-Fenton process are described by reactions (5)–(9). Without the UV irradiation, the reaction between PB and H2O2 generates ˙OH and the FeIII containing species in PB (reaction (5)). However, FeIII is further reduced by H2O2 to FeII (reaction (6)). This latter step regenerates PB for further utilization in the Fenton reaction. In the presence of UV radiation in the PB/TiO2–H2O2 system, reactions (7)–(9) also occur, leading to enhanced degradation. UV irradiation of the surface of TiO2 induces electron and hole pairs (reaction (7)). The hole oxidizes the water molecule to produce ˙OH. Therefore ˙OH is produced from two reactions ((5) and (8)) in the photo-Fenton system which results in the increased removal efficiency of RhB compared to that obtained in the dark Fenton process. Moreover, the electron induced in reaction (7) can reduce the FeIII species in [FeIII–(NC)6–FeIII] to regenerate PB (reaction (9)). Hence, regeneration of PB is possible from two reactions, (6) and (9), which facilitate the Fenton reaction in the studied system. Reactions (5)–(9) support the postulated mechanism in the scheme given in Fig. 1.
| [FeIII–(NC)6–FeII] + H2O2 → [FeIII–(NC)6–FeIII] + ˙OH + OH− | (5) |
| [FeIII–(NC)6–FeIII] + H2O2 → [FeIII–(NC)6–FeII] + H2O + 1/2O2 | (6) |
| TiO2 + hv → e− + h+ | (7) |
| h+ + H2O → ˙OH + H+ | (8) |
| [FeIII–(NC)6–FeIII] + e− → [FeIII–(NC)6–FeII] | (9) |
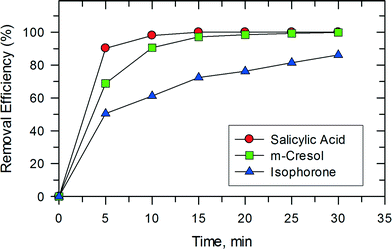
This synergy between photocatalysis and Fenton reactions was also observed in studies on the removal of isophorone, m-cresol, and salicylic acid as shown in Fig. 11. Only 15 min were needed to completely oxidize m-cresol and salicylic acid. The removal of these compounds in the photocatalytic system using TiO2 has been reported previously.32,33 In the studied system, both salicylic acid and m-cresol degraded faster than isophorone. The trend seen in Fig. 11 may be related to the reactivity of the organic compounds with ˙OH. The reported pseudo second-order rate constants for the reactions of salicylate ion and m-cresol with ˙OH are (1.2–2.4) × 1010 M−1 s−1 (pH 7.0).34 However, the rate constant for the reaction of cyclohexene, which contains a double bond like the isophorone molecule, with ˙OH is 8.8 × 10⁹ M−1 s−1 (pH 7.0).
The RhB degradation efficiency of PB/TiO2 under visible light irradiation was also investigated (Fig. S7†). The results clearly suggest that visible light may also be suitable for degrading RhB using a PB/TiO2 photocatalyst.
3.5. Factors influencing the degradation of RhB by UV–PB/TiO2–H2O2
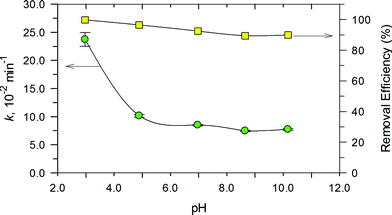
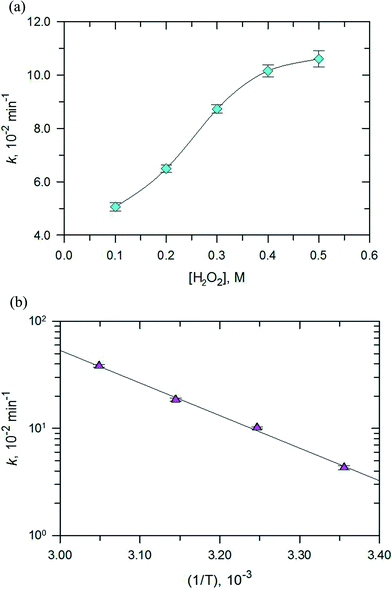
The effect of pH on the degradation of RhB in the range of 3.0 to 11.0 was examined and the results are presented in Fig. 12. Degradation of RhB could be achieved over the entire pH range. This indicates that the PB/TiO2 NPs could improve the pH effectiveness of the Fenton reaction. There was a decrease of only ~10% in the removal efficiency as the pH changed from 3.0 to 10.0. However, the values of k decreased significantly as the solution pH increased to 11.0. Importantly, the removal efficiency was reasonably maintainable even when the reaction rate constant decreased from ~23.0 × 10⁻² s−1 to ~7.0 × 10⁻² s−1. This is important as the Fenton process is efficient at the acidic pH of 3.0–4.0, but the developed photo-Fenton system was effective even under the neutral pH conditions of the water and wastewater. Furthermore, no pH adjustment would be needed in treating water of varying pH conditions.Next, the effect of H2O2 concentration on the degradation of RhB was investigated and the results are depicted in Fig. 13a. The pseudo first-order rate constants of the photo-Fenton process increased with the increase in the concentration of H2O2 (0–0.5 M). However, the increase in values of k was initially linear with the increase in concentration of H2O2 and when the concentration was more than 0.4 M, an increase in the rate constant did not follow linearity. The optimum H2O2 concentration for the photo-Fenton process could be explained by the self-scavenging effect of hydroxyl radicals by hydrogen peroxide.35 The self-decomposition of the hydroxyl radical with itself (˙OH + ˙OH → H2O2) may also contribute to the photo-Fenton process.
Finally, the effect of the reaction temperature on the degradation of RhB was investigated by varying the temperature from 298–328 K as shown in Fig. 13b. An increase in temperature achieved complete removal of RhB. The plot of ln![[thin space (1/6-em)]](https://www.rsc.org/images/entities/char_2009.gif) k vs. (1/T) gave an activation energy of 58.95 kJ mol−1 for the studied photo-Fenton process. This value is higher than the activation energy usually obtained for the photocatalytic processes (≈10 kJ mol−1). This result suggests that the Fenton reactions contribute most to the activation energy,36,37 however, the contribution from the photocatalytic reaction is minor, which is consistent with the results of the catalytic activity measurements.
k vs. (1/T) gave an activation energy of 58.95 kJ mol−1 for the studied photo-Fenton process. This value is higher than the activation energy usually obtained for the photocatalytic processes (≈10 kJ mol−1). This result suggests that the Fenton reactions contribute most to the activation energy,36,37 however, the contribution from the photocatalytic reaction is minor, which is consistent with the results of the catalytic activity measurements.
3.6. Stability of PB/TiO2 NPs
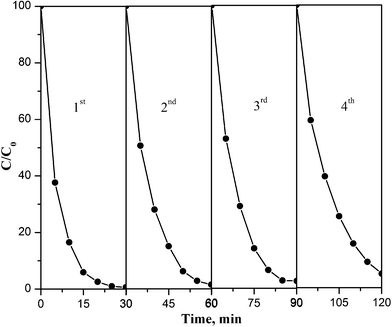
The operational stability of PB/TiO2 NPs was explored by testing the degradation of RhB in consecutive runs as shown in Fig. 14. The result demonstrated that the regenerated catalyst under the photo-Fenton process exhibited good performance even after a four-cycle run. The slight decrease in the catalytic activity may be because of the adsorption of contaminants on reactive sites of the catalyst and agglomeration during the centrifugation process.38 Overall, the results of Fig. 14 show that PB/TiO2 NPs were stable and had good catalytic performance for reuse.4. Conclusions
PB/TiO2 NPs with different loadings of PB were successfully synthesized. The high photo-Fenton activity for decomposing selected organic pollutants by PB/TiO2 NPs was investigated for the first time. A series of experiments with different reaction conditions confirmed that weaker acidic conditions were favorable for the photo-Fenton process. The Mössbauer spectra provided evidence that the excited electrons of TiO2 by UV irradiation could accelerate the cycle of low spin FeIII to FeII in PB, leading to the higher activity. EPR spectroscopy demonstrated that the active species ˙OH is the main reactive intermediate. The removal efficiency of RhB was still as high as 95% even after four-cycle runs. Considering the stability and a wide working pH range (2–11), the PB/TiO2 NPs were confirmed to have great potential for application in the degradation of various organic pollutants.Acknowledgements
This work was supported by the Chinese Academy of Sciences for “100 Talents” Project and the National Natural Science Foundation of China (11079036). This work was also partly supported by the Chinese Academy of Sciences Visiting Professorships for Senior International Scientists, grant no. 2011T1G15. X. N. Li also thanks Professor Hongxian Han of Dalian Institute of Chemical Physics, Chinese Academy of Sciences for his kind guidance with the EPR sample preparation. Many thanks to the anonymous reviewers who have helped improve this paper. V. K. Sharma acknowledges the support of United States National Science Foundation (CBET 1439314).References
- R. Ordonez, D. Hermosilla, N. Merayo, A. Gasco, C. Negro and A. Blanco, Sep. Purif. Rev., 2014, 43, 263 CrossRef CAS.
- R. P. Schwarzenbach, T. Egli, T. B. Hofstetter, U. von Gunten and B. Wehrli, Annu. Rev. Environ. Res., 2010, 35, 109 CrossRef.
- C. J. Vörösmarty, P. B. McIntyre, M. O. Gessner, D. Dudgeon, A. Prusevich, P. Green, S. Glidden, S. E. Bunn, C. A. Sullivan, C. R. Liermann and P. M. Davies, Nature, 2010, 467, 555 CrossRef PubMed.
- J. G. Hering, T. D. Waite, R. G. Luthy, J. E. Drewes and D. L. Sedlak, Environ. Sci. Technol., 2013, 47, 10721 CrossRef CAS PubMed.
- J. J. Pignatello, E. Oliveros and A. MacKay, Crit. Rev. Environ. Sci. Technol., 2006, 36, 1 CrossRef CAS.
- K. E. O'Shea and D. D. Dionysiou, J. Phys. Chem. Lett., 2012, 3, 2112 CrossRef.
- S. Enami, Y. Sakamoto and A. J. Colussi, Proc. Natl. Acad. Sci. U. S. A., 2014, 111, 623 CrossRef CAS PubMed.
- J. J. Pignatello, D. Liu and P. Huston, Environ. Sci. Technol., 1999, 33, 1832 CrossRef CAS.
- N. Klamerth, S. Malato, A. Agüera, A. Fernández-Alba and G. Mailhot, Environ. Sci. Technol., 2012, 46, 2885 CrossRef CAS PubMed.
- M. Su, C. He, V. K. Sharma, M. Abou Asi, D. Xia, X. Li, H. Deng and Y. Xiong, J. Hazard. Mater., 2012, 211, 95 CrossRef PubMed.
- A. Dhakshinamoorthy, S. Navalon, M. Alvaro and H. Garcia, ChemSusChem, 2012, 5, 46 CrossRef CAS PubMed.
- Y. Zhong, X. Liang, Z. He, W. Tan, J. Zhu, P. Yuan, R. Zhu and H. He, Appl. Catal., B, 2014, 150, 612 CrossRef PubMed.
- J. A. Bañuelos, F. J. Rodríguez, J. Manríquez Rocha, E. Bustos, A. Rodríguez, J. C. Cruz, L. G. Arriaga and L. A. Godínez, Environ. Sci. Technol., 2013, 47, 7927 CrossRef PubMed.
- T. Yamamoto, N. Saso, Y. Umemura and Y. Einaga, J. Am. Chem. Soc., 2009, 131, 13196 CrossRef CAS PubMed.
- S. Liu, S. Cheng, L. Feng, X. Wang and Z. Chen, J. Hazard. Mater., 2010, 182, 665 CrossRef CAS PubMed.
- S.-Q. Liu, S. Cheng, L. Luo, H.-Y. Cheng, S.-J. Wang and S. Lou, Environ. Chem. Lett., 2011, 9, 31 CrossRef CAS.
- S.-Q. Liu, S. Cheng, L.-R. Feng, X.-M. Wang and Z.-G. Chen, J. Hazard. Mater., 2010, 182, 665 CrossRef CAS PubMed.
- K. Szacilowski, W. Macyk and G. Stochel, J. Mater. Chem., 2006, 16, 4603 RSC.
- H. Wei, X. Yan, X. Li, S. He and C. Sun, J. Hazard. Mater., 2013, 244, 478 CrossRef PubMed.
- X. Shen, S. Wu, Y. Liu, K. Wang, Z. Xu and W. Liu, J. Colloid Interface Sci., 2009, 329, 188 CrossRef CAS PubMed.
- D. Gumy, C. Morais, P. Bowen, C. Pulgarin, S. Giraldo, R. Hajdu and J. Kiwi, Appl. Catal., B, 2006, 63, 76 CrossRef CAS PubMed.
- K. Szacilowski and W. Macyk, C. R. Chim., 2006, 9, 315 CrossRef CAS PubMed.
- X. Zhou, T. Shi, J. Wu and H. Zhou, Appl. Surf. Sci., 2013, 287, 359 CrossRef CAS PubMed.
- H. Tada, S. Tsuji and S. Ito, J. Colloid Interface Sci., 2001, 239, 196 CrossRef CAS PubMed.
- L. Samain, F. Grandjean, G. J. Long, P. Martinetto, P. Bordet and D. Strivay, J. Phys. Chem. C, 2013, 117, 9693 CAS.
- C. A. Gorski and M. M. Scherer, Am. Mineral., 2010, 95, 1017 CrossRef CAS.
- P. Gütlich, R. Link and A. Trautwein, Mössbauer spectroscopy and transition metal chemistry, Springer, Berlin, 2011, pp. 89–102 Search PubMed.
- L. Samain, B. Gilbert, F. Grandjean, G. J. Long and D. Strivay, J. Anal. At. Spectrom., 2013, 28, 524 RSC.
- W. Ma, J. Li, X. Tao, J. He, Y. Xu, J. C. Yu and J. Zhao, Angew. Chem., Int. Ed., 2003, 42, 1029 CrossRef CAS PubMed.
- C. C. Chen, X. Z. Li, W. H. Ma, J. C. Zhao, H. Hidaka and N. Serpone, J. Phys. Chem. B, 2002, 106, 318 CrossRef CAS.
- M.-W. Chang, T.-S. Chen and J.-M. Chern, Ind. Eng. Chem. Res., 2008, 47, 8533 CrossRef CAS.
- H. Labiadh, T. B. Chaabane, L. Balan, N. Becheik, S. Corbel, G. Medjahdi and R. Schneider, Appl. Catal., B, 2014, 144, 29 CrossRef CAS PubMed.
- R. Poblete, E. Otal, L. F. Vilches, J. Vale and C. Fernández-Pereira, Appl. Catal., B, 2011, 102, 172 CrossRef CAS PubMed.
- National Institute of Science and Technology NDRL/NIST Solution Kinetics Database on the web. http://kinetics.nist.gov/solution/.
- X. Xue, K. Hanna and N. Deng, J. Hazard. Mater., 2009, 166, 407 CrossRef CAS PubMed.
- M. Karatas, Y. A. Argun and M. E. Argun, J. Ind. Eng. Chem., 2012, 18, 1058 CrossRef CAS PubMed.
- S. Su, W. Guo, Y. Leng, C. Yi and Z. Ma, J. Hazard. Mater., 2013, 244, 736 CrossRef PubMed.
- Y. Li and F. S. Zhang, Chem. Eng. J., 2010, 158, 148 CrossRef CAS PubMed.
Footnote |
| † Electronic supplementary information (ESI) available. See DOI: 10.1039/c4cy00947a |
| This journal is © The Royal Society of Chemistry 2015 |

