Dehydrogenation of propane over PtSnAl/SBA-15 catalysts: Al addition effect and coke formation analysis†
Xiaoqiang
Fan
,
Jianmei
Li‡
,
Zhen
Zhao
*,
Yuechang
Wei
,
Jian
Liu
*,
Aijun
Duan
and
Guiyuan
Jiang
State Key Laboratory of Heavy Oil Processing, China University of Petroleum, 18#, Fuxue Road, Chang Ping, Beijing 102249, China. E-mail: zhenzhao@cup.edu.cn; liujian@cup.edu.cn; Fax: (+86) 10 89731586(O)
First published on 22nd August 2014
Abstract
A series of PtSnAl/SBA-15 catalysts were prepared by incipient-wetness impregnation and their catalytic performance was tested for propane dehydrogenation. The catalysts were characterized by XRF, XRD, BET, TEM, UV-vis DRS, NH3-TPD, O2-TPO, 27Al MAS-NMR, XPS and in situ Raman analyses. The addition of aluminum enhances the interaction of the Sn support and consequently stabilizes the oxidation state of Sn during the propane dehydrogenation reaction. The acid centers formed by aluminum addition show close contact with metal centers (Pt), which favors the synergistic effect of the bifunctional active centers. High catalytic performance over PtSnAl0.2/SBA-15 was obtained, and one-pass propane conversion and propene selectivity are 55.9% and 98.5%, respectively. Moreover, the in situ Raman results indicated the faster coke formation rate of PtSnAl0.4/SBA-15 than that of PtSnAl0.2/SBA-15, which may be accelerated by strong acid sites by excess aluminum addition.
1. Introduction
At present, propylene is typically obtained by means of steam cracking or fluidized catalytic cracking of naphtha. Due to the uncertain oil price and the discoveries in abundance of shale gas in the USA, the catalytic dehydrogenation of propane has received much attention as an alternative way for producing propylene using the chemical equation C3H8 ⇌ C3H6 + H2ΔE = −124 kJ mol−1. This reaction is an endothermic process which requires a high temperature and low pressure. However, high temperature facilitates side reactions such as cracking and coke formation. Therefore, many efforts have been made to develop new catalysts with high catalytic properties. Cr-based catalysts have been widely used for propane dehydrogenation.1 However, these catalysts are typically hazardous. Other non-noble metal catalysts including Cu, Fe, etc. have also been investigated,2,3 but their catalytic activity is restricted. Pt-based catalysts have been widely investigated for propane dehydrogenation reaction owing to their excellent activity.4 However, these catalysts usually suffer from fast deactivation caused by coke formation and sintering of Pt. There are several strategies to improve the catalytic performance of Pt-based catalysts, including addition of a second metal as a promoter and selection of a suitable support to strengthen the metal–support interaction. The addition of Sn to Pt-based catalyst systems can significantly improve the catalytic activity for the dehydrogenation of propane.5,6 It has been proposed that the role of Sn is to modify the electronic and geometric properties of Pt.7,8 Briefly, the formation of heteroatom bonds changes the electronic environment of the Pt metal surface, leading to the modifications of its electronic structure. The geometry of the bimetallic structure is typically different from that of the parent Pt metals, e.g., the average metal–metal bond lengths change, resulting in the strain effect that is known to modify the electronic structure of the metal through changes in orbital overlap.9 Furthermore, the support effect10 also influences the catalytic performance of PtSn-based catalysts. To date, a variety of catalysts, in which PtSn catalysts were supported on variable carriers including Al2O3, SiO2, ZSM-5, SAPO-34, and beta5,11–13 have been studied in order to find the best catalyst. Mesoporous silica SBA-15 with high surface area, ordered pore structure, and uniform pore size distribution has attracted considerable attention as a catalyst support. Shiju et al. have reported that SBA-15 can host both acid and basic sites which can affect the adsorption/desorption regimes of propane/propene.14 Moreover, SBA-15's unique pore architecture makes it very attractive as host for the confinement and stabilization of Pt nanoparticles, which can better maintain their dispersion and catalytic performance even under high reaction temperature conditions.15 It is reported that the Pt–SBA-15 catalyst shows higher selectivity than the Pt–Al2O3 catalyst for propane dehydrogenation due to the lower acidity of Pt–SBA-15 compared with Pt–Al2O3.16,17 Therefore, SBA-15-supported PtSn-based catalysts may be a good candidate for the dehydrogenation of propane.Although the structure of SBA-15 makes it suitable to be used as the support, the interaction of PtSn with silica framework is weak. Bariås et al.18 found that the Sn species can be stabilized in the 2+ state on γ-Al2O3 but can be reduced to metallic Sn and in be close contact with Pt (bimetallic clusters) on SiO2. This change would result in a negative effect on the catalytic activity and cause a large loss of the intrinsic activity. In order to enhance the interaction between metal and support, Al was added to the catalytic system to form an alumina-modified SBA-15 support, which shows better catalytic performance for propane dehydrogenation.19 However, compared with SBA-15, alumina-modified SBA-15 shows higher acidity and a reduced surface area and pore volume, which results in formation of a large amount of coke and the loss of activity during propane dehydrogenation. In order to decrease the acidity while maintaining the enhanced interaction between support and metal by Al species, we used the simultaneous impregnation of Pt, Sn and Al precursors to prepare SBA-15-supported PtSnAl catalysts.
In general, as far as the catalysts for propane dehydrogenation are concerned, deactivation due to coke formation is unavoidable. Li et al.20 have proposed a mechanism for coke formation based on kinetic analysis. The reaction between the two strong adsorbed C3H6* molecules was identified as the kinetic relevant step for the coke formation on the Pt surface. A portion of the precursor migrates to the acid site and is involved in the coke formation on the support. In this work, Al was added to the catalyst, which will result in the change in acidity. In order to study the influence of Al addition on coke formation, in situ Raman spectroscopy was used to characterize the process of coke formation. It is helpful to understand the relationship between catalyst deactivation and coking.
2. Experimental
2.1 Catalyst preparation
SBA-15 support was synthesized using triblock copolymer (Pluronic P123) as a template according to the procedure reported in the literature.21 Briefly, 8 g of P123 was dissolved in 240 ml of 2M HCl and 60 ml of deionized water to form a solution; the solution was stirred for 4 h at 40 °C. Subsequently, 17 g of TEOS was gradually added to the solution and continuously stirred for 24 h. The resulting gel was placed into a Teflon autoclave and maintained at 100 °C for 24 h. The solid products were filtered, washed, and dried at 100 °C in air for 12 h, and calcined at 550 °C for 6 h. Finally, mesoporous SBA-15 was obtained.PtSnAl/SBA-15 catalysts were prepared by incipient-wetness impregnation. SnCl4·5H2O, Al(NO3)3·9H2O and H2PtCl6·6H2O precursors were dissolved in deionized water to form a solution and the solution was impregnated with SBA-15 powder. Then, the mixture was sonicated for 30 min and dried at 25 °C for 24 h. The gentle drying of the metal precursor/silica composites after the incipient-wetness impregnation step created favorable conditions to prevent the transport of metal precursors at the external surface during calcination under stagnant air.22 After being completely dried, the catalysts were calcined at 500 °C for 4 h. The nominal composition was 0.5 wt% Pt; 1 wt% Sn; and 0, 0.1, 0.2, 0.3 and 0.4 wt% Al. For the sake of brevity, the catalysts are named PtSnAl0/SBA-15, PtSnAl0.1/SBA-15, PtSnAl0.2/SBA-15, PtSnAl0.3/SBA-15, and PtSnAl0.4/SBA-15.
2.2 Catalyst characterization
The metallic contents were obtained by XRF measurements on a ZSX 100e XRF spectrometer. Nitrogen adsorption/desorption isotherms at −196 °C were recorded using a Micromeritics TriStar II 3020 porosimetry analyzer. Low-angle XRD patterns were collected in the 2θ range of 0.7° to 10° with a step size of 0.02° on a SIEMENS D5000 diffractometer. Wide-angle XRD patterns were obtained by a powder X-ray diffractometer (Shimadzu XRD 6000) using Cu Kα (λ = 0.15406 nm) radiation. TEM images were taken using a JEOL JEM 2100 electron microscope equipped with a field emission source at an acceleration voltage of 200 kV. The UV-vis DRS experiments were performed on a UV-vis spectrophotometer (Hitachi U-4100) with an integration sphere diffuse reflectance attachment. XPS patterns were recorded on a Perkin-Elmer PHI-1600 ESCA spectrometer using a Mg Kα (hv = 1253.6 eV, 1 eV = 1.603 × 10⁻¹⁹ J) X-ray source. The binding energies were calibrated using the C1s peak of contaminant carbon (BE = 284.6 eV) as an internal standard. NH3-TPD was performed in a conventional flow apparatus. O2-TPO was measured in a conventional flow apparatus. Solid-state 27Al MAS-NMR spectra were collected using a Brucker Avance III 400 MHz nuclear magnetic resonance spectrometer. Raman spectra were recorded on a Renishaw inVia Reflex Raman spectrometer with a 532 nm laser at room temperature under ambient conditions. The in situ Raman spectra of the catalyst were collected on a Renishaw inVia Reflex Raman spectrometer with a 532 nm laser. The laser power on the surface of the sample was kept at around 1 mW.2.3 Catalytic activity measurements
Propane dehydrogenation was performed in a conventional quartz tubular micro-reactor. The catalyst (mass 0.2 g) was placed into the center of the reactor. Before the reaction, the catalyst was reduced with 10% H2/Ar at 500 °C for 4 h. The reaction conditions were as follows: 590 °C for reaction temperature, atmospheric pressure, C3H8/Ar = 1![[thin space (1/6-em)]](https://www.rsc.org/images/entities/char_2009.gif) :
:![[thin space (1/6-em)]](https://www.rsc.org/images/entities/char_2009.gif) 5 (molar ratio) and the propane weight hourly space velocity (WHSV) is 2.5 h−1. The reaction products were analyzed with an online SP-2100 gas chromatograph. An aluminum column was used for the separation of CH4, C2H4, C2H6, C3H6, and C3H8. The conversion of propane and the selectivity for propene were defined as follows:
5 (molar ratio) and the propane weight hourly space velocity (WHSV) is 2.5 h−1. The reaction products were analyzed with an online SP-2100 gas chromatograph. An aluminum column was used for the separation of CH4, C2H4, C2H6, C3H6, and C3H8. The conversion of propane and the selectivity for propene were defined as follows:3. Results
3.1. Physicochemical properties of catalysts
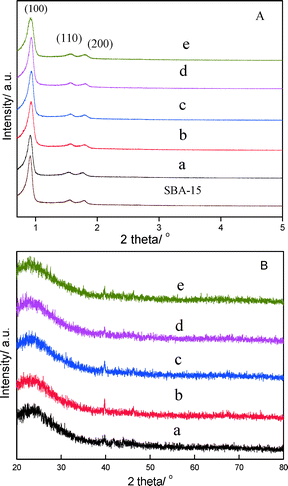
| Sample | Pta (wt%) | Sna (wt%) | Ala (wt%) | d 100 (nm) | a 0 (nm) |
|---|---|---|---|---|---|
a The metallic contents were measured by XRF.
b
d
100 is the lattice spacing obtained by low-angle XRD.
c
a
0 is the hexagonal unit cell parameter calculated using the equation  . .
|
|||||
| SBA-15 | 9.5 | 11.0 | |||
| PtSnAl0/SBA-15 | 0.43 | 0.78 | 9.5 | 11.0 | |
| PtSnAl0.1/SBA-15 | 0.45 | 0.81 | 0.10 | 9.5 | 11.0 |
| PtSnAl0.2/SBA-15 | 0.44 | 0.79 | 0.19 | 9.6 | 11.1 |
| PtSnAl0.3/SBA-15 | 0.44 | 0.78 | 0.28 | 9.6 | 11.1 |
| PtSnAl0.4/SBA-15 | 0.45 | 0.80 | 0.39 | 9.5 | 11.0 |
XRD patterns recorded in the wide-angle domain for these materials are depicted in Fig. 1B. All of the patterns show a broad maximum of 23.5° at 2θ which is the typical peak of amorphous silica.25 Besides the characteristic patterns of SBA-15, the XRD reflections of 39.8°, 46.2°, 67.4° and 81.4° at 2θ can be attributed to (111), (200), (220) and (311) interplanar spacings of the cubic Pt metal structure, respectively.26 The presence of Pt was confirmed by XRD patterns, but there are obviously no XRD diffractions from M or MOx (M = Sn, Al). The absence of these XRD diffractions for PtSnAl/SBA-15 catalysts is probably due to the high dispersion of M or the formation of amorphous MOx phases.
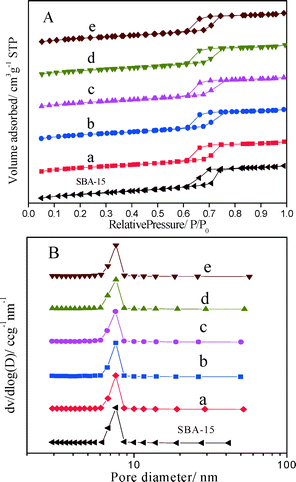
On the basis of adsorption/desorption isotherms, the textural properties of SBA-15 and PtSnAl/SBA-15 catalysts were calculated by specific algorithms and are shown in Table 2. Compared with SBA-15, the BET surface area of PtSnAl0/SBA-15 catalyst decreases from 857 m2 g−1 to 791 m2 g−1 after loading Pt and Sn, and it further decreases with increasing loading amount of Al. Meanwhile, the total pore volume and the mesopore volume decrease from 1.03 and 0.93 cm3 g−1 to 0.90 and 0.81 cm3 g−1, respectively, with increasing metal loading amount. It indicates that the metals are dispersed in the mesopores of SBA-15, revealing that the noble metal nanoparticles are confined in the mesopores of SBA-15.27
| Sample | S BET (m2 g−1) | V t (cm3 g−1) | V mes (cm3 g−1) | V mic (cm3 g−1) | d BJH (nm) |
|---|---|---|---|---|---|
| a Calculated by the BET method. b The total pore volume was obtained at a relative pressure of 0.98. c The mesoporous volume was calculated using the BJH method. d The microporous volume was calculated using the t-plot method. e Mesopore diameter was calculated using the BJH method. | |||||
| SBA-15 | 857 | 1.03 | 0.93 | 0.064 | 7.7 |
| PtSnAl0/SBA-15 | 791 | 0.94 | 0.84 | 0.062 | 7.7 |
| PtSnAl0.1/SBA-15 | 777 | 0.93 | 0.82 | 0.060 | 7.6 |
| PtSnAl0.2/SBA-15 | 766 | 0.92 | 0.82 | 0.058 | 7.6 |
| PtSnAl0.3/SBA-15 | 754 | 0.91 | 0.81 | 0.056 | 7.7 |
| PtSnAl0.4/SBA-15 | 746 | 0.90 | 0.81 | 0.055 | 7.6 |
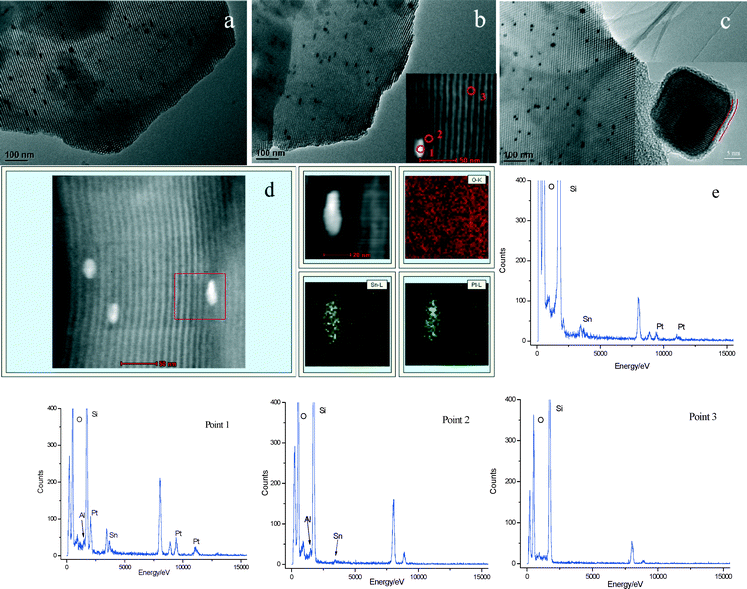
The inset of Fig. 3c shows the HRTEM image of the nanoparticle in the PtSnAl0.4/SBA-15 catalyst. It can be seen that the surface of the nanoparticle shows the existence of an amorphous phase, indicating the presence of SnOx and Al2O3 phases on the surface of the Pt nanoparticle. Distributions of Pt and Sn on the PtSnAl0/SBA-15 catalyst were confirmed by means of HAADF-STEM combined with EDS elemental mapping analysis. Fig. 3d shows the HAADF-STEM image of the PtSnAl0/SBA-15 catalyst together with the elemental mapping images of O, Sn and Pt in the same region. It is clear from the HAADF-STEM image that the nanoparticle is confined in the mesopore. In the elemental mapping images, the Pt and Sn signals show similar distributions, which coincide with the bright contrast in the HAADF image. The simultaneous presence of Pt and Sn in one nanoparticle indicates the existence of strong interactions between Pt and Sn.
In order to investigate the distribution of Pt, Sn and Al on PtSnAl/SBA-15 catalysts, EDX analysis in spot mode was done. The inset of Fig. 3b shows the HAADF image of the PtSnAl0.2/SBA-15 catalyst, and the EDX spectra from the nanoparticles (point 1), support near the nanoparticles (point 2) and the support far away from the nanoparticles (point 3) are also shown in Fig. 3. The elemental composition of the nanoparticles (point 1) indicates the presence of Pt, Sn and Al, while the peak intensity of Al is weaker than those of Sn and Pt. Point 2 shows the presence of Al and trace amounts of Sn in the support near the nanoparticles, indicating that most of the Al species and a fraction of the Sn species interact with the support. Point 3 shows only the presence of Si and O. It indicates that the elements Pt, Sn and Al are not evenly dispersed over the whole surface of the support. Pt, Sn and Al are present in the mesopores of the nanoparticles, while some Sn and most of the Al exist in the support near the nanoparticles.
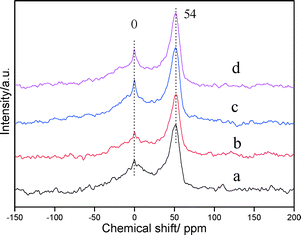 | ||
| Fig. 4 27Al MAS-NMR spectra of PtSnAl/SBA-15 catalysts: (a) PtSnAl0.1/SBA-15, (b) PtSnAl0.2/SBA-15, (c) PtSnAl0.3/SBA-15, and (d) PtSnAl0.4/SBA-15. | ||
According to the EDS and 27Al MAS-NMR results, most of Al species exist in the framework of SBA-15 near the metal active site. It results in a close contact of Al species and PtSn active sites. The close contact of Al with PtSn and support may be beneficial to a stronger interaction yielded by simultaneous impregnation.30
| Sample | Sn species (%) | Sn/Pt | I D/IG | |
|---|---|---|---|---|
| Sn0 | Sn2+, Sn4+ | |||
| PtSnAl0/SBA-15 | 17.3 | 82.7 | 10 | 1 |
| PtSnAl0.1/SBA-15 | 13.5 | 86.5 | 8.1 | 0.62 |
| PtSnAl0.2/SBA-15 | 12.4 | 87.6 | 7.6 | 0.62 |
| PtSnAl0.3/SBA-15 | 11.9 | 88.1 | 7.5 | 0.43 |
| PtSnAl0.4/SBA-15 | 10.8 | 89.2 | 6.8 | 0.39 |
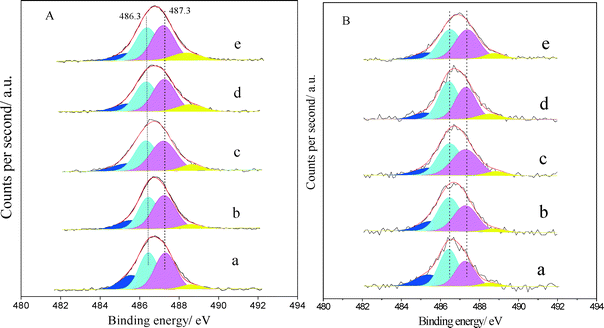
Fig. 5B shows the Sn 3d5/2 XPS spectra of PtSnAl/SBA-15 catalysts after propane dehydrogenation reaction. A slight shift to low binding energy is displayed from PtSnAl0.4/SBA-15 to PtSnAl0/SBA-15 catalyst. It has been reported that alloying with Pt might cause the shift.35,37 It is indicated that Sn species was reduced during the reaction and alloyed with Pt. Moreover, the alloying degree increased with decreasing Al content. After deconvolution of these spectra, the proportion of peaks at 485.4 and 486.3 eV is greater than that before reaction and the tendency increases with decreasing Al loading amount, indicating that the addition of Al inhibits the reduction of Sn species during propane dehydrogenation.
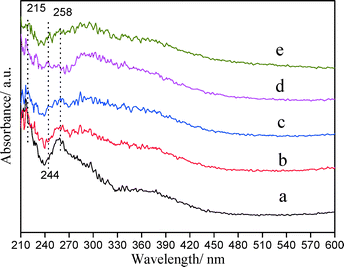 | ||
| Fig. 6 UV-vis diffuse reflectance spectra of PtSnAl/SBA-15 catalysts: (a) PtSnAl0/SBA-15, (b) PtSnAl0.1/SBA-15, (c) PtSnAl0.2/SBA-15, (d) PtSnAl0.3/SBA-15, and (e) PtSnAl0.4/SBA-15. | ||
The results of UV-vis DRS indicate that the Sn species exist in the oxidized state in PtSnAl/SBA-15 catalysts, which is consistent with the XPS results. The addition of Al, on the one hand, promotes the transformation of Td coordination Sn to Oh coordination Sn, which is in favor of the interaction with Pt and the support. On the other hand, it decreases the amount of hexacoordinated SnO2 agglomerates and increases the surface Oh coordination Sn species, which is more stable by connecting to Si through bridged oxygen.
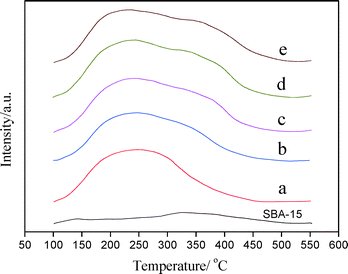 | ||
| Fig. 7 NH3-TPD profiles of SBA-15 and PtSnAl/SBA-15 catalysts: (a) PtSnAl0/SBA-15, (b) PtSnAl0.1/SBA-15, (c) PtSnAl0.2/SBA-15, (d) PtSnAl0.3/SBA-15, and (e) PtSnAl0.4/SBA-15. | ||
According to 27Al NMR results, most of the Al species in PtSnAl/SBA-15 catalysts exist in the form of framework AlO4. Whenever an Al3+ cation replaces a Si4+ cation, an additional proton (H+) is required to maintain electrical neutrality. These additional protons provide the catalyst with Brønsted acid sites.41 As shown in Fig. 7, the incorporation of Al into the framework of SBA-15 leads to the desorption peak at about 400 °C, which is attributed to the generation of Brønsted acid sites. With increasing Al content, the amount of desorbed NH3 at about 400 °C increases, indicating the increase of Brønsted acid sites, which results in the increase in acidity of the catalyst. The acid type and strength will influence catalytic performance.42
As mentioned above, most of Al incorporate into the framework of SBA-15 to form Brønsted acid sites, which are distributed around the metal active center. The local distribution of Al generates the local acid centers and shows close contact with the metal centers. The close contact of Pt and Brønsted acid sites may result in electron transfer from Pt to Brønsted proton.43 It can decrease the electron transfers to Snn+ and then prevent the formation of metallic Sn from SnOx, which can prevent the deactivation of the catalysts. A highly stable state of Sn is more difficultly reduced during dehydrogenation at high reaction temperature, which is favorable for catalytic stability.
3.2 Catalytic performance for propane dehydrogenation
PtSnAl/SBA-15 catalysts were tested for propane dehydrogenation. Fig. 8 exhibits the catalytic performance of the different catalysts. For the PtSnAl0/SBA-15 catalyst, the initial propane conversion is 50.8% and after 6 h reaction it becomes 35.3%. For PtSnAl0.1/SBA-15 and PtSnAl0.2/SBA-15 catalysts, the propane conversion increases to 55.1% and 55.9%, respectively. Meanwhile, the catalytic stabilities of these catalysts are as good as that of the PtSnAl0/SBA-15 catalyst, which shows final propane conversions of 38.8 (PtSnAl0.1/SBA-15) and 40.5% (PtSnAl0.2/SBA-15). Furthermore, there are significant differences among the PtSnAl/SBA-15 catalysts for propane conversion and catalytic stability. PtSnAl0.1/SBA-15 and PtSnAl0.2/SBA-15 catalysts show higher initial and final conversion of propane than that of PtSnAl0/SBA-15. PtSnAl0.2/SBA-15 shows the best catalytic performance for propane dehydrogenation in our experiments. Compared with PtSnAl0/SBA-15 catalysts, the promotion effect on the catalytic performance over PtSnAl/SBA-15 catalysts may be related to the stabilized effect of Sn species by the addition of Al, since the presence of Si in the support cannot stabilize the Sn species. Therefore, appropriate amounts of Al should be added to the catalyst system to maintain the oxidation state of Sn.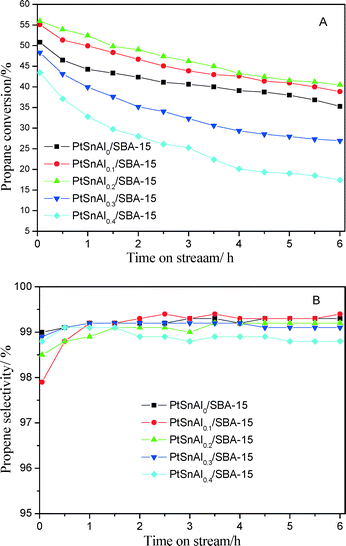 | ||
Fig. 8 (A) Propane conversion and (B) propene selectivity over PtSnAl/SBA-15 catalysts. Reaction conditions: 590 °C, C3H8![[thin space (1/6-em)]](https://www.rsc.org/images/entities/char_2009.gif) : :![[thin space (1/6-em)]](https://www.rsc.org/images/entities/char_2009.gif) Ar = 1 Ar = 1![[thin space (1/6-em)]](https://www.rsc.org/images/entities/char_2009.gif) : :![[thin space (1/6-em)]](https://www.rsc.org/images/entities/char_2009.gif) 5, WHSV of propane = 2.5 h−1. 5, WHSV of propane = 2.5 h−1. | ||
However, for PtSnAl0.3/SBA-15 and PtSnAl0.4/SBA-15 catalysts, the initial propane conversions (48.4% for PtSnAl0.3/SBA-15 and 43.4% for PtSnAl0.4/SBA-15) are lower than that of PtSnAl0/SBA-15. It may be due to a part of the metal active centers being covered by Al2O3 species during simultaneous impregnation, which is demonstrated by the TEM results. These two catalysts show faster deactivation, which may be caused by the change in acidity during the addition of Al. Moreover, as shown in Fig. 8B, the selectivity for propene on these catalysts shows trends similar to that on PtSnAl0/SBA-15 during the process. Table S1 in the ESI† lists some related literature on different catalysts for propane dehydrogenation. It can be seen that compared with non-noble catalysts, noble (Pt) catalysts show higher catalytic performance for propane dehydrogenation. Despite differences in catalyst compositions and reaction conditions, the PtSnAl/SBA-15 catalyst used in this study shows better catalytic performance than most of the catalysts.
To further investigate the influence of Al addition on the catalytic performance, a comparison of the PtSnAl0/SBA-15 and PtnAl0.2/SBA-15 catalysts by using a cycle reaction is made and the results are shown in Fig. S2.† It is obvious that despite gradual deactivation, the conversion of propane during the cycles is always higher for the PtSnAl0.2/SBA-15 catalyst than for the PtSnAl0/SBA-15 catalyst. The deactivation rate of PtSnAl0/SBA-15 is faster than that of PtSnAl0.2/SBA-15 after regeneration. These results indicate that the PtSnAl0.2/SBA-15 catalyst shows higher stability than the PtSnAl/SBA-15 catalyst in the propane dehydrogenation reaction.
4 Discussion
4.1 The effect of Al addition on the structure of PtSnAl/SBA-15 catalysts
The structure of the catalyst influences its catalytic performance. In order to investigate the influence of Al addition on the catalytic performance, the structure influence induced by Al is discussed first. For the PtSnAl0/SBA-15 catalyst, the TEM results (Fig. 3d) show that the nanoparticles are confined in the mesopores of SBA-15 and consist of Pt and Sn. According to XPS spectra, the atomic ratio of Sn/Pt was 10, whereas EDS results suggested a ratio of around 1.9 (Fig. 3e), which confirms that Sn is enriched on the surface of the nanoparticle. Most of the Sn species exist in their oxidized state according to XPS and UV-vis DRS results. Therefore, based on the structural characterization results, the nanoparticles in the mesopores of PtSnAl0/SBA-15 may exist with a surface architecture consisting of Pt nanoparticles decorated by surface SnOx.Nevertheless, the structure may not be stable during the reaction since the SnOx phase is often metastable,44 and some structural changes often occur attributed to the different temperature and reaction atmosphere.45 After the reaction, SnOx species was reduced and alloyed with Pt. This process usually results in the deactivation of the catalyst during propane dehydrogenation.46 Therefore, Al was added to the PtSn/SBA-15 system, making it a binder to strengthen the interaction of Pt–SnOx, and PtSn support. According to the XPS and UV-vis results, the addition of Al dramatically restrains the formation of Sn0 by enhancing the interaction of SBA-15 and Sn through surface Si–O–Sn or Al–O–Sn, and promotes the transformation of framework Sn(–Si–O–)4 to surface Si–O–Sn–OH or Al–O–Sn–OH. Meanwhile, the tetrahedral Al in the framework of SBA-15 possesses strong interaction with SBA-15 support by Si–O–Al, thus stabilizing the Pt particles.
4.2 The effect of Al addition on physico-chemical properties and catalytic performance
Density functional theory calculations for propane dehydrogenation show a weaker adsorption of propene on PtSn than that on Pt. It is because Sn donates electrons to Pt and results in a lower d-band center of the Pt atom on PtSn.47,48 The weakening of propene adsorption promotes its desorption and therefore enhances the selectivity for propene.49 In real PtSn-based catalysts, it can be deduced that the surface decorated by SnOx decreases adsorption of propene, which is favorable for propane dehydrogenation reaction. The high catalytic performance of the PtSnAl0/SBA-15 catalyst may be due to the efficient decoration of Pt by surface SnOx. The confined effect of PtSn nanoparticles in the mesopores inhibits the sintering of Pt, which is favorable for maintaining the high stability of the catalyst.For the PtSnAl0/SBA-15 catalysts, the active site is mainly supplied by noble metals. After addition of Al to this system, the acid sites formed and increased with increasing Al content. Therefore, the PtSnAl/SBA-15 catalysts act as bifunctional catalysts for propane dehydrogenation as described in another report.50 The role of acid site is usually the isomerization through the carbenium ion intermediates.51 Meanwhile, propane can also dehydrogenate through another path: hydride transfer from propane to carbenium ions followed by propene desorption.52 As far as metal catalysis is concerned, according to the above results, it may be deduced that the Pt atom interacts with a Brønsted proton after addition of Al. The electron transfer between Pt and support results in an electron redistribution in the Pt atom, which may lead to some decoration on the electronic structure.41 The enhanced catalytic performance may be partly due to the decoration of the Pt electronic structure and the synergistic effect of the bifunctional active centers. For the PtSnAl0.2/SBA-15, the excellent synergistic effect between noble metal active centers and acid centers enhances the catalytic performance of propane dehydrogenation.
Moreover, based on the XPS results after reaction, the addition of Al inhibits the reduction of Sn species by enhancing the interaction of SBA-15 and Sn through surface Si–O–Sn or Al–O–Sn. Thus, the catalyst keeps the oxidation state of Sn species after the reaction, and it slows down the deactivation of the catalyst during propane dehydrogenation cycles.
4.3 Coke analysis
For PtSnAl/SBA-15 catalysts, different Al loading results in different acid amounts and acid strengths, which may lead to different coke formation rates. The formation rate of coke on these catalysts influences the propane dehydrogenation deactivation rate. In this work, in situ Raman spectra were used to investigate the formation of coke.53,54Fig. 9 shows the in situ Raman spectra of (a) PtSnAl0/SBA-15, (b) PtSnAl0.2/SBA-15 and (c) PtSnAl0.4/SBA-15 catalysts for propane dehydrogenation. As shown in Fig. 9a, there is no apparent peak at the beginning of the reaction on PtSnAl0/SBA-15. After about 4.5 h, two Raman bands at around 1600 and 1330 cm−1 were observed and increased with increasing reaction time. The band at 1600 cm−1 is called the G band, which is actually the stretching vibration of any pair of sp2 sites, whether in C![[double bond, length as m-dash]](https://www.rsc.org/images/entities/char_e001.gif) C chains or in aromatic rings. The band at 1330 cm−1 is ascribed to the D band or disordered band which is the breathing mode of those sp2 sites only in rings, not in chains.55 Therefore, these bands provided information not only on the amount of coke formed on the catalyst but also on its nature. As shown in Fig. 9a, the Raman bands at around 1330 and 1600 cm−1 revealed that carbon deposition on PtSnAl0/SBA-15 took place after about 4.5 h reaction, and its intensity increases with further reaction. PtSnAl0.2/SBA-15 shows a coke formation rate similar to that of PtSn/SBA-15, indicating that a small amount of aluminum in this system does not accelerate coke formation. However, compared with these two catalysts, PtSnAl0.4/SBA-15 shows the fastest coke formation rate, which is demonstrated by the early appearance of Raman bands after 3 h reaction. In the presence of acid sites, propene oligomerization, oligomeric cyclization, etc. occurred and coke is formed. The higher acid sites generally promote this process and result in a fast coke formation rate. For PtSnAl0.4/SBA-15 with high acid content and acid strength, hydrogenolysis and coke formation reaction can be performed easily. In order to avoid the strong fluorescence phenomenon during in situ Raman experiments, the normal Raman spectra of PtSnAl/SBA-15 catalysts after 6 h reaction were collected. The spectra are shown in Fig. 10 and the intensity ratios of D and G bands (ID/IG) are listed in Table 3. As shown in Fig. 10, the stronger peak intensity of the spectra is depicted, which is due to the lower fluorescence and different testing atmosphere. The ID/IG ratio of different PtSnAl/SBA-15 catalysts decreases with increasing Al amount. This indicates that the nature of coke becomes more graphitic with a lower H/C ratio upon increasing the Al content. The reason is that propene would initially form oligomers (or polymers) and aromatics, and these surface species would lose hydrogen and become more graphitic with increasing acidity.56 In this system, the strong acid site was introduced by excess Al addition and the acidity of the support can promote the cracking/isomerization reaction,9 which results in the fast formation of coke for the PtSnAl0.4/SBA-15 catalyst.
C chains or in aromatic rings. The band at 1330 cm−1 is ascribed to the D band or disordered band which is the breathing mode of those sp2 sites only in rings, not in chains.55 Therefore, these bands provided information not only on the amount of coke formed on the catalyst but also on its nature. As shown in Fig. 9a, the Raman bands at around 1330 and 1600 cm−1 revealed that carbon deposition on PtSnAl0/SBA-15 took place after about 4.5 h reaction, and its intensity increases with further reaction. PtSnAl0.2/SBA-15 shows a coke formation rate similar to that of PtSn/SBA-15, indicating that a small amount of aluminum in this system does not accelerate coke formation. However, compared with these two catalysts, PtSnAl0.4/SBA-15 shows the fastest coke formation rate, which is demonstrated by the early appearance of Raman bands after 3 h reaction. In the presence of acid sites, propene oligomerization, oligomeric cyclization, etc. occurred and coke is formed. The higher acid sites generally promote this process and result in a fast coke formation rate. For PtSnAl0.4/SBA-15 with high acid content and acid strength, hydrogenolysis and coke formation reaction can be performed easily. In order to avoid the strong fluorescence phenomenon during in situ Raman experiments, the normal Raman spectra of PtSnAl/SBA-15 catalysts after 6 h reaction were collected. The spectra are shown in Fig. 10 and the intensity ratios of D and G bands (ID/IG) are listed in Table 3. As shown in Fig. 10, the stronger peak intensity of the spectra is depicted, which is due to the lower fluorescence and different testing atmosphere. The ID/IG ratio of different PtSnAl/SBA-15 catalysts decreases with increasing Al amount. This indicates that the nature of coke becomes more graphitic with a lower H/C ratio upon increasing the Al content. The reason is that propene would initially form oligomers (or polymers) and aromatics, and these surface species would lose hydrogen and become more graphitic with increasing acidity.56 In this system, the strong acid site was introduced by excess Al addition and the acidity of the support can promote the cracking/isomerization reaction,9 which results in the fast formation of coke for the PtSnAl0.4/SBA-15 catalyst.
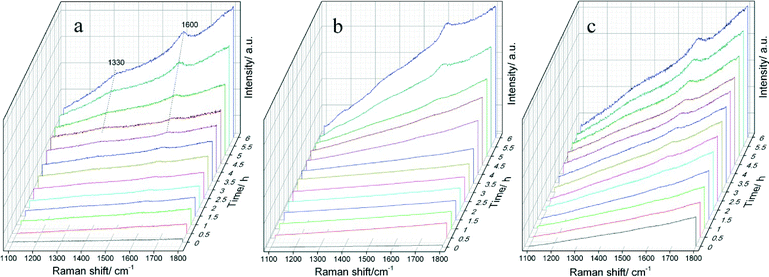 | ||
| Fig. 9 In situ Raman spectra of (a) PtSnAl0/SBA-15, (b) PtSnAl0.2/SBA-15 and (c) PtSnAl0.4/SBA-15 catalysts during the process of propane dehydrogenation. | ||
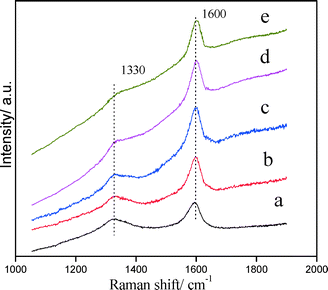 | ||
| Fig. 10 Raman spectra of the coked catalysts: (a) PtSnAl0/SBA-15, (b) PtSnAl0.1/SBA-15, (c) PtSnAl0.2/SBA-15, (d) PtSnAl0.3/SBA-15, and (e) PtSnAl0.4/SBA-15. | ||
The TPO profiles of the corresponding catalysts are displayed in Fig. 11. It can be seen that two peaks representing different carbon deposits are displayed in TPO profiles. Generally, the carbon deposits corresponding to the first peak at low temperature are mainly the deposits that cover the active metal, while the second peak at high temperature represents the deposits that are located on the external surface of the support. For PtSnAl/SBA-15 catalysts, it is clear that most of the carbon deposits are on the support, not on the active metal. It has been reported by Lieske et al.57 that the presence of Sn not only modifies the electronic properties of the Pt nanoparticles for promoting the activation of propane but also produces a ‘drain-off’ effect. This drain-off effect keeps the Pt sites clean by removing the coke precursors from the vicinity of active sites to the support. With increasing Al content, the maximum peak temperature of the TPO profile shifted to higher temperature, which indicates that the degree of graphitization is getting higher.58 This is in accordance with the results of ID/IG ratios in Raman spectra. The results of coke analysis indicate that coke is an important factor for catalyst deactivation, which is demonstrated by the fast deactivation of PtSnAl0.3/SBA-15 and PtSnAl0.4/SBA-15 with fast coke formation rate and large amount of coke.
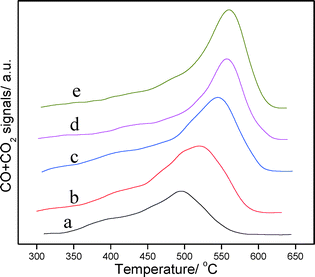 | ||
| Fig. 11 O2-TPO curves of the coked catalysts: (a) PtSnAl0/SBA-15, (b) PtSnAl0.1/SBA-15, (c) PtSnAl0.2/SBA-15, (d) PtSnAl0.3/SBA-15, and (e) PtSnAl0.4/SBA-15. | ||
5 Conclusions
In this work, the PtSnAl/SBA-15 catalysts were synthesized by simultaneous impregnation of Al with Pt and Sn precursors. A high activity for propane dehydrogenation has been achieved on PtSnAl0.2/SBA-15 with a propane conversion of 55.9% and a propene selectivity of 98.5%.In the PtSnAl/SBA-15 catalyst, most of the Al incorporate into the framework of SBA-15 and exist around the metal active centers, which results in the close contact of metal sites and acid sites and favors the synergistic effect of the bifunctional active centers. Moreover, electron transfer from the metal center to the acid center may also occur and lead to the change in the electronic properties of Pt, which results in different catalytic performance. The addition of Al can increase the interaction of Sn and support and inhibit the reduction of Sn species during reaction. It consequently improves propane conversion and catalytic stability.
Furthermore, the addition of Al changes the acidity of the catalysts, which influences coke formation. In situ Raman spectra results indicate that the catalysts with different Al contents show different coke formation rates. The addition of excess Al results in the increase in strong acid sites, which is favorable for coke formation, and leads to the fast deactivation of the catalyst. The excellent catalytic performance for propane dehydrogenation on PtSnAl0.2/SBA-15 is due to the efficient decoration of Pt by interface-confined SnOx, the confined effect of active centers in mesopores and the synergistic effect between noble metal active site and acid site.
Acknowledgements
The authors are grateful for financial support from the National Basic Research Program of China (grant no. 2012CB215002), the National Natural Science Foundation of China (21177160, 21376261, 21303263 and 21173270), the Beijing Natural Science Foundation (2142027), the Beijing Nova Program (no. Z141109001814072), and the Doctor Select Foundation (20130007110007, 20130007120011).Notes and references
- M. S. Kumar, N. Hammer, M. Rønning, A. Holmen, D. Chen, J. C. Walmsley and G. Øye, J. Catal., 2009, 261, 116 CrossRef PubMed.
- J. Schäferhans, S. Gómez-Quero, D. V. Andreeva and G. Rothenberg, Chem. – Eur. J., 2011, 17, 12254 CrossRef PubMed.
- J. H. Yun and R. F. Lobo, J. Catal., 2014, 312, 263 CrossRef CAS PubMed.
- P. Biloen, F. M. Dautzenberg and W. M. H. Sachtler, J. Catal., 1977, 50, 77 CrossRef CAS.
- Z. Nawaz, X. P. Tang, Y. Wang and F. Wei, Ind. Eng. Chem. Res., 2010, 49, 1274 CrossRef CAS.
- J. J. H. B. Sattler, A. M. Beale and B. M. Weckhuysen, Phys. Chem. Chem. Phys., 2013, 15, 12095 RSC.
- G. Meitzner, G. H. Via, F. W. Lytle, S. C. Fung and J. H. Sinfelt, J. Phys. Chem., 1988, 92, 2925 CrossRef CAS.
- H. Verbeek and W. M. H. Sachtler, J. Catal., 1976, 42, 257 CrossRef CAS.
- J. R. Kitchin, J. K. Norskov, M. A. Barteau and J. G. Chen, Phys. Rev. Lett., 2004, 93, 156801 CrossRef CAS.
- S. B. He, C. L. Sun, Z. W. Bai, X. H. Dai and B. Wang, Appl. Catal., A, 2009, 356, 88 CrossRef CAS PubMed.
- C. L. Yu, Q. J. Ge, H. Y. Xu and W. Z. Li, Appl. Catal., A, 2006, 315, 58 CrossRef CAS PubMed.
- Y. W. Zhang, Y. M. Zhou, J. J. Shi, S. J. Zhou, Z. W. Zhang, S. C. Zhang and M. P. Guo, Fuel Process. Technol., 2013, 111, 94 CrossRef CAS PubMed.
- S. Gómez-Quero, T. Tsoufis, P. Rudolf, M. Makkee, F. Kapteijn and G. Rothenberg, Catal. Sci. Technol., 2013, 3, 962 Search PubMed.
- N. R. Shiju, A. H. Alberts, S. Khalid, D. R. Brown and G. Rothenberg, Angew. Chem., Int. Ed., 2011, 50, 9615 CrossRef CAS PubMed.
- J. M. Sun and X. H. Bao, Chem. – Eur. J., 2008, 14, 7478 CrossRef CAS PubMed.
- B. K. Vu, S. M. Bok, I. Y. Ahn and E. W. Shin, Catal. Lett., 2009, 133, 376 CrossRef CAS PubMed.
- S. D. Jackson, G. J. Kelly and G. Web, J. Catal., 1998, 176, 225 CrossRef CAS.
- O. A. Bariås, A. Holmen and E. A. Blekkan, Catal. Today, 1995, 24, 361 CrossRef.
- L. H. Huang, B. L. Xu, L. L. Yang and Y. N. Fan, Catal. Commun., 2008, 9, 2593 CrossRef CAS PubMed.
- Q. Li, Z. J. Sui, X. G. Zhou, Y. Zhu, J. H. Zhou and D. Chen, Top. Catal., 2011, 54, 888 CrossRef CAS.
- D. Y. Zhao, J. L. Feng, Q. S. Huo, N. Melosh, G. H. Fredrickson, B. F. Chmelka and G. D. Stucky, Science, 1998, 279, 548 CrossRef CAS.
- A. Ungureanu, B. Dragoi, A. Chirieac, C. Ciotonea, S. Royer, D. Duprez, A. S. Mamede and E. Dumitriu, ACS Appl. Mater. Interfaces, 2013, 5, 3010 CAS.
- A. K. Medina-Mendoza, M. A. Cortés-Jácome, J. A. Toledo-Antonio, C. Angeles-Chávez, E. López-Salinas, I. Cuauhtémoc-López, M. C. Barrera, J. Escobar, J. Navarrete and I. Hernández, Appl. Catal., B, 2011, 106, 14 CAS.
- Z. Kónya, V. F. Puentes, I. Kiricsi, J. Zhu, A. P. Alivisatos and G. A. Somorjai, Nano Lett., 2002, 2, 907 CrossRef.
- R. M. Rioux, H. Song, J. D. Hoefelmeyer, P. Yang and G. A. Somerjai, J. Phys. Chem. B, 2005, 109, 2192 CrossRef CAS PubMed.
- M. S. Kumar, A. Holmen and D. Chen, Microporous Mesoporous Mater., 2009, 126, 152 CrossRef PubMed.
- Z. J. Wang, Y. B. Xie and C. J. Liu, J. Phys. Chem. C, 2008, 112, 19818 CAS.
- K. Moller and T. Bein, Chem. Mater., 1998, 10, 2950–2963 CrossRef CAS.
- R. Rachwalik, Z. Olejniczak, J. Jiao, J. Huang, M. Hunger and B. Sulikowski, J. Catal., 2007, 252, 161 CrossRef CAS PubMed.
- W. W. Lonergan, D. G. Vlachos and J. G. Chen, J. Catal., 2010, 271, 239 CrossRef CAS PubMed.
- A. Shanmugasundaram, P. Basak, L. Satyanarayana and S. V. Manorama, Sens. Actuators, B, 2013, 185, 265 CrossRef CAS PubMed.
- B. K. Vu, M. B. Song, I. Y. Ahn, Y. Suh, D. J. Suh, W. Kim, H. Koh, Y. G. Choi and E. W. Shin, Appl. Catal., A, 2011, 400, 25 CrossRef CAS PubMed.
- J. C. Serrano-Ruiz, G. W. Huber, M. A. Sánchez-Castillo, J. A. Dumesic, F. Rodríguez-Reinoso and A. Sepúlveda-Escribano, J. Catal., 2006, 241, 378 CrossRef CAS PubMed.
- S. N. Coman, V. I. Parvulescu, M. D. Bruyn, D. E. D. Vos and P. A. Jacobs, J. Catal., 2002, 206, 218 CrossRef CAS.
- X. D. Wang, J. Stöver, V. Zielasek, L. Altmann, K. Thiel, K. Al-Shamery, M. Bäumer, H. Borchert, J. Parisi and J. Kolny-Olesiak, Langmuir, 2011, 27, 11052 CrossRef CAS PubMed.
- X. D. Wang, H. B. Yu, D. Y. Hua and S. H. Zhou, J. Phys. Chem. C, 2013, 117, 7294 CAS.
- M. T. Paffet and R. G. Windham, Surf. Sci., 1989, 208, 34 CrossRef.
- S. Chen, H. Tsai, W. Chuang, J. Lee, C. Tang, C. Lin and S. Cheng, J. Phys. Chem. C, 2009, 113, 15226 CAS.
- S. Roy, K. Bakhmutsky, E. Mahmoud, R. F. Lobo and R. J. Gorte, ACS Catal., 2013, 3, 573 CrossRef CAS.
- M. Boronat, P. Concepción, A. Corma, M. Renz and S. Valencia, J. Catal., 2005, 234, 111 CrossRef CAS PubMed.
- F. Bin, C. L. Song, G. Lv, X. F. Cao, H. T. Pang and K. P. Wang, J. Phys. Chem. C, 2012, 116, 26262 CAS.
- K. Wilson, D. J. Adams, G. Rothenberg and J. H. Clark, J. Mol. Catal. A: Chem., 2000, 159, 309 CrossRef CAS.
- P. Treesukol, K. Srisuk, J. Limtrakul and T. N. Truong, J. Phys. Chem. B, 2005, 109, 11940 CrossRef CAS PubMed.
- J. A. Rodriguez and J. Hrbek, Surf. Sci., 2010, 604, 241 CrossRef CAS PubMed.
- K. Liu, A. Q. Wang and T. Zhang, ACS Catal., 2012, 2, 1165 CrossRef CAS.
- Y. W. Zhang, Y. M. Zhou, L. Huang, M. W. Xue and S. B. Zhang, Ind. Eng. Chem. Res., 2011, 50, 7896 CrossRef CAS.
- M. L. Yang, Y. A. Zhu, X. G. Zhou, Z. J. Sui and D. Chen, ACS Catal., 2012, 2, 1247 CrossRef CAS.
- A. W. Hauser, J. Gomes, M. Bajdich, M. Head-Gordon and A. T. Bell, Phys. Chem. Chem. Phys., 2013, 15, 20727 RSC.
- L. Nykänen and K. Honkala, ACS Catal., 2013, 3, 3026 CrossRef.
- A. Kuhlmann, F. Roessner, W. Schwieger, O. Gravenhorst and T. Selvam, Catal. Today, 2004, 97, 303 CrossRef CAS PubMed.
- P. B. Weisz and E. W. Swegler, Science, 1957, 126, 31 CAS.
- M. Guisnet and N. S. Gnep, Catal. Today, 1996, 31, 275 CrossRef CAS.
- C. Li and P. C. Stair, Catal. Today, 1997, 33, 353 CrossRef CAS.
- I. E. Wachs, Top. Catal., 1999, 8, 57 CrossRef CAS.
- B. M. Vogelaar, A. Dick van Langeveld, S. Eijsbouts and J. A. Moulijn, Fuel, 2007, 86, 1122 CrossRef CAS PubMed.
- A. Iglesias-Juez, A. M. Beale, K. Maaijen, T. C. Weng, P. Glatzel and B. M. Weckhuysen, J. Catal., 2010, 276, 268 CrossRef CAS PubMed.
- H. Lieske, A. Sárkány and J. Völter, Appl. Catal., 1987, 30, 69 CrossRef CAS.
- S. B. He, C. L. Sun, X. Yang, B. Wang, X. H. Dai and Z. W. Bai, Chem. Eng. J., 2010, 163, 389 CrossRef CAS PubMed.
Footnotes |
| † Electronic supplementary information (ESI) available. See DOI: 10.1039/c4cy00951g |
| ‡ This author contributed equally as the first author. |
| This journal is © The Royal Society of Chemistry 2015 |


