TiO2-supported heteropoly acid catalysts for dehydration of methanol to dimethyl ether: relevance of dispersion and support interaction†
Rosa María
Ladera
,
Manuel
Ojeda
,
José Luis G.
Fierro
and
Sergio
Rojas
*
Grupo de Energía y Química Sostenibles, Instituto de Catálisis y Petroleoquímica, CSIC, C/Marie Curie 2, L10, 28049, Madrid, Spain. E-mail: srojas@icp.csic.es; Fax: + 34 91 585 4860; Tel: +34 91 585 4632
First published on 9th September 2014
Abstract
Two heteropoly acids (HPAs) with Keggin structures, namely, H3PW12O40 (HPW) and H4SiW12O40 (HSiW), have been deposited on TiO2 and used as catalysts for the production of dimethyl ether (DME) from methanol. The catalysts have been prepared by incipient wetness impregnation of HPW and HSiW on TiO2 with HPA loadings ranging between 0.9 and 9.0 Keggin units (KU) per square nanometer. The structure and acid properties of the final catalysts have been thoroughly characterized by N2 adsorption–desorption isotherms, TGA, XRD, Raman spectroscopy, XPS, NH3 adsorption isotherms, DRIFT and 1H NMR. All catalysts exhibit very high DME productivities and high methanol conversion rates at temperatures as low as 413 K. The effect of the HPA loading on TiO2 for the production of DME has been correlated with the structure and acid properties of the final catalyst. We find an optimum loading for both TiO2-supported HPW and HSiW of 2.3 KU nm−2. At this level, both HPW and HSiW are well dispersed onto the support, thus permitting the access of methanol to the active acid sites. On the contrary, higher HPA loadings on TiO2 result in the formation of larger HPA units that prevent the access of methanol to the inner acid sites within the HPA. On the other hand, HPA loadings below 2.3 KU nm−2 result in a strong interaction between the acid protons of the HPAs and the support, hence preventing the participation of such protons in the methanol dehydration reaction, which results in lower methanol conversion rates.
Introduction
Methanol is amongst the top 10 commodity chemicals produced globally, having applications within different sectors, including chemical intermediates and fuels. Methanol can be used as fuel, either directly or blended with other petroleum products. It can also be used to produce fuels via the formation of olefins by means of the so-called methanol-to-olefin and methanol-to-gasoline processes. It is also a raw material for different chemicals, including formaldehyde, dimethyl ether (DME), methyl tert-butyl ether (MTBE) and acetic acid.1 Amongst these, DME is gaining a great deal of attention. Currently, DME is mainly used as an aerosol propellant or, due to its similar properties to liquefied petroleum gas (LPG), as a domestic fuel blended with LPG, particularly in Asia.2–4 However, due to the good ignition, burning properties and high cetane number of DME, the possibility of its use as fuel in diesel engines instead of the conventional diesel has triggered the interest in DME for the transportation sector. In fact, DME combustion leads to low emission levels of nitrous oxides and particulate matter compared to diesel combustion.5 Moreover, the possibility of obtaining DME from lignocellulosic biomass via thermochemical treatments such as pyrolysis and/or gasification, and as a consequence its qualification as a second-generation biofuel, has triggered governmental interest in the production and use of DME from biomass-derived syngas.6The main route for the synthesis of DME is the dehydration of methanol (2CH3OH ↔ CH3OCH3 + H2O), which is a gas-phase exothermic reaction, conducted typically at 1.0–2.0 MPa, 493–523 K, using solid acid catalysts such as γ-Al2O3.4,7 Recently, the direct synthesis of DME from syngas (3CO + 3H2 ↔ CH3OCH3 + CO2 and 4H2 + 2CO ↔ CH3OCH3 + H2O) has been proposed. This process is carried out at 4.0–5.0 MPa, 473–623 K, using hybrid catalysts within a single reactor combining two functionalities: a Cu/ZnO/Al2O3-based catalyst for the synthesis of methanol and an acid solid catalyst for methanol dehydration.8 Also, the use of CO2 as a raw material for DME production has been proposed recently.9
The most typical acid catalysts for the dehydration of methanol to DME include γ-Al2O3, zeolites and mixed/supported oxides.10–18 These catalysts show high methanol conversion per pass; however, due to the high operation temperatures, the formation of undesired by-products such as light hydrocarbons and coke is favoured resulting in a decrease of the productivity of DME along with a higher rate of catalyst deactivation. Recently, it has been reported that heteropoly acids (HPAs) exhibit very high catalytic activities for the dehydration of alcohols.19–25 In fact, some HPAs exhibit higher reaction rates than conventional solid acid catalysts.11,20,24 In a recent study,23 we reported that TiO2-supported tungstosilicic acid (H4SiW12O40) is a very active catalyst for methanol dehydration even at temperatures as low as 413 K, reaching conversions of ca. 80% at 453 K. In fact, γ-Al2O3 requires much higher temperatures, above 523 K, to reach the same methanol conversion value.
HPAs are a class of solid acids constituting polyoxometalate (POM) units, i.e., metal–oxygen cluster anions, which may exhibit different structures, with the most typical ones being the Keggin and Dawson structures. HPAs exhibiting the Keggin structure are the most stable ones and have found industrial application as acid catalysts.26 They are formed by a central tetrahedron (XO4) surrounded by four octahedral (MO6) units. This anion is stabilized by protons, which are responsible for the high Brønsted acidity of these materials.27–29 The most typical HPAs used for alcohol dehydration reactions are the phosphotungstic (H3PW12O40) and the tungstosilicic acids (H4SiW12O40).
One of the main drawbacks of the HPAs when it comes to their behaviour as heterogeneous catalysts is their very low surface area, typically below 10 m2 g−1. One strategy to overcome this issue is to deposit/disperse HPAs onto high surface area solids such as SiO2, TiO2, ZrO2 or zeolites.20,24,30–32 However, their structure and, as a consequence, the acid properties of the HPAs may be altered upon the deposition process. For instance, decreasing acid strength of H3PW12O40 and Cs1.5H0.5PW12O40 after supporting has been reported.33,34 It should be noted, however, that the catalytic performance of supported HPAs is associated not only with their acid strength. A recent study indicates that despite the lower acid strength of TiO2-supported HPW or HSiW, these catalysts are more active and resistant than the corresponding bulk HPAs for the dehydration of methanol to DME.23 This is because the decrease in the acid strength weakens the interaction between H2O molecules and the acid sites of the HPA, hence facilitating the access of methanol to the active acid sites and leading to higher turnover frequencies (TOF). This proposal also explains the higher catalytic activity of supported HPAs as compared with bulk HPAs observed for methanol and ethanol dehydration reaction reported by other groups.20,30
The aim of this work is to study the effect of the HPA loading for the methanol dehydration reaction with TiO2-supported H3PW12O40 (HPW) or H4SiW12O40 (HSiW). The catalysts have been thoroughly characterized in order to understand the relationship between the catalytic activity for the production of DME and the evolution of the structure and acid properties of the catalysts with the HPA loading.
Experimental
Preparation of HPA/TiO2 catalysts
Supported heteropoly acids were prepared by incipient wetness impregnation. The appropriate amounts of phosphotungstic acid (H3PW12O40·xH2O, Sigma-Aldrich, reagent grade) and tungstosilicic acid (H4SiW12O40·xH2O, Sigma-Aldrich, ≥99.9%) were dissolved in ethanol and added dropwise to TiO2 powder (Degussa P25, 20% rutile, 80% anatase, 53 m2 g−1). After impregnation, the samples were held at room temperature for 24 h to facilitate the uniform distribution of the HPA clusters over TiO2, and subsequently, they were dried in static air at 333 K for 24 h. The heteropoly acid surface density of the prepared catalysts ranges between 0.9 and 9.0 Keggin units (or polyoxometalates) per square nanometre of the support (KU nm−2). Taking into account that the size of the Keggin unit ranges between 0.9 and 1.5 nm (ref. 30 and references therein) an HPA loading between 1.23 and 0.5 KU nm−2 would, in principle, result in a monolayer coverage of HPA on TiO2. The catalysts are named xHPW/TiO2 and xHSiW/TiO2, where x denotes the surface density of the HPA (KU nm−2). Bulk phosphotungstic acid (HPW) and tungstosilicic acid (HSiW) were dried at 333 K and used as reference materials.Characterization techniques
The Brunauer–Emmett–Teller (BET) specific surface areas were determined from N2 adsorption–desorption isotherms at 77 K collected using a Micromeritics ASAP 2010. Before recording the isotherms, the samples were degassed at 413 K for 16 h.Thermogravimetric analysis (TGA) was carried out using a TGA/SDTA851 (Mettler Toledo) instrument, with a heating rate of 10 K min−1, from room temperature up to 1250 K, under synthetic air flow (20 vol.% O2 and 80 vol.% N2).
The X-ray diffraction (XRD) patterns (2θ = 5°–90°) were recorded at room temperature with a Seiffert 3000 Xpert X-ray diffractometer using Cu Kα radiation. The phase identification was made by comparison with patterns from the International Centre for Diffraction Data (ICDD) database.
A Renishaw inVia Raman microscope spectrometer equipped with a laser beam emitting at 532 nm and 100 mW output power was used to collect the Raman spectra. The photons scattered by the sample were dispersed with a grating monochromator at 1800 lines per millimeter and simultaneously collected using a CCD camera; the collection optics was set at 50× objective. The spectral resolution is 1 cm−1.
The X-ray photoelectron spectra (XPS) of the samples were obtained with a VG Escalab 200R spectrometer equipped with a hemispherical electron analyzer using a Mg Kα (hν = 1253.6 eV) X-ray source. The XPS data were signal averaged for at least 200 scans and were taken at intervals of 0.1 eV. The charging effects were corrected by setting the Ti 2p3/2 peak as internal reference at 459.0 eV. High-resolution spectral envelopes were obtained with curve-fitting peak components using the XPS peak software. The raw data were used with no preliminary smoothing. The curve fitting was performed using Newton's iteration methods and 200 iterations. Symmetric Gaussian–Lorentzian product functions were used to approximate the line shapes of the fitting components. Chi-squared minimum values were used to mathematically ensure and obtain the optimized fitting parameters.
The amount of ammonia adsorbed by the samples was determined from NH3 adsorption isotherms which were recorded at 373 K with ASAP 2010/2000 Micromeritics equipment. Before NH3 adsorption, the samples were treated at 473 K under vacuum for 12 h. The irreversible ammonia uptake was calculated as a difference between the total uptake of ammonia, detected in the first isotherm, and the amount of ammonia released upon the subsequent desorption stage, which was determined by a second isotherm
DRIFT spectra of adsorbed ammonia were obtained with a FTIR-6300 JASCO Fourier transform spectrophotometer equipped with a Harrick diffuse reflectance accessory (HVC-DRP cell). Before the ammonia adsorption, the catalysts were treated at 493 K under He flow (20 mL min−1) for 30 min. Subsequently, the NH3 was adsorbed on the catalysts by flowing 5 vol.% NH3 in He at 20 mL min−1 for 15 min. Then, the DRIFT cell was purged under He flow (20 mL min−1) for 30 min, and the adsorbed NH3 spectra were recorded at increasing temperature (from 373 to 773 K, 15 K min−1).
Solid-state NMR measurements were carried out with a Bruker AV-400-WB spectrometer at a 1H NMR frequency of 400.13 MHz, using a 2.5 mm double-resonance MAS probe. Spinning speed was set at 25 kHz. Single-pulse experiments used a 3 μs π/2 pulse, a spectral width of 35 kHz and a relaxation delay of 2 s. All measurements were taken at room temperature using H2O as secondary external reference at 4.77 ppm relative to TMS as primary external reference. All samples were kept at 373 K before the NMR experiments and rapidly transferred to the analysis chamber to avoid further hydration.
Methanol dehydration reactions
Conversion of methanol to DME was measured in a fixed-bed reactor. The catalytic bed was prepared by diluting 0.2 g of the catalyst (0.25–0.30 mm) with 2.0 g of SiC (0.25–0.30 mm) to avoid hot spots. The catalysts were pretreated at 493 K under N2 flow for 1 h. The reaction was running at atmospheric pressure with N2 as carrier gas (16.7 vol.% methanol; total space velocity, 14![[thin space (1/6-em)]](https://www.rsc.org/images/entities/char_2009.gif) 400 cm3 h−1 gcat−1) at 413, 433 and 453 K (measured directly in the catalytic bed). Reactants and products were analysed online with a gas chromatograph (Varian CP-3800) equipped with a compacted column (Carboxen 1000, 4.6 m × 0.32 cm) connected to a TCD detector, where inorganic gases (H2, N2, CO and CO2) were measured, and with a capillary column (SPB-5, 60 m × 0.53 mm) connected to a flame ionization detector (FID) to analyze organic compounds (CH3OH, CH3OCH3, and light hydrocarbons). Methanol conversion (XCH3OH) and product selectivity (Si) were calculated as follows:
400 cm3 h−1 gcat−1) at 413, 433 and 453 K (measured directly in the catalytic bed). Reactants and products were analysed online with a gas chromatograph (Varian CP-3800) equipped with a compacted column (Carboxen 1000, 4.6 m × 0.32 cm) connected to a TCD detector, where inorganic gases (H2, N2, CO and CO2) were measured, and with a capillary column (SPB-5, 60 m × 0.53 mm) connected to a flame ionization detector (FID) to analyze organic compounds (CH3OH, CH3OCH3, and light hydrocarbons). Methanol conversion (XCH3OH) and product selectivity (Si) were calculated as follows:Results and discussion
Table 1 shows the composition and BET surface areas of xHPW/TiO2 and xHSiW/TiO2, respectively. As expected, the specific surface area of the HPAs/TiO2 decreases with the increasing loading of HPA. However, even for the catalyst containing the highest HPA loading in the series (x = 9.0 KU nm−2), the surface area value is approximately four times higher than that of the bulk HPA.| Catalysts | Nominal HPA content (wt.%) | Surface area (m2 g−1) | NH3 chemisorbed (molNH3 molHPA−1) | DME productiona (millimoles DME per acid site per hour) |
|---|---|---|---|---|
a The number of acid sites was calculated from NH3 isotherms. Reaction conditions: 453 K, 1 bar, 16.7 vol.% methanol, and 14![[thin space (1/6-em)]](https://www.rsc.org/images/entities/char_2009.gif) 400 cm3 h−1 gcat−1. 400 cm3 h−1 gcat−1.
|
||||
| 0.9HPW/TiO2 | 19 | 56 | 4.7 | 27.5 |
| 2.3HPW/TiO2 | 37 | 48 | 3.4 | 39.4 |
| 4.5HPW/TiO2 | 53 | 40 | 3.5 | 27.7 |
| 9.0HPW/TiO2 | 70 | 31 | 2.9 | 20.9 |
| HPW | 100 | 8 | 2.9 | 7.3 |
| 0.9HSiW/TiO2 | 19 | 59 | 5.0 | 32.1 |
| 2.3HSiW/TiO2 | 37 | 49 | 4.0 | 39.6 |
| 4.5HSiW/TiO2 | 53 | 44 | 3.8 | 30.5 |
| 9.0HSiW/TiO2 | 70 | 37 | 3.8 | 21.9 |
| HSiW | 100 | 8 | 3.5 | 10.7 |
The XRD patterns for xHPW/TiO2 and xHSiW/TiO2 along with those of the corresponding bulk HPAs are shown in Fig. 1a and b, respectively. All diffractograms of xHPA/TiO2 show a set of reflections at 2θ = 25.3°, 36.9°, 37.8° and 38.5° and at 2θ = 27.4° and 36.1° attributed to the rutile (JCPDS# 00-001-1292) and anatase (JCPDS# 00-001-0562) phases of TiO2, respectively. In fact, these reflections are the only ones observed in the diffractograms for the catalysts with the lowest HPA loadings, 0.9HPW/TiO2 and 0.9HSiW/TiO2. The lack of diffraction lines characteristic of the HPAs in these diffractograms is indicative of the high dispersion of the HPA on the support. This result indicates that monolayer coverage is not reached for the catalysts with HPA with loadings of up to 0.9 KU nm2. For the catalysts with higher HPA loadings, reflections attributed to H3PW12O40·6H2O35–37 and H4SiW12O40·xH2O (x > 6)23,38 are observed. Note that the hydration level of the HSiW-based catalysts is higher than that of the HPW-based ones irrespective of the actual HPA loading. These results confirm that the Keggin structure is preserved upon the impregnation of the HPAs onto TiO2, at least when the HPA loading is ≥2.3 KU nm−2.
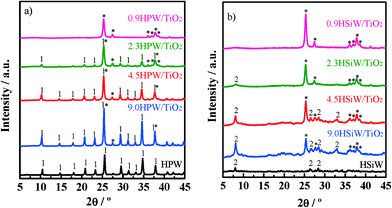 | ||
| Fig. 1 X-ray diffraction patterns of HPW and xHPW/TiO2 (a) and HSiW and xHSiW/TiO2 (b). Reflections of TiO2 (*), H3PW12O40·6H2O (1) and highly hydrated H4SiW12O40·xH2O (2) are indicated. | ||
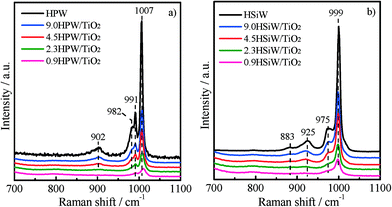
Raman spectroscopy was used to elucidate the molecular structure of the supported and bulk HPAs. The Raman spectra shown in Fig. 2a and b were recorded under ambient conditions. The Raman bands of the dehydrated heteropoly acids tend to become less intense and broader than those recorded for hydrated HPAs.23 As a consequence, the assignment of the Raman bands in the spectra of the dehydrated supported catalysts containing low amounts of HPA is not straightforward. The Raman spectrum of the bulk HPW shows two intense bands at 1007 and 991 cm−1, which are attributed to the symmetric and asymmetric stretching modes of terminal W![[double bond, length as m-dash]](https://www.rsc.org/images/entities/char_e001.gif) Ot. Two less intense bands at 982 and 902 cm−1 are also observed and ascribed to the stretching vibration of P–Oa and to the bridging vibration of W–Ob–W bonds, respectively.39–42 Similarly, bulk HSiW exhibits two intense Raman bands at 999 and 975 cm−1 assigned to the symmetric and asymmetric ν(W
Ot. Two less intense bands at 982 and 902 cm−1 are also observed and ascribed to the stretching vibration of P–Oa and to the bridging vibration of W–Ob–W bonds, respectively.39–42 Similarly, bulk HSiW exhibits two intense Raman bands at 999 and 975 cm−1 assigned to the symmetric and asymmetric ν(W![[double bond, length as m-dash]](https://www.rsc.org/images/entities/char_e001.gif) Ot) and two less intense bands at 925 and 883 cm−1 due to the ν(Si–Oa) and ν(W–Ob–W) modes.42 The spectra of the supported catalysts show the same bands as described above for the corresponding bulk HPAs, although their intensity decreases visibly with the decreasing HPA loading. The presence of the same Raman bands in the spectra for the xHPA/TiO2 and for the bulk HPAs indicates that the Keggin structure of the HPA remains stable upon impregnation on TiO2, even for the catalyst with the lowest HPA loading of 0.9 KU nm−2. The preservation of the structure of the HPAs is further supported by the absence of bands of the individual oxides, i.e., from the lack of bands for WO3, which appear upon the decomposition of the Keggin structure at ca. 796 cm−1.14,23
Ot) and two less intense bands at 925 and 883 cm−1 due to the ν(Si–Oa) and ν(W–Ob–W) modes.42 The spectra of the supported catalysts show the same bands as described above for the corresponding bulk HPAs, although their intensity decreases visibly with the decreasing HPA loading. The presence of the same Raman bands in the spectra for the xHPA/TiO2 and for the bulk HPAs indicates that the Keggin structure of the HPA remains stable upon impregnation on TiO2, even for the catalyst with the lowest HPA loading of 0.9 KU nm−2. The preservation of the structure of the HPAs is further supported by the absence of bands of the individual oxides, i.e., from the lack of bands for WO3, which appear upon the decomposition of the Keggin structure at ca. 796 cm−1.14,23
The surface composition of the catalysts was determined by XPS. The W 4f core-level region of the spectra of the bulk and supported HPW and HSiW catalysts is shown in the ESI† (Fig. S1). All catalysts show a W 4f doublet at 35.2–35.8 eV, in good agreement with previous results for bulk and supported HPAs.42–44 The position of the W 4f peak does not change significantly with the HPA loading. Remarkably, the bulk HPAs show an additional W 4f doublet at 37.2 and 38.2 eV for HPW and HSiW, respectively, which are attributed to the presence of H2O around the Keggin units.42,43 The contribution of the W 4f doublet ascribed to the hydrated HPA is more significant for HSiW than for HPW, suggesting, in line with the XRD results discussed above, a higher hydration level of the HSiW-based HPAs. A further peak at 37.4 eV assigned to the Ti 3p level of Ti4+ (TiO2) is also observed for the supported samples. The evolution of the surface atomic W/Ti ratios calculated from the area of the XPS peaks, which was previously normalized to their corresponding atomic sensitivity factors, and the nominal W/Ti atomic ratios as a function of HPA loading are shown in Fig. 3. As observed, the surface atomic W/Ti ratio increases with increasing HPA loading, reaching a plateau at HPA loadings ≥2.3 KU nm−2 for the HPW catalysts and at loadings ≥4.5 KU nm−2 for the HSiW samples. These results suggest that HPAs remain well dispersed on TiO2 for HPW loadings ≤2.3 KU nm−2 and HSiW loadings ≤4.5 KU nm−2, forming 3-dimensional clusters in the catalysts with higher HPA loadings. This observation agrees well with the lack of diffraction peaks of the HPAs in the samples with low HPA loadings.
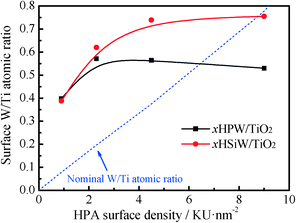 | ||
| Fig. 3 Variation of surface and nominal W/Ti atomic ratios as a function of the HPA loading for xHPW/TiO2 and xHSiW/TiO2 catalysts. | ||
The thermal stability of the xHPA/TiO2 catalysts was studied by thermogravimetric analyses recorded under air flow from room temperature to 1250 K (ESI,† Fig. S2 and S3). All catalysts show a weight loss at temperatures below 373 K, which is attributed to the removal of physisorbed water. This process leads to the formation of the relatively stable hexahydrated structures, H3PW12O40·6H2O and H4SiW12O40·6H2O, in both the bulk and the supported HPAs.23,45,46 In such hexahydrated structures, the water of crystallization is located between the Keggin units, forming hydrogen bonds with the acid protons in the form of [H2O⋯H+⋯OH2] ions.45,47 For loadings higher than 2.3 KU nm−2, a second weight loss is observed between 432 and 470 K, which corresponds to the formation of anhydrous H3PW12O40 and H4SiW12O40 species upon removal of the water of crystallization molecules.23 This weight loss is not observed for the catalysts with HPA loading ≤0.9 KU nm−2, probably due to the detection limit of the thermobalance equipment. At higher temperatures (T >700 K), a small weight loss is observed for the bulk and highly loaded catalysts. This process corresponds to the loss of constitutional water, and consequently, it leads to the complete deprotonation of the HPAs to form PW12O38.5 and SiW12O38.45,46 The complete decomposition of the HPA takes place at higher temperatures without a recordable weight loss process.23 The thermal analyses indicate that the Keggin structure in both bulk and supported HPAs is stable at temperatures below 723 K.
The acid properties of the HPA-based catalysts have been assessed by using NH3 as a probe molecule. NH3 was selected as a probe molecule because it allows for the evaluation of both the surface and the bulk acidity of the HPAs.48 The density of acid sites has been determined by recording NH3 adsorption isotherms at 373 K. Previously, the catalysts were thermally treated at 473 K under vacuum overnight. Then, the first NH3 adsorption isotherm, which includes both chemisorbed and physisorbed NH3, was registered. Afterwards, the sample was evacuated at 373 K under vacuum for 4 h in order to remove physisorbed NH3. Subsequently, a second adsorption isotherm was taken under the same conditions. The amount of NH3 adsorbed in the second isotherm corresponds to physisorbed NH3 species. Therefore, the amount of chemisorbed NH3 on the catalyst surface can be calculated from the difference between the first and the second NH3 isotherms. The amount of chemisorbed NH3 can be considered as a measure of the number of acid sites on the catalyst, inclusive of the bulk and surface acid sites.49 The amount of chemisorbed NH3 for all catalysts is shown in Fig. 4. Clearly, depositing HPW or HSiW on TiO2 results in a decrease in the total number of acid sites per gram of the catalyst. Remarkably, the observed decrease is linear with the amount of HPA (expressed as weight percentage) in the catalysts. The amounts of chemisorbed NH3 per Keggin unit for HPW- and HSiW-based catalysts are shown in Table 1. The amounts of ammonia chemisorbed by the bulk HPW and HSiW per Keggin unit are 2.9 and 3.5 molNH3 molHPA−1, respectively.
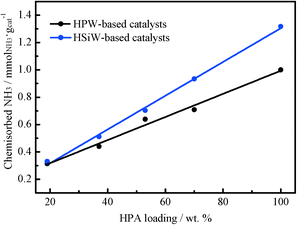 | ||
| Fig. 4 Chemisorbed NH3 determined from the adsorption isotherms recorded at 373 K with HPW- and HSiW-based catalysts. | ||
These values are slightly lower than the expected stoichiometric ones (3 and 4 molNH3 molHPA−1, respectively). It has been reported22 that the adsorption of ammonia in bulk HPAs is limited to the protons located at the surface layers because of their low specific surface area. On the other hand, the TiO2-supported HPAs show higher NH3 uptakes per mole of HPA than that observed for the unsupported HPAs, suggesting a higher accessibility of the NH3 molecules to the protons in the supported HPAs.23 The number of acid sites per mole of HPA increases with the decrease in the HPA loading in the catalyst, reaching the highest value in the series for the catalysts with the lowest HPA loading, 0.9 KU nm−2. This observation in fact suggests that the accessibility of the NH3 molecules to the protons of the HPA increases with the increasing dispersion of the HPA onto the support. The catalysts containing HPW loadings ≤4.5 KU nm−2 and HSiW loadings ≤2.3 KU nm−2 exceed the stoichiometric value of chemisorbed NH3. This trend has been reported previously and ascribed to the formation of [N2H7]+ adducts when the NH3 molecules interact via hydrogen bonds with already existing NH4+ cations.22
The nature of the acid sites in the bulk and supported HPAs has been further investigated by DRIFT spectroscopy using NH3 as a probe molecule. The spectra of adsorbed NH3 at 373 K in the region between 3500 and 500 cm−1 for HPW- and HSiW-based catalysts are shown in Fig. 5. The spectrum of NH3 adsorbed on TiO2 is also shown for comparison.
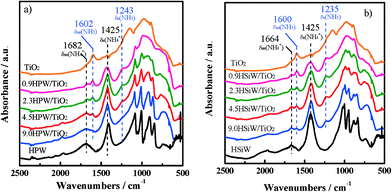 | ||
| Fig. 5 DRIFT spectra of chemisorbed NH3 at 373 K on TiO2 and HPW-based (a) and HSiW-based (b) catalysts. | ||
As observed, the spectrum of TiO2 exhibits intense structural bands between 1200 and 700 cm−1, which overlap with the fingerprint region of the Keggin structure.50 As a consequence, the identification of the vibrations associated with the Keggin anions is not straightforward for the catalysts with HPA loadings <4.5 KU nm−2. All HPA catalysts show a set of bands attributed to the symmetric and asymmetric deformation modes of protonated ammonia on Brønsted acid sites, δs(NH4+) and δas(NH4+), at 1425 and 1682–1664 cm−1, respectively.51–54 These bands, due to protonated ammonia, are not observed in the spectrum of TiO2, suggesting that the Brønsted acid sites are exclusively formed on the catalysts containing heteropoly acids. On the other hand, the spectra of the supported catalysts show bands at 1235–1243 cm−1 and 1600–1602 cm−1, which are ascribed to the symmetric and asymmetric deformation modes of coordinatively adsorbed NH3 on Lewis acid sites, δs(NH3) and δas(NH3), respectively.51–53 Lewis acid sites have been observed previously in TiO2-supported HPW catalysts and assigned to coordinately unsaturated Ti4+ species,55 which agrees with the absence of these bands in the bulk HPW and HSiW spectra. The δs(NH3) band appears at 1151 cm−1 in the spectrum of TiO2. The shifting of the δs(NH3) band to higher wavenumbers in the spectra for HPA/TiO2 may be indicative of an increase of the acid strength of the Lewis acid sites on the supported catalysts.52
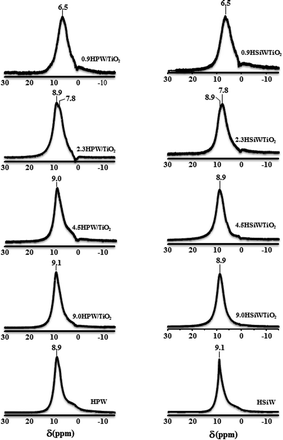
Solid 1H NMR has been used widely to evaluate the nature of the protons in acid solids such as zeolites.56 However, the high mobility of the protons in the Keggin structure prevents establishing unequivocal correlations between the chemical shift of the protons in HPA and their acid strength.57 The 1H NMR spectra of bulk and supported HPAs are shown in Fig. 6. For loadings above 2.3 KU nm−2, a strong peak at ca. 9.0 ppm is observed and assigned to protons in anhydrous heteropoly acids, which are usually referred to as “isolated acidic protons”.42,58 An additional signal can be observed at 7.8 and 6.5 ppm for 2.3HPA/TiO2 and 0.9HPA/TiO2, respectively. It has been reported that protons in SiO2-supported HPW with low HPW loadings are likely to be located on the neighbouring oxygen atoms of the support which are more basic than the outer oxygen atoms of the Keggin anion.34,59,60 The interaction between the HPA protons and the oxygen atoms of the support could be responsible for the shifting to lower chemical shifts of the 1H NMR peaks in the spectra of 0.9HPW/TiO2 and 0.9HSiW/TiO2, indicating that the interaction between HPA and the support is higher in the catalysts with low HPA loadings.
The catalytic performance for the dehydration of methanol to dimethyl ether with all HPW- and HSiW-based catalysts has been tested in a fixed-bed tubular reactor; the conversion values and the methanol conversion rates recorded at different temperatures for HPW- and HSiW-based catalysts, respectively, are shown in Fig. 7a and b. Both the bulk and the supported HPA catalysts under study are very active for the methanol conversion reaction, exhibiting measurable conversion rates even at temperatures as low as 413 K. On the other hand, TiO2 is not active for the methanol dehydration under the studied reaction conditions. As expected, increasing the reaction temperature leads to an increase in the rate of methanol conversion with all catalysts. In all cases, dimethyl ether is the only product detected during the reaction irrespective of the reaction temperature. In line with previous reports, the xHPA/TiO2 catalysts with x ≥2.3 KU nm−2 record higher catalytic activities than bulk HPAs.20,23 On the other hand, the catalytic performance of 0.9HPA/TiO2 is similar to that recorded for the bulk HPAs. In our previous work,23 we show that the higher activity of supported HPAs towards DME production from methanol arises from the higher accessibility of methanol to the active acid sites of the supported HPAs in comparison with the bulk HPAs. This behaviour is due to the weakening of the adsorption strength between water molecules and the acid sites of the Keggin units upon deposition on the support. This weakening results in a more facile replacement of water by methanol molecules, thus leading to higher methanol conversion rates.
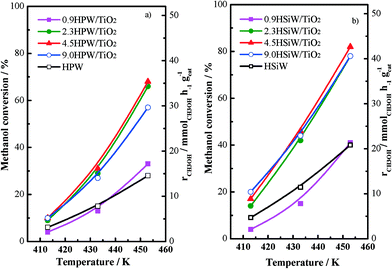 | ||
Fig. 7 Methanol conversion vs. temperature for HPW-based catalysts (a) and HSiW-based catalysts (b) at 1 bar, 16.7 vol.% methanol, space velocity = 14![[thin space (1/6-em)]](https://www.rsc.org/images/entities/char_2009.gif) 400 cm3 h−1 gcat−1. 400 cm3 h−1 gcat−1. | ||
Fig. 7a and b show that the loading of the HPA does not affect the methanol conversion rate per gram of xHPA/TiO2 when x ranges between 2.3 and 9.0 KU nm−2. On the contrary, methanol conversion falls for the catalysts containing 0.9 KU nm−2; in fact, 0.9HSiW/TiO2 exhibits methanol conversion values below those recorded with HSiW. This effect can be explained by taking into account the strong interaction between the acid protons in the 0.9HPA/TiO2 series and the oxygen atoms of the support as observed by 1H NMR (see above), which results in a decreasing number of acid sites available for the methanol dehydration reaction.
The production of dimethyl ether per acid site has been calculated by considering the amount of chemisorbed NH3 as a measurement of the number of acid sites; the values are collected in Table 1. The DME production per acid site increases as the HPA loading increases, reaching a maximum for the catalyst containing 2.3 KU nm−2 (note that this loading is close to the theoretical monolayer's coverage value). On the contrary, DME production decreases progressively with the higher HPA loadings. The existence of an optimum HPA loading, i.e., of a volcano plot for the methanol conversion rate vs. HPA loading, indicates that the HPA loading affects the total number of active sites in two opposite ways. On the one hand, the decreasing activity recorded for xHPA/TiO2, where x ≥ 2.3 KU nm−2, i.e., for the catalysts with HPA loadings slightly above the monolayer's coverage, is a result of the limited accessibility of methanol to the acid sites located within the bulk of the HPA. The fraction of such bulk acid sites increases with the decreasing dispersion of HPA on the support. This effect, i.e., the lower accessibility of bulk acid sites, has been in fact observed during the measurement of the NH3 isotherms. On the other hand, despite the accessibility of methanol to the acid protons present in the xHPA/TiO2, where x < 2.3 KU nm−2 should be high, these acid sites are not accessible for the adsorption (and dehydration) of methanol probably due to the strong interaction between such protons and the oxygen atoms in the support. Therefore, the optimum HPA loading for TiO2-supported HPA catalysts will be that at which the HPA is well dispersed on the support without the formation of 3-dimensional clusters while exhibiting a moderate interaction between the HPA and the support. For both HPW- and HSiW-based catalysts, this loading is at 2.3 KU nm−2.
Conclusions
Supported HPW or HSiW on TiO2 results in very active catalysts for the dehydration of methanol to DME. However, the catalytic performance of the TiO2-supported HPA is strongly influenced by the HPA loading on TiO2. It has been found that for HPA loadings ≤2.3 KU nm−2, the HPA remains well dispersed on TiO2, while for higher loadings, 3-dimensional clusters are formed. At low HPA loadings, an interaction between HPA and support has been observed by the appearance of stronger Lewis acid sites assigned to coordinately unsaturated Ti4+ species and by the shift in the 1H-NMR spectra of the signal assigned to the protons in the HPA. On the other hand, the NH3 adsorption isotherm experiments showed that the higher the HPA dispersion is, the more accessible the protons of the HPA are. Nevertheless, these protons are strongly interacting with the oxygens of the support, which prevent their participation for the methanol dehydration, as observed during the catalytic testing. It has been found that the optimum HPA loading for methanol dehydration reaction is 2.3 KU nm−2 for the two studied heteropoly acids, HPW and HSiW.Acknowledgements
R. Ladera gratefully acknowledges the Regional Government of Madrid (Spain) for a contract (CPI/0173/2008).Notes and references
- T. Mokrani and M. Scurell, Catal. Rev.: Sci. Eng., 2009, 51, 1–145 CAS.
- M. Marchionna, R. Patrini, D. Sanfilippo and G. Migliavacca, Fuel Process. Technol., 2008, 89, 1255–1261 CrossRef CAS PubMed.
- D. A. Wood, C. Nwaoha and B. F. Towler, J. Nat. Gas Sci. Eng., 2012, 9, 196–208 CrossRef CAS PubMed.
- T. H. Fleisch, A. Basu and R. A. Sills, J. Nat. Gas Sci. Eng., 2012, 9, 94–107 CrossRef CAS PubMed.
- G. Thomas, B. Feng, A. Veeraragavan, M. J. Cleary and N. Drinnan, Fuel Process. Technol., 2014, 119, 286–304 CrossRef CAS PubMed.
- C. Panoutsou, A. Bauen and J. Duffield, Biofuels, Bioprod. Biorefin., 2013, 7, 685–701 CrossRef CAS.
- F. Raoof, M. Taghizadeh, A. Eliassi and F. Yaripour, Fuel, 2008, 87, 2967–2971 CrossRef CAS PubMed.
- R. Ahma, D. Schrempp, S. Behrens, J. Sauer, M. Doring and U. Arnold, Fuel Process. Technol., 2014, 121, 38–46 CrossRef PubMed.
- G. Bonura, M. Cordaro, C. Cannilla, A. Mezzapica, L. Spadaro, F. Arena and F. Frusteri, Catal. Today, 2014, 228, 51–57 CrossRef CAS PubMed.
- Y. Tavan, M. R. Khosravi Nikou and A. Shariati, J. Ind. Eng. Chem., 2014, 20, 668–673 CrossRef CAS PubMed.
- S. S. Akarmazyan, P. Panagiotopoulou, A. Kambolis, C. Papadopoulou and D. I. Kondarides, Appl. Catal., B, 2014, 145, 136–148 CrossRef CAS PubMed.
- B. Sabour, M. H. Peyrovi, T. Hamoule and M. Rashidzadeh, J. Ind. Eng. Chem., 2014, 20, 222–227 CrossRef CAS PubMed.
- Y. Sang, H. Li, M. Zhu, K. Ma, Q. Jiao and Q. Wu, J. Porous Mater., 2013, 20, 1509–1518 CrossRef CAS.
- R. Ladera, E. Finocchio, S. Rojas, G. Busca, J. L. G. Fierro and M. Ojeda, Fuel, 2013, 113, 1–9 CrossRef CAS PubMed.
- R. Ladera, E. Finocchio, S. Rojas, J. L. G. Fierro and M. Ojeda, Catal. Today, 2012, 192, 136–143 CrossRef CAS PubMed.
- K. Lertjiamratn, P. Praserthdam, M. Arai and J. Panpranot, Appl. Catal., A, 2010, 378, 119–123 CrossRef CAS PubMed.
- V. Vishwanathan, H. S. Roh, J. W. Kim and K. W. Jun, Catal. Lett., 2004, 96, 23–28 CrossRef CAS.
- K. C. Tokay, T. Dogu and G. Dogu, Chem. Eng. J., 2012, 184, 278–285 CrossRef CAS PubMed.
- D. Varisli, T. Dogu and G. Dogu, Chem. Eng. Sci., 2007, 62, 5349–5352 CrossRef CAS PubMed.
- D. Varisli, C. K. Tokay, A. Ciftci, T. Dogu and G. Dogu, Turk. J. Chem., 2009, 33, 355–366 CAS.
- R. T. Carr, M. Neurock and E. Iglesia, J. Catal., 2011, 278, 78–93 CrossRef CAS PubMed.
- L. Matachowski, A. Drelinkiewicz, E. Lalik, M. Ruggiero-Mikolajczyk, D. Mucha and J. Krysciak-Czerwenka, Appl. Catal., A, 2014, 469, 290–299 CrossRef CAS PubMed.
- R. M. Ladera, J. L. G. Fierro, M. Ojeda and S. Rojas, J. Catal., 2014, 312, 195–203 CrossRef CAS PubMed.
- D. Varisli, T. Dogu and G. Dogu, Ind. Eng. Chem. Res., 2008, 47, 4071–4076 CrossRef CAS.
- A. Ciftci, D. Varisli, C. K. Tokay, N. A. Sezgi and T. Dogu, Chem. Eng. J., 2012, 207–208, 85–93 CrossRef CAS PubMed.
- A. Bielański and A. Micek-Ilnicka, Inorg. Chim. Acta, 2010, 363, 4158–4162 CrossRef PubMed.
- I. V. Kozhevnikov, Chem. Rev., 1998, 98, 171–198 CrossRef CAS PubMed.
- N. Mizuno and M. Misono, Chem. Rev., 1998, 98, 199–217 CrossRef CAS PubMed.
- I. V. Kozhevnikov, J. Mol. Catal. A: Chem., 2007, 262, 86–92 CrossRef CAS PubMed.
- A. Micek-Ilnicka, E. Bielanska, L. Litynska-Dobrzynska and A. Bielanski, Appl. Catal., A, 2012, 421–422, 91–98 CrossRef CAS PubMed.
- L. R. Pizzio, P. G. Vázquez, C. V. Cáceres and M. N. Blanco, Appl. Catal., A, 2003, 256, 125–139 CrossRef CAS.
- S. Zhu, Y. Zhu, X. Gao, T. Mo, Y. Zhu and Y. S. Li, Bioresour. Technol., 2013, 130, 45–51 CrossRef CAS PubMed.
- A. M. Alsalme, P. V. Wiper, Y. Z. Khimyak, E. F. Kozhevnikova and I. V. Kozhevnikov, J. Catal., 2010, 276, 181–189 CrossRef CAS PubMed.
- G. C. Bond, S. J. Frodsham, P. Jubb, E. F. Kozhevnikova and I. V. Kozhevnikov, J. Catal., 2012, 293, 158–164 CrossRef CAS PubMed.
- K. Okumura, K. Yamashita, K. Yamada and M. Niwa, J. Catal., 2007, 245, 75–83 CrossRef CAS PubMed.
- P. Madhusudhan Rao, A. Wolfson, S. Kababya, S. Vega and M. V. Landau, J. Catal., 2005, 232, 210–225 CrossRef PubMed.
- L. Marosi, E. Escalona Platero, J. Cifre and C. Otero Areán, J. Mater. Chem., 2000, 10, 1949–1955 RSC.
- F. J. Berry, G. R. Derrick and M. Mortimer, Polyhedron, 2014, 68, 17–22 CrossRef CAS PubMed.
- R. Thouvenot, M. Fournier, R. Franck and C. Rocchiccioli-Deltcheff, Inorg. Chem., 1984, 23, 598–605 CrossRef CAS.
- S. R. Matkovic, L. E. Briand and M. A. Bañares, Mater. Res. Bull., 2011, 46, 1946–1948 CrossRef CAS PubMed.
- L. Nakka, E. Molinari and I. E. Wachs, J. Am. Chem. Soc., 2009, 131, 15544–15554 CrossRef CAS PubMed.
- N. Legagneux, J. M. Basset, A. Thomas, F. Lefebvre, A. Goguet, J. Sa and C. Hardacre, Dalton Trans., 2009, 2235–2240 RSC.
- P. A. Jalil, M. Faiz, N. Tabet, N. M. Hamdan and Z. Hussain, J. Catal., 2003, 217, 292–297 CAS.
- R. Dziembaj, A. Malecka, Z. Piwowarska and A. Bielanski, J. Mol. Catal. A: Chem., 1996, 112, 423–430 CrossRef CAS.
- I. V. Kozhevnikov, J. Mol. Catal. A: Chem., 2009, 305, 104–111 CrossRef CAS PubMed.
- L. R. Pizzio and M. N. Blanco, Microporous Mesoporous Mater., 2007, 103, 40–47 CrossRef CAS PubMed.
- K. Y. Lee, N. Mizuno, T. Okuhara and M. Misono, Bull. Chem. Soc. Jpn., 1989, 62, 1731–1739 CrossRef CAS.
- Y. Kamiya, Y. Ooka, C. Obara, R. Ohnishi, T. Fujita, Y. Kurata, K. Tsuji, T. Nakajyo and T. Okuhara, J. Mol. Catal. A: Chem., 2007, 262, 77–85 CrossRef CAS PubMed.
- Y. Kamiya, T. Okuhara, M. Misono, A. Miyaji, K. Tsuji and T. Nakajyo, Catal. Surv. Asia, 2008, 12, 101–113 CrossRef CAS.
- E. Caliman, J. A. Dias, S. C. L. Dias and A. G. S. Prado, Catal. Today, 2005, 107–108, 816–825 CrossRef CAS PubMed.
- G. Busca, Catal. Today, 1998, 41, 191–206 CrossRef CAS.
- A. Gutiérrez-Alejandre, P. Castillo, J. Ramírez, G. Ramis and G. Busca, Appl. Catal., A, 2001, 216, 181–194 CrossRef.
- M. Tamura, K. Shimizu and A. Satsuma, Appl. Catal., A, 2012, 433–434, 135–145 CrossRef CAS PubMed.
- S. M. Jung and P. Grange, Appl. Catal., B, 2002, 36, 325–332 CrossRef CAS.
- S. M. Kumbar and S. B. Halligudi, Catal. Commun., 2007, 8, 800–806 CrossRef CAS PubMed.
- H. Pfeifer, D. Freude and M. Hunger, Zeolites, 1985, 5, 274–286 CrossRef CAS.
- T. Baba and Y. Ono, Appl. Catal., A, 1999, 181, 227–238 CrossRef CAS.
- S. Uchida, K. Inumari and M. Misono, J. Phys. Chem. B, 2000, 104, 8108–8115 CrossRef CAS.
- V. M. Mastikhin, S. M. Kulikov, A. V. Nosov, I. V. Kozhevnikov, I. L. Mudrakovsky and M. N. Timofeeva, J. Mol. Catal., 1990, 60, 65–70 CrossRef CAS.
- V. M. Mastikhin, V. V. Terskikh, M. N. Timofeeva and O. P. Krivoruchko, J. Mol. Catal. A: Chem., 1995, 95, 135–140 CrossRef CAS.
Footnote |
| † Electronic supplementary information (ESI) available: XPS, ATG and NH3 isotherms. See DOI: 10.1039/c4cy00998c |
| This journal is © The Royal Society of Chemistry 2015 |


