DOI:
10.1039/C5RA01628B
(Paper)
RSC Adv., 2015,
5, 25462-25470
Fabrication of hydroxyapatite/chitosan porous materials for Pb(II) removal from aqueous solution
Received
27th January 2015
, Accepted 4th March 2015
First published on 4th March 2015
Abstract
Lead is one of the common heavy metal contaminants that pose a significant threat to human health. Herein, a freeze-drying method has been used to fabricate hydroxyapatite/chitosan (HAP/CS) porous materials for the removal of Pb(II) ions from aqueous solutions. The HAP/CS porous materials possessed interconnected three-dimensional macropores with pore sizes of 100–300 μm. Low-crystallinity HAP particles were dispersed uniformly among the porous materials. Adsorption experiments for Pb(II) ions were conducted under flow conditions. The adsorption capacity of the HAP/CS porous material was found to be 264.42 mg g−1, while that of the CS porous material was only 5.67 mg g−1. The better adsorption property of the HAP/CS porous material than the CS porous material was attributed to the presence of HAP particles in the composite material. During the adsorption process, the HAP particles were converted to rod-like lead hydroxyapatite (PbHAP, Pb10(PO4)6(OH)2) particles via a dissolution–precipitation reaction. Adsorption kinetic studies revealed that the adsorption of Pb(II) ions on the HAP/CS porous material exhibited a good fit to the pseudo-second-order kinetic model. Therefore, the HAP/CS porous materials possess a great potential for the removal of Pb(II) ions from aqueous solutions.
1. Introduction
Water pollution produced by heavy metals has received extensive attention because of the intrinsically persistent nature of heavy metals and their toxic effects even at very low concentrations.1 Lead, a toxic heavy metal, is widely produced in industries such as production of storage batteries, manufacturing, printing pigments, fuels, photographic materials, metal plating, explosive manufacturing, mining, painting, car manufacturing, and smelters.2 Notably, lead ions not only interfere with the metabolism of human bodies, but also indirectly damage the central nervous system, inhibit DNA repair, and cause cognitive deficits.3,4 In industrial wastewaters, the concentration of Pb(II) ions reaches 200–500 mg L−1; thus, it must be reduced to a low level that is not hazardous to human beings.5,6
Various techniques such as ion exchange, reverse osmosis, membrane filtration, phytoextraction, conventional coagulation, precipitation and electrochemical treatment have been developed to remove heavy metal ions from aqueous solutions.7–14 However, the above methods are not widely used in industrial applications due to their high cost, especially for the removal of heavy metals with low concentrations. Fortunately, adsorptive separation is considered as an effective and economic method to remove heavy metals. The adsorption process offers flexible operation and generally yields high-quality treated effluents.15–19
Common adsorbents for the removal of Pb(II) ions include sawdust, magnetic mesoporous materials, chitosan (CS), carbon nanotubes, sludge-derived biochar, graphene oxide and hydroxyapatite (Ca10(PO4)6(OH)2, HAP).20–28 Notably, ideal adsorbents should not only possess nontoxicity to the environment but also have good sorption capacity for heavy metal ions. Apatite is the major inorganic constituent of natural bones, and the corresponding synthetic HAP exhibits environmentally friendly characteristics. In the last decades, HAP has been widely used as an effective absorbent in the long-term disposal of heavy metals because of its high sorption capacity, low water solubility, and low cost.29 The Ca2+ ion in the HAP crystal lattice can be substituted by other metallic cations (Cu2+, Cr3+, Ni2+, Pb2+, Hg2+, Fe3+, etc.) by an ion exchange reaction.7,30 The capturing efficiency of HAP not only depends on the ion concentration, ion nature, temperature, and pH value in wastewater,31 but also is ascribed to the porous structure and crystallinity of HAP. Porous HAP provides a large surface area for the adsorption of heavy metal ions and accelerates the rates of ion exchange via porous channels. In addition, HAP with low crystallinity possesses a large amount of lattice defects and high degradability; thus, the calcium ions in HAP are easily replaced by other metal ions. In addition, CS, produced by alkaline deacetylation of chitin, has been widely used as adsorbents for the removal of heavy metal ions such as copper, lead, mercury, cadmium and chromium.23,24 The amine groups in CS have strong affinity to and can form complexes with various heavy metal ions.24 Since both HAP and CS have good adsorption property to remove heavy metal ions, HAP/CS composites have been prepared.32,33 However, the difficulty in separating the HAP/CS composite particles from wastewater limits their industrial application.
In this work, we report the freeze-drying synthesis of HAP/CS porous materials for the treatment of Pb(II) ions in aqueous solution. The freeze-drying technology is an inexpensive and versatile method for the preparation of porous materials.34–36 The HAP/CS porous materials possess the following advantages: first, both HAP and CS are environmentally friendly materials that do not produce toxic effects to human beings; second, the HAP/CS porous materials can effectively remove the heavy metal ions from wastewater; third, if the porous composite materials serve as adsorbents, the separation process of heavy metal ions from wastewater is easy and low-cost, even under flow conditions, and finally, the HAP/CS porous materials after the adsorption of heavy metals can be regenerated via an ion exchange reaction by the replace of heavy metal ions by Ca2+ ions in the calcium ion solutions with high concentrations. The main aims of this work are to fabricate HAP/CS porous materials, investigate their morphologies, structures, and formation mechanisms, and study their Pb(II) adsorption properties and corresponding adsorption kinetics.
2. Experimental
2.1. Materials and reagents
Chitosan (90% de-acetylated form), ammonium dihydrogen phosphate, ammonia, and lead nitrate were purchased from Shanghai Richjoint Chemical Reagent Co., Ltd. (Shanghai, China). Calcium chloride was purchased from Sinopharm Chemical Reagent Co., Ltd. (Shanghai, China). All of the chemical reagents were of analytical grade. Deionized water was used throughout the experiments.
2.2. Preparation of HAP/CS porous materials
HAP particles were prepared according to the following procedures. CaCl2 (0.5 M) and (NH4)2HPO4 (0.3 M) were each diluted with 250 mL of deionized water. The (NH4)2HPO4 solution was added dropwise into the CaCl2 solution for 30 min at 40 °C. The mixture was stirred for 1 h and subsequently aged for 12 h at 40 °C. During the precipitation process, the pH value of the mixed solution was kept at 10.0 by the addition of ammonia. Finally, the product (HAP) was filtered off, washed with distilled water, and dried at 60 °C for 2 days.
A homogeneous CS solution (3.85 wt%, 25 mL) was prepared by the addition of CS powder into acetic acid solution (2.0 vol%). HAP powder (3.47 g) was added into the CS solution under agitation until uniform dispersion. The mixture was added into each well of the 24-well tissue culture plate and cooled at −20 °C in a freezer for 5 h. The samples were rapidly transferred to a freeze-drying machine to deep freeze at −35 to −40 °C. The solidified mixtures were subsequently freeze-dried for 36 h. After the freeze-drying process, the products (HAP/CS porous materials) were treated with NaOH solution (50 mL, 10.0 wt%), washed with deionized water, and dried under vacuum. CS porous materials were prepared under the same conditions without the addition of HAP powder and were used as controls.
2.3. Characterization
The morphologies of the samples were investigated by scanning electron microscopy (SEM; JEOL, JSM-6380LV). The crystalline phases of samples were examined by X-ray powder diffraction (XRD; D/max-III C) using Cu-Ka radiation. The data of 2θ values were collected from 10 to 80° with a step size of 0.02°. Fourier transform infrared spectra (FTIR; Nicolet 5DX) were collected at room temperature by the KBr pellet technique working in the range of wavenumbers of 4000–400 cm−1 at a resolution of 2 cm−1 (number of scans ∼60).
2.4. Adsorption experiment for Pb(II) ions
A Pb(II) aqueous solution (400 mg L−1) was prepared by the dissolution of Pb(NO3)2 powder in deionized water. The pH value was adjusted to 5.5 by an HNO3 (0.1 M) or NaOH (0.1 M) solution. The HAP/CS porous material (0.5 g) and CS porous material (0.5 g) were cut into a cylinder (Φ 12 mm), respectively. The above samples were put into the sample tube, which was connected to a peristaltic pump. The Pb(II) solution was flowed through the porous materials at a flow rate of 0.8 mL min−1. At the given time intervals, the concentrations of Pb(II) ions in the solution were determined by inductively coupled plasma/optical emission spectrometry (ICP/OES; Perkin Elmer, OPTIMA 3300 DV). All of the experimental data were averages of duplicate determinations, and the relative errors were approximately 5%. The adsorption amounts of Pb(II) ions on the porous materials were calculated according to the following equation:| |
 | (1) |
where q is the amount adsorbed on the porous material (mg g−1), C0 is the concentration of Pb(II) ions in the initial solution (mg L−1), Ct is the concentration of Pb(II) ions after time t (mg L−1), V is the volume of outflow solution (L), and m is the weight of the porous material (g).
3. Results and discussion
3.1. Morphologies of HAP/CS porous materials
In this work, HAP/CS porous materials were fabricated by a freeze-drying method according to the following steps: (i) HAP and CS powders were dispersed in an acetic acid solution, (ii) the mixed solutions were frozen at −20 °C, and (iii) HAP/CS porous materials were formed after drying at −35 to −40 °C. CS porous materials were fabricated under the same conditions but without the addition of HAP nanoparticles. The morphologies of the CS and HAP/CS porous materials are shown in Fig. 1. The low-resolution SEM images indicated that both the CS and HAP/CS porous materials possessed three-dimensional interconnected porous structures (Fig. 1a and c). The macropores with pore sizes of 100–400 nm were produced using ice crystals as sacrificial templates. Nakao et al. have demonstrated that the pore size is determined from the size of the ice-crystal produced in the solidification process during cooling and is hardly affected by the vaporization process of the ice-crystal after freezing.37 The high-resolution SEM images in Fig. 1b revealed that the films in the CS porous material had smooth and dense surfaces. For the HAP/CS porous material, many HAP nanoparticles with particle sizes of ∼20 nm existed on and within the films (Fig. 1c and d). These HAP nanoparticles aggregated together via hydrogen bonding interactions. Moreover, the presence of HAP nanoparticles resulted in a greater film thickness in the HAP/CS porous materials than in the CS porous materials (Fig. 1).
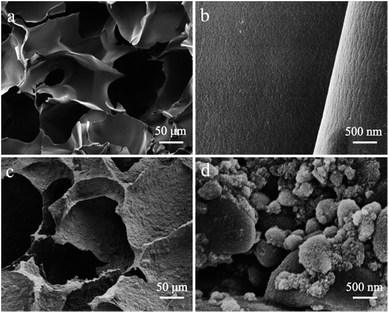 |
| | Fig. 1 SEM images of CS porous materials: (a) low-resolution image and (b) high-resolution image; SEM images of HAP/CS porous materials: (c) low-resolution image and (d) high-resolution image. | |
3.2. Structures of HAP/CS porous materials
The phase and structure of the HAP/CS porous material were investigated by XRD patterns and FTIR spectra, with the CS porous material serving as the control. CS is obtained from the partially de-acetylated derivative of chitin, which is found in crustacean shells, insects, and fungal cell walls.38 The XRD pattern of the CS porous material showed the characteristic peaks of CS at approximately 20° and 28°, suggesting that it was a semi-crystalline material (Fig. 2a). As we know, CS consists of β-(1,4)-2-acetamido-2-β-D-glucose and β-(1,4)-2-amido-2-β-D-glucose units. The functional groups of the CS porous material were detected by FTIR spectrum (Fig. 3a). The N–H stretching vibration occurred in the 3455–3173 cm−1 region, which overlapped the OH stretch from the carbohydrate ring. The bands at 2925 and 2870 cm−1 corresponded to the C–H stretching vibration in the –CH2 groups.39 The 1625–1657 cm−1 region was assigned to the amide I. In addition, the bands at 1625–1658 cm−1, 1405 cm−1, and 1087 cm−1 were ascribed to the C![[double bond, length as m-dash]](https://www.rsc.org/images/entities/char_e001.gif) O stretching vibration, C–H deformation vibration, and C–O stretching vibration, respectively.40
O stretching vibration, C–H deformation vibration, and C–O stretching vibration, respectively.40
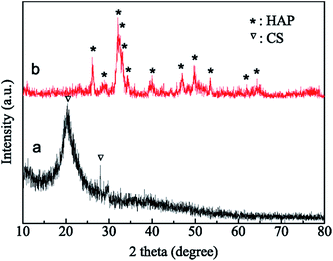 |
| | Fig. 2 XRD patterns of samples: (a) CS porous materials and (b) HAP/CS porous materials. | |
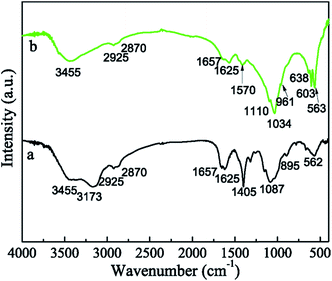 |
| | Fig. 3 FTIR spectra of samples: (a) CS porous materials and (b) HAP/CS porous materials. | |
The HAP/CS porous material was composed of 77.6 wt% HAP and 22.4 wt% CS. The characteristic HAP peaks were observed in the XRD pattern of the HAP/CS porous material (Fig. 2b). However, no characteristic CS peaks were detected, which was attributed to the following three reasons: first, CS is a semi-crystalline material, and its peak strength is thus lower than HAP; second, the percentage of CS in the HAP/CS porous material was lower than that of HAP; and finally, the presence of HAP might weaken the intermolecular interactions among the CS chains, reducing the crystallinity of CS. Interestingly, the characteristic bands of both CS and HAP were detected in the FTIR spectrum (Fig. 3b). The intense adsorption peak at 1034 cm−1 was ascribed to the stretching vibration (v3) of the phosphate (PO43−) groups, and the adsorption peaks at 563 cm−1 and 604 cm−1 were ascribed to the bending vibration (v4) of the phosphate (PO43−) groups.41 The adsorption band due to HPO42− at approximately 1110 cm−1 indicated that the samples were calcium-deficient HAP.42 Hydroxyl adsorption bands due to HAP were detected at 638 cm−1.43 Moreover, the characteristic peaks due to CS were observed in Fig. 3b, although some peaks were overlapped by those of HAP.
3.3. Morphologies and structures of HAP/CS porous materials after the adsorption of Pb(II) ions
Both HAP and CS are environmentally friendly materials with the ability to adsorb heavy metal ions. The morphologies and phases of the CS and HAP/CS porous material after the adsorption of Pb(II) ions were characterized by SEM images and XRD patterns. Fig. 1a indicated that the films in the CS porous material had smooth surfaces. Interestingly, many particles with particle sizes of approximately 10 μm were observed after the adsorption of Pb(II) ions (Fig. 4a). These particles may be CS–Pb complexes, as confirmed by the element distribution image (Fig. 4d) and XRD pattern (Fig. 5b). Pb was mainly distributed around the above particles, while C was distributed throughout the CS porous material (Fig. 4b–d).
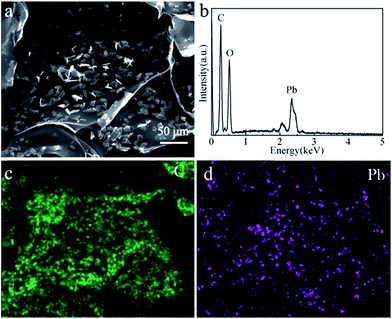 |
| | Fig. 4 (a) SEM image of CS porous materials after adsorption of Pb(ii) ions; (b) EDS spectrum; (c) C element distribution image; and (d) Pb element distribution image. | |
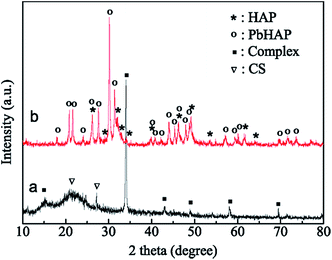 |
| | Fig. 5 XRD patterns of samples after adsorption of Pb(ii) ions: (a) CS porous materials and (b) HAP/CS porous materials. | |
Previous reports have demonstrated that the Ca2+ ions in HAP crystal lattices can be substituted by other metal cations (Cu2+, Cr3+, Ni2+, Pb2+, Hg2+, Fe3+, etc.) by ion exchange reactions. In this study, we found that the HAP/CS porous material possessed different morphologies and phases before and after the adsorption of Pb(II) ions (Fig. 4b and 5b). After adsorbing Pb(II) ions for 7 days, many nanorods deposited on the porous material (Fig. 5b). These nanorods had different particle sizes at different locations. Fig. 1c and d indicated that HAP nanoparticles were not dispersed uniformly among the HAP/CS porous material. Some HAP nanoparticles aggregated on the surface, while others were covered with CS. Generally, the nanorods had small sizes in locations enriched with HAP, while the nanorods had large sizes in locations enriched in CS (Fig. 6a–d). These nanorods were PbHAP, as confirmed by XRD pattern. The characteristic peaks of both HAP and PbHAP were detected in Fig. 5b after the HAP/CS porous material adsorbed Pb(II) ions for 7 days. The peak strength of PbHAP was stronger than that of HAP, suggesting that most of the HAP particles were converted to PbHAP. Elemental Pb was dispersed throughout the porous material (Fig. 6d). The EDS spectrum in Fig. 6e revealed that the chemical elements of the porous material included C, O, P, Pb and Ca. C was derived from CS, Pb was derived from PbHAP, Ca was derived from HAP, P was derived from PbHAP and HAP, and O was derived from CS, HAP, and PbHAP.
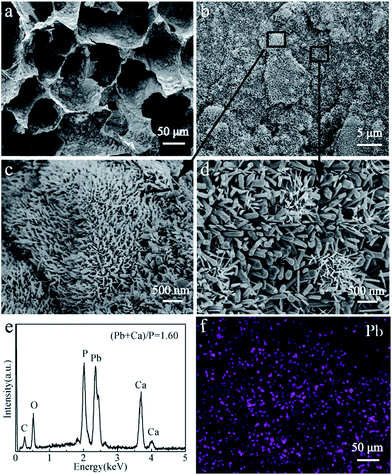 |
| | Fig. 6 SEM images of CS/HAP porous materials after adsorption of Pb(ii) ions: (a and b) low-resolution image; (c and d) high-resolution image; (e) EDS spectrum; (f) Pb element distribution image. | |
3.4. Pb(II) adsorption properties of HAP/CS porous materials
The Pb(II) adsorption performances of the HAP/CS and CS porous materials were investigated by the flow of Pb(II) aqueous solutions through the adsorbents at 25 °C. The flow rate was controlled at 0.8 mL min−1. The concentration and pH of the Pb(II) aqueous solutions were 400 mg L−1 and 5.5, respectively. Fig. 7a indicates the adsorbed amounts of Pb(II) ions on the CS and HAP/CS porous materials at different times. The adsorbed amount of Pb(II) ions on the CS porous material increased during the first 8 h and then reached adsorption equilibrium with further increases in time (Fig. 7a, inset). The CS porous material possessed a maximum adsorption amount of 5.67 mg g−1. Interestingly, the adsorbed amount of Pb(II) ions on the HAP/CS porous material was greater than that on the CS porous material at different time (Fig. 7a). The adsorbed amount of Pb(II) on the HAP/CS porous material increased with time, reaching a maximum of 264.42 mg g−1 after 7 days.
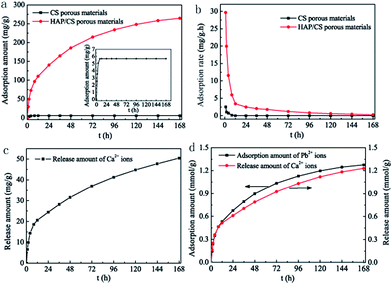 |
| | Fig. 7 (a) Adsorbed amounts of Pb(II) ions on CS and HAP/CS porous materials at different times; (b) adsorption rates of Pb(II) ions on CS and HAP/CS porous materials at different times; (c) released amounts of Ca2+ ions from the HAP/CS porous material at different times; (d) comparison of adsorbed amounts of Pb(II) ions on the HAP/CS porous material and the corresponding released amounts of Ca2+ ions at different times. The inset in (a) shows the enlarged adsorption curve of the CS porous material. | |
The Pb(II) adsorption rates on the CS and HAP/CS porous materials are shown in Fig. 7b. The adsorption rates on both samples decreased with increasing time. Unfortunately, the CS porous material had an indistinctive adsorption property for Pb(II) ions, and the adsorption rate reduced to 0 after 8 h. Wan et al. have studied the adsorption of copper(II) and lead(II) ions from aqueous solution on Cs-coated sand. The maximum adsorption capacity of Cu(II) and Pb(II) ions were only 8.18 and 12.32 mg g−1, respectively.44 For the HAP/CS porous material, the adsorption rate of Pb(II) ions decreased rapidly during the first 24 h and then decreased slowly upon increasing further the time further (Fig. 7b). Notably, the cumulative adsorbed amount of Pb(II) ions on the HAP/CS porous material had a similar trend as the cumulative released amount of Ca2+ ions (Fig. 7a and c). In particular, the molar amount of Ca2+ ions released from the HAP/CS porous material was equal to the molar amount of adsorbed Pb(II) ions before 24 h, and the former was lower than the latter with further increases in time (Fig. 7d and Table 1).
Table 1 The comparison of adsorbed amounts of Pb(II) ions on the HAP/CS porous material and the corresponding released amounts of Ca2+ ions at different times
| Time h |
mPb mmol g−1 |
mCa mmol g−1 |
Δm = mPb − mCa mmol g−1 |
| 1 |
0.1430 |
0.1542 |
−0.0112 |
| 2 |
0.2394 |
0.2481 |
−0.0087 |
| 4 |
0.3511 |
0.3599 |
−0.0088 |
| 8 |
0.4660 |
0.4636 |
0.0024 |
| 12 |
0.5322 |
0.5147 |
0.0175 |
| 24 |
0.6764 |
0.6104 |
0.0660 |
| 36 |
0.7939 |
0.7043 |
0.0896 |
| 48 |
0.8968 |
0.7882 |
0.1086 |
| 72 |
1.0350 |
0.9245 |
0.1105 |
| 96 |
1.1289 |
1.0313 |
0.0976 |
| 120 |
1.1973 |
1.1190 |
0.0786 |
| 144 |
1.2462 |
1.1832 |
0.0630 |
| 168 |
1.2762 |
1.2205 |
0.0557 |
Table 2 shows the maximum sorption capacity of different CS or HAP based materials used for the removal of Pb(II) ions under different experimental conditions.23,44–53 It was seem that the maximum Pb(II) sorption capacity of the HAP/CS porous material is greater than most of other CS or HPA based materials. Although the maximum Pb(II) sorption capacity of the HAP/CS porous material is less than HAP–alginate composite adsorbents, it has great advantage in the effective separation of adsorbents from wastewater under flow conditions.
Table 2 Maximum Pb(II) sorption capacity of different CS or HAP based materials
| Adsorbent |
C0 (mg L−1) |
qmax (mg g−1) |
pH |
Ref. |
| HAP/CS porous materials |
400 |
264.42 |
5.5 |
This article |
| CS bead |
50 |
79.2 |
5.5 |
23 |
| CS-coated sand |
100 |
12.32 |
4.5 |
44 |
| Polyaniline grafted CS |
1000 |
16.07 |
6 |
45 |
| CS coated cotton fiber |
2072 |
101.53 |
6.5 |
46 |
| CS cross linked with epichlorohydrin-triphosphate |
50 |
29.88 |
5 |
47 |
| Nano-HPA |
414 |
242.4 |
5.5 |
48 |
| HAP–alginate composite adsorbents |
900 |
270.3 |
5 |
49 |
| Carbonate HAP extracted from eggshell |
200 |
101 |
6 |
50 |
| HAP nanosheet-assembled microspheres |
100 |
144.6 |
5.5 |
51 |
| HAP–polyacrylamide composite hydrogels |
275 |
209 |
5 |
52 |
3.5. Adsorption mechanism of lead ions on the HAP/CS porous material
Compared with the CS porous material, the HAP/CS porous material possessed excellent adsorption properties for Pb(II) ions (Fig. 7). The adsorption mechanism of Pb(II) ions on the HAP/CS porous material is illustrated in Fig. 8. The HAP/CS porous material exhibited interconnected three-dimensional macropores with pore sizes of 100–400 μm (Fig. 1c). The HAP nanoparticles were dispersed within or on the porous material (Fig. 8a). After the Pb(II) aqueous solution flowed through the HAP/CS porous material by using the macropores as channels, rod-like PbHAP nanoparticles were deposited on the porous material. The remarkable changes in the morphology and phase of the HAP/CS porous material before and after the adsorption of Pb(II) ions suggested that the HAP nanoparticles were converted into PbHAP via a dissolution–precipitation reaction (Fig. 1–6). First, the dissolution reaction of HAP nanoparticles occurred according to the following reaction (Fig. 8b):| | |
Ca10(PO4)6(OH)2 → 10Ca2+ + 6PO43− + 2OH−
| (2) |
The PO43− ions and OH− ions from the HAP nanoparticles tended to increase the local ion concentrations around the crystals. Second, after the activity product exceeded its thermodynamic solubility product, the PbHAP nanocrystals deposited in situ on the porous material using HAP and CS as active sites (Fig. 8c):| | |
10Pb2+ + 6PO43− + 2OH− → Pb10(PO4)6(OH)2
| (3) |
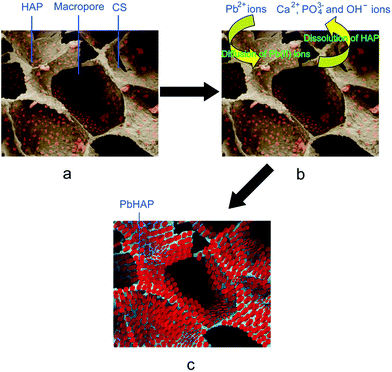 |
| | Fig. 8 Illustration of Pb(II) adsorption on the HAP/CS porous material: (a) the microstructure of the HAP/CS porous material; (b) the flow of Pb(II) aqueous solution through the HAP/CS porous material; and (c) the formation of PbHAP on the porous material. | |
Notably, the PbHAP nanorods possessed different particle sizes at different sites (Fig. 6b–d). Some rods had small sizes of approximately 20 nm, while others had large sizes of approximately 100 nm. The different sizes of the as-formed PbHAP particles were ascribed to the different distributions of the HAP nanoparticles in the HAP/CS porous material. Fig. 1d revealed that the percentage of HAP nanoparticles in the HAP/CS porous material was uneven, and some particles aggregated together via hydrogen bonding interactions. At local sites with high percentages of HAPs before the adsorption of Pb(II) ions, the as-formed PbHAP rods exhibited small particle sizes. In contrast, at local sites with low percentages of HAPs, the as-formed PbHAP rods had large particle sizes. The different particle sizes of the PbHAP rods could be attributed to the following reasons. Generally, the formation process of PbHAP can be divided into two stages: nucleus formation and nucleus growth. The velocity of nucleus formation is proportional to relative supersaturation, while the velocity of nucleus growth is proportional to absolute supersaturation.53,54 Because the solubility of PbHAP was small, the absolute saturation had a greater effect on the velocity of nucleus formation than on the velocity of nucleus growth. At the initial stage, many PO43− and OH− ions were released from the HAP particles (eqn (2)). The large absolute saturation resulted in a greater velocity of nucleus formation compared with nucleus growth, resulting in the formation of many PbHAP nanocrystals (eqn (3)). With increasing time, the HAP nanoparticles were partly consumed, especially at the local sites with low percentages of HAP in the porous material. The low concentrations of PO43− and OH− ions resulted in a greater velocity of nucleus growth compared with nucleus formation; thus, the as-formed PbHAP nanocrystals began to grow at the expense of forming new nanocrystal nuclei (Fig. 6d). At the local sites with high percentages of HAP nanoparticles in the porous material, many PO43− and OH− ions were still released from the remaining HAP, and many PbHAP nuclei were thus formed (Fig. 6c).
The excellent adsorption property of Pb(II) ions on the HAP/CS porous material was attributed to the chemical conversion of HAP to PbHAP. The curves in Fig. 7d further confirmed the above rationalization. The molar amount of Ca2+ ions released from the HAP/CS porous material was similar to the molar amount of adsorbed Pb(II) ions, especially before 24 h (Fig. 7d). With increasing adsorption time, the adsorption rate of Pb(II) ions began to decrease because of the consumption of HAP nanoparticles. After the adsorption of Pb(II) ions for 24 h, the molar amount of adsorbed Pb(II) ions was greater than the molar amount of Ca2+ ions released from the HAP/CS porous material. The above results indicated that the physical adsorption of the porous material and the chemical adsorption of CS played important roles in the removal of Pb(II) ions.
3.6. Adsorption kinetics
Sorption kinetics in the removal of heavy metal ions is significant because it provides necessary information about the reaction pathway and sorption mechanism. Several models have been used to express the mechanism of solute sorption onto a sorbent. In the present work, the adsorption performance of Pb(II) ions on the CS and HAP/CS porous materials were investigated using Lagergren's pseudo-first-order kinetic model and the chemisorption pseudo-second-order kinetic model.50,55–57
(1) Pseudo-first-order kinetic model. To investigate the mechanism of sorption, the characteristic constants of sorption were determined using Lagergren's pseudo-first-order kinetic model based on adsorption capacity.55 The pseudo-first-order rate expression was represented in the following form:| |
 | (4) |
Moreover, the pseudo-first-order kinetic model could be expressed in a non-linear form:
| |
ln(qe − qt) = ln![[thin space (1/6-em)]](https://www.rsc.org/images/entities/char_2009.gif) qe − k1t qe − k1t
| (5) |
where
qt is the adsorbed amount of Pb(
II) ions (mg g
−1) on the porous material at time
t (h),
qe is the adsorption amount of Pb(
II) ions at equilibrium conditions (mg g
−1), and
k1 is the rate constant (h
−1). The plot of
qt versus t for the pseudo-first-order kinetic model showed a non-linear relationship.
Fig. 9 shows the pseudo-first-order kinetic model fit for the adsorption of Pb(
II) ions on the CS and HAP/CS porous materials. The constants
k1 and
qe were calculated by non-linear curve fitting (
Table 3). The theoretical equilibrium adsorbed amounts of Pb(
II) on the CS and HAP/CS porous materials were 5.69 and 244.75 mg g
−1, respectively.
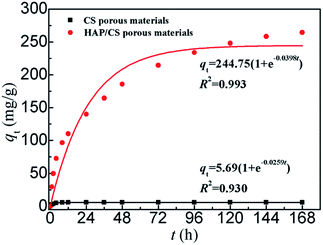 |
| | Fig. 9 Pseudo-first-order kinetic model plot for the adsorption of Pb(II) ions on the CS and HAP/CS porous materials. | |
Table 3 Pseudo-first-order and pseudo-second-order kinetic data for the adsorption of Pb(II) ions on CS porous materials (Sample 1) and HAP/CS porous materials (Sample 2)
| Samples |
Experimental values qe,exp (mg g−1) |
Pseudo-first-order kinetics model |
Pseudo-second-order kinetics model |
| qe,theo (mg g−1) |
k1 (h−1) |
R2 |
qe,theo (mg g−1) |
k2 (g mg−1 h−1) |
R2 |
hi (mg g−1 h−1) |
| Sample 1 |
5.67 |
5.69 |
0.0259 |
0.993 |
5.70 |
0.3901 |
0.999 |
12.67 |
| Sample 2 |
264.42 |
244.75 |
0.0398 |
0.920 |
282.49 |
2.05 × 10⁻⁴ |
0.990 |
16.36 |
(2) Pseudo-second-order kinetic model. The pseudo-second-order kinetic model is greatly influenced by the amount of metal ions on the adsorbent surface. This adsorption rate is directly proportional to the number of active surface sites. Ho et al. developed the pseudo-second-order kinetic model for the adsorption system of divalent metal ions. In this work, the pseudo-second-order kinetic model was used to investigate the adsorption kinetics of Pb(II) ions on the CS and HAP/CS porous materials.56| |
 | (7) |
The pseudo-second-order kinetic model can be expressed in a non-linear form by integration:
| |
 | (8) |
| |
 | (9) |
where
k2 (g mg
−1 h
−1) is the rate constant for the pseudo-second-order kinetic model. The constants
qe,cal and
k2 were calculated from the slopes and intercepts, respectively, of the
t/
qt versus t plots (
Fig. 10). The theoretical equilibrium adsorbed amounts of Pb(
II) on the CS and HAP/CS porous materials were 5.70 and 282.49 mg g
−1, respectively (
Table 3). The initial adsorption rate of Pb(
II) ions was expressed as
hi =
k2qe2 (g mg
−1 h
−1), which could be calculated according to the pseudo-second-order kinetic model.
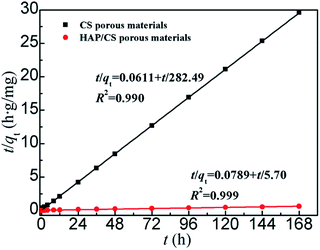 |
| | Fig. 10 Pseudo-second-order kinetic model plot for the adsorption of Pb(II) ions on the CS and HAP/CS porous materials. | |
Fig. 9 and 10 show the pseudo-first-order and pseudo-second-order kinetic model plots for the adsorption of Pb(II) ions, respectively. The pseudo-first-order and pseudo-second-order kinetic data are indicated in Table 3. The characteristics of the pseudo-first-order and pseudo-second-order kinetic models were suitable for both the adsorption of Pb(II) ions on the CS and HAP/CS porous materials. The correlation coefficients (R2) of the pseudo-first-order and pseudo-second-order kinetic models for the HAP/CS porous material were 0.920 and 0.990, respectively, while those for the CS porous material were 0.993 and 0.999, respectively (Table 3). The R2 values of the pseudo-second-order kinetic model were greater than those of the pseudo-first-order kinetic model, suggesting that the pseudo-second-order kinetic model better fit the adsorptions of both the CS and HAP/CS porous materials. This result was attributed to the chemical adsorption of Pb(II) ions on the CS and HAP/CS porous materials. After the flow of Pb(II) ions through the adsorbents, PbHAP rods and CS–Pb complexes were formed on the HAP/CS and CS porous materials, respectively. However, the pseudo-first-order kinetic model is mainly used to fit simple physical adsorption.
According to the theoretical calculated results of the pseudo-second-order kinetic model, the initial adsorption rate of Pb(II) on the HAP/CS porous material (16.36 g mg−1 h−1) was greater than that on the CS porous material (12.67 g mg−1 h−1), while the adsorption rate constant of the HAP/CS porous material (k2 = 2.05 × 10⁻⁴ g mg−1 h−1) was lower than that of the CS porous material (k2 = 0.3901 g mg−1 h−1). The Pb(II) adsorption mechanisms on the HAP/CS and CS porous materials were the conversion reaction of HAP into PbHAP and the complexation reaction of CS with Pb(II) ions to form CS–Pb complexes, respectively. The larger initial adsorption rate on the HAP/CS porous material compared with on the CS porous material demonstrated that the conversion rate of HAP into PbHAP was greater than the complexation rate of CS–Pb. With prolonged adsorption time, the as-produced PbHAP rods on the HAP/CS porous material blocked the diffusion of PO43− ions (Fig. 6), decreasing the chemical adsorption rate of Pb(II) ions. However, the adsorption process of Pb(II) ions on the CS porous material did not involve the phenomenon which existed on the HAP/CS porous material. Few CS–Pb particles covered the CS porous material (Fig. 4a). Therefore, the adsorption rate of Pb(II) ions on the HAP/CS porous material (k2 = 2.05 × 10⁻⁴ g mg−1 h−1) was lower than that on the CS porous material (k2 = 0.3901 g mg−1 h−1).
According to the data shown in Fig. 7a, the experimental equilibrium adsorbed amounts of Pb(II) on the CS and HAP/CS porous materials were 5.68 mg g−1 and 264.42 mg g−1, respectively. For the pseudo-first-order kinetic model, the theoretical equilibrium adsorbed amounts (qe,theo) of the CS and HAP/CS porous materials were 5.69 and 244.75 mg g−1, respectively, while the qe,theo values for pseudo-second-order kinetic model were 5.70 and 282.49 mg g−1, respectively. Because the experimental adsorption results were in better agreement with the pseudo-second-order kinetic model than the pseudo-first-order kinetic model (Fig. 9 and 10), the theoretic equilibrium adsorbed amounts of Pb(II) for the CS and HAP/CS porous materials should be 5.70 and 282.49 mg g−1, respectively.
4. Conclusions
HAP/CS porous materials, used to remove Pb(II) ions from aqueous solutions, have been fabricated by a freeze-drying method and characterized by several physicochemical techniques. Low-crystallinity HAP particles were dispersed uniformly among the HAP/CS porous material. Pb(II) sorption experiments were conducted under flow conditions at a flow rate of 0.8 mL min−1 and the ability of HAP/CS porous materials to remove Pb(II) ions from aqueous solutions was analyzed via ICP/OES. The results indicated that the HAP/CS porous material possesses a high sorption capacity because of the presence of HAP particles in the composite material. During the adsorption process, the HAP particles were converted to rod-like PbHAP particles via a dissolution–precipitation reaction. Adsorption kinetic studies revealed that the sorption of Pb(II) on the HAP/CS porous material exhibit a good fit with the pseudo-second-order kinetic model. Therefore, HAP/CS porous materials have promising applications in the removal of Pb(II) ions.
Acknowledgements
This research was supported by the Natural Science Foundation of China (no. 51372152), the Program of Shanghai Normal University (nos DZL124, DCL201303, SK201333), the Innovation Foundation of Shanghai Education Committee (no. 14ZZ124), and the State Key Laboratory for Modification of Chemical Fibers and Polymer Materials, Dong Hua University.
Notes and references
- S. Hokkanen, E. Repo and M. Sillanpää, Chem. Eng. J., 2013, 223, 40–47 CrossRef CAS PubMed.
- B. Kizelkaya and A. A. TekJny, J. Chem., 2014 DOI:10.1155/2014/739273.
- S. Telisman, B. Colak, A. Pizent, J. Jurasovic and P. Cvitkovic, Environ. Res., 2007, 105, 256–266 CrossRef CAS PubMed.
- Y. N. Han, S. H. Jiao, M. Xu, G. S. Pang and S. H. Feng, RSC Adv., 2014, 4, 14357–14360 RSC.
- B. Volesky, Hydrometallurgy, 2001, 59, 203–216 CrossRef CAS.
- A. S. Őzcan, Ő. Gők and A. Őzcan, J. Hazard. Mater., 2009, 161, 499–509 CrossRef PubMed.
- M. Trgo, J. Perić and N. V. Medvidović, J. Hazard. Mater., 2006, 136, 938–945 CrossRef CAS PubMed.
- S. Chung, S. Kim, J. Kim and J. Chung, Ind. Eng. Chem. Res., 2014, 53, 15192–15199 CrossRef CAS.
- S. M. Scherrenberg, A. M. Kloeze, A. N. Janssen, A. F. van Nieuwenhuijzen, H. W. H. Menkveld, M. Bechger and J. H. J. M. van der Graaf, Water Sci. Technol., 2010, 62, 2083–2089 CrossRef CAS PubMed.
- S. Liang, X. Y. Guo and Q. H. Tian, Desalin. Water Treat., 2013, 51, 7166–7171 CrossRef CAS.
- N. Haddou, M. R. Ghezzar, F. Abdelmalek, S. Ognier, M. Martel and A. Addou, Chemosphere, 2014, 107, 304–310 CrossRef CAS PubMed.
- A. Rabii, G. N. Bidhendi and N. Mehrdadi, Desalin. Water Treat., 2012, 43, 1–7 CrossRef CAS.
- C. V. Gherasim, J. Křivčík and P. Mikulášek, Chem. Eng. J., 2014, 256, 324–334 CrossRef CAS PubMed.
- Y. X. Liu, J. M. Yan, D. X. Yuan, Q. L. Li and X. Y. Wu, Chem. Eng. J., 2013, 218, 81–88 CrossRef CAS PubMed.
- S. Luo, X. Xu, G. Zhou, C. Liu, Y. Tang and Y. Liu, J. Hazard. Mater., 2014, 274, 145–155 CrossRef CAS PubMed.
- F. K. Shieh, C. T. Hsiao, H. M. Kao, Y. C. Sue, K. W. Lin, C. C. Wu, X. H. Chen, L. Wan, M. H. Hsu, J. R. Hwu, C. K. Tsung and K. C.-W. Wu, RSC Adv., 2013, 3, 25686–25689 RSC.
- V. Hernández-Morales, R. Nava, Y. J. Acosta-Silva, S. A. Macías-Sánchez, J. J. Pérez-Bueno and B. Pawelec, Microporous Mesoporous Mater., 2012, 160, 133–142 CrossRef PubMed.
- M. R. Nabid, R. Sedghi, A. Bagheri, M. Behbahani, M. Taghizadeh, H. A. Oskooie and M. M. Heravi, J. Hazard. Mater., 2012, 203, 93–100 CrossRef PubMed.
- H. Liu, P. Dai, J. Zhang, C. L. Zhang, N. Bao, C. Cheng and L. Ren, Chem. Eng. J., 2013, 228, 425–434 CrossRef CAS PubMed.
- M. Rafatullah, O. Sulaiman, R. Hashim and A. Ahmad, J. Hazard. Mater., 2009, 170, 969–977 CrossRef CAS PubMed.
- S. Dib, M. Boufatit, S. Chelouaou, F. Sadi-Hassaine, J. Croissant, J. Long, L. Raehm, C. Charnay and J.-O. Durand, RSC Adv., 2014, 4, 24838–24841 RSC.
- L. S. Tan, J. Xu, X. Q. Xue, Z. M. Lou, J. Zhu, S. A. Baig and X. H. Xu, RSC Adv., 2014, 4, 45920–45929 RSC.
- Y. C. Lu, J. He and G. Luo, Chem. Eng. J., 2013, 226, 271–277 CrossRef CAS PubMed.
- N. Li and R. Bai, Ind. Eng. Chem. Res., 2006, 45, 7897–7904 CrossRef CAS.
- H. Lu, W. Zhang, Y. Yang, X. Huang, S. Wang and R. Qiu, Water Res., 2012, 46, 854–862 CrossRef CAS PubMed.
- W. J. Zhang, X. H. Shi, Y. X. Zhang, W. Gu, B. Y. Li and Y. Z. Xian, J. Mater. Chem. A, 2013, 1, 1745–1753 CAS.
- F. Zhang, Z. S. Zhao, R. Q. Tan, W. Xu, G. B. Jiang and W. J. Song, Chem. Eng. J., 2012, 203, 110–114 CrossRef CAS PubMed.
- G. Bharath, A. Jagadeesh Kumar, K. Karthick, D. Mangalaraj, C. Viswanathana and N. Ponpandian, RSC Adv., 2014, 4, 37446–37457 RSC.
- Y. Zhang, Y. Liu, X. B. Ji, C. E. Banks and W. Zhang, Chem. Commun., 2011, 47, 4126–4128 RSC.
- W. Liang, L. Zhan, L. H. Piao and C. Rüssel, Mater. Sci. Eng., B, 2011, 176, 1010–1014 CrossRef CAS PubMed.
- H. Y. Xua, L. Yang, P. Wang, Y. Liu and M. S. Peng, J. Environ. Manage., 2008, 86, 319–328 CrossRef PubMed.
- N. Gupta, A. K. Kushwaha and M. C. Chattopadhyaya, J. Taiwan Inst. Chem. Eng., 2012, 43, 125–131 CAS.
- R. Bazargan-Lari, M. E. Bahrololoom and A. Nemati, J. Food, Agric. Environ., 2011, 9, 892–897 CAS.
- Y. Xiao and M. H. Cao, Chem.–Asian J., 2014, 9, 2859–2865 CrossRef CAS PubMed.
- J. Wu and J. C. Meredith, ACS Macro Lett., 2014, 3, 185–190 CrossRef CAS.
- M. Vetrik, M. Pradny, L. Kobera, M. Slouf, M. Rabyk, A. Pospisilova, P. Stepanek and M. Hruby, RSC Adv., 2013, 3, 15282–15289 RSC.
- H. Nakao, S. H. Hyon, S. Tsutsumi, T. Matsumoto and J. Takahashi, Dent. Mater. J., 2003, 22, 262–271 CrossRef CAS.
- S. Tang, B. Tian, Y. J. Guo, Z. A. Zhu and Y. P. Guo, Surf. Coat. Technol., 2014, 251, 210–216 CrossRef CAS PubMed.
- G. Lawrie, I. Keen, B. Drew, A. Chandler-Temple, L. Rintoul, P. Fredericks and L. Grøndahl, Biomacromolecules, 2007, 8, 2533–2541 CrossRef CAS PubMed.
- T. C. Coelho, R. Laus, A. S. Mangrich, V. T. de Fávere and M. C. M. Laranjeira, React. Funct. Polym., 2007, 67, 468–475 CrossRef CAS PubMed.
- C. B. Baddiel and E. E. Berry, Spectrochim. Acta, 1966, 22, 1407–1416 CrossRef CAS.
- D. Walsh, T. Furuzono and J. Tanaka, Biomaterials, 2001, 22, 1205–1212 CrossRef CAS.
- F. Ye, H. Guo, H. Zhang and X. He, Acta Biomater., 2010, 6, 2212–2218 CrossRef CAS PubMed.
- M. W. Wana, C. C. Kan, B. D. Rogel and M. L. P. Dalida, Carbohydr. Polym., 2010, 80, 891–899 CrossRef PubMed.
- R. Karthik and S. Meenakshi, Chem. Eng. J., 2015, 263, 168–177 CrossRef CAS PubMed.
- G. Y. Zhang, R. J. Qu, C. M. Sun, C. N. Ji, H. Chen, C. H. Wang and Y. Z. Niu, J. Appl. Polym. Sci., 2008, 110, 2321–2327 CrossRef CAS.
- R. Laus, T. G. Costa, B. Szpoganicz and V. T. Fávere, J. Hazard. Mater., 2010, 177, 126–130 CrossRef PubMed.
- Z. Z. Zhang, M. Y. Li, W. Chen, S. Z. Zhu, N. N. Liu and L. Y. Zhu, Environ. Pollut., 2010, 158, 514–519 CrossRef CAS PubMed.
- F. Googerdchian, A. Moheb and R. Emadi, Chem. Eng. J., 2012, 200–202, 471–479 CrossRef CAS PubMed.
- D. Liao, W. Zheng, X. Li, Q. Yang, X. Yue, L. Guo and G. Zeng, J. Hazard. Mater., 2010, 177, 126–130 CrossRef CAS PubMed.
- X. Y. Zhao, Y. J. Zhu, J. Zhao, B. Q. Lu, F. Chen, C. Qi and J. Wu, J. Colloid Interface Sci., 2014, 416, 11–18 CrossRef CAS PubMed.
- S. H. Jang, Y. G. Jeong, B. G. Min, W. S. Lyoo and S. C. Lee, J. Hazard. Mater., 2008, 159, 294–299 CrossRef CAS PubMed.
- H. B. Weiser and A. P. Bloxsom, J. Phys. Chem., 1924, 28, 26–40 CrossRef CAS.
- H. B. Weiser and W. O. V. Milligan, J. Phys. Chem., 1932, 36, 1950–1959 CrossRef CAS.
- S. Lagergren, K. Sven. Vetenskapsakad. Handl., 1898, 24, 1–39 Search PubMed.
- Y. S. Ho and G. McKay, Process Biochem., 1999, 34, 451–465 CrossRef CAS.
- A. Masoumi, K. Hemmati and M. Ghaemy, RSC Adv., 2015, 5, 1735–1744 RSC.
Footnote |
| † Yong Lei and Junjie Guan contributed equally to this work. |
|
| This journal is © The Royal Society of Chemistry 2015 |
Click here to see how this site uses Cookies. View our privacy policy here. 

![[double bond, length as m-dash]](https://www.rsc.org/images/entities/char_e001.gif) O stretching vibration, C–H deformation vibration, and C–O stretching vibration, respectively.40
O stretching vibration, C–H deformation vibration, and C–O stretching vibration, respectively.40


![[thin space (1/6-em)]](https://www.rsc.org/images/entities/char_2009.gif) qe − k1t
qe − k1t


