Chemically grafted graphite nanosheets dispersed in poly(ethylene-glycol) by γ-radiolysis for enhanced lubrication
Bhavana Guptaa,
Kalpataru Pandab,
Niranjan Kumar*a,
Ambrose A. Melvinc,
Sitaram Dasha and
Ashok Kumar Tyagia
aMaterials Science Group, Indira Gandhi Centre for Atomic Research, Kalpakkam, India. E-mail: niranjan@igcar.gov.in; phystribology@gmail.com; Fax: +91 4427480081; Tel: +91 44 27480500 ext. 22537
bGraduate School of Engineering, Osaka University, Osaka, Japan
cCatalysis Division, CSIR-National Chemical Laboratory, Dr. Homi Bhabha Road, Pune, India
First published on 3rd June 2015
Abstract
Graphite nanosheets (Gr-NS) dispersed in poly(ethylene-glycol) (PEG200) medium were subjected to various doses of γ-irradiation. Hydroxyl functional groups present in PEG are chemically grafted through hydrogen bonding with hydroxyl, carbonyl and carboxylic groups of Gr-NS. The grafting process is driven by the generation of active radicals from solvent radiolysis. Chemical grafting was investigated using X-ray photoelectron spectroscopy (XPS) and Fourier transform infra-red (FTIR) spectroscopy. The results of spectroscopic studies revealed reduction in oxygen functionality of PEG-Gr-NS at higher doses of γ-irradiation. The γ-irradiation not only bridges the functionalities between PEG and PEG-Gr-NS but edge and basal plane defects in Gr-NS are further reduced as is evident from Raman analysis. The inter-planar sheet distance in Gr-NS is increased due to intercalated chemical grafting with PEG molecules. The chemical grafting between PEG and Gr-NS and reduction in defects enhance the tribological properties with a decrease of 26% and 32% for the friction coefficient and wear, respectively as compared to PEG alone. The lubrication mechanism is mediated through inter-planar weak forces when PEG is chemically grafted with Gr-NS. The electrostatic interaction of PEG with Gr-NS acts as a molecular bridge thus enhancing the sustainability of tribo-stress. Additionally, in the presence of functionalized PEG-Gr-NS tribo-contact conditions, evidence of deposited graphitic tribo-film was observed from micro-Raman spectroscopy inside the steel wear track. This film further enhanced lubrication mediated through low shear strength interlayer graphite sheets and therefore, antiwear properties were synergistically improved.
1 Introduction
In the modern day, the effective utilization of energy efficient techniques is required due to the continuous increase in greenhouse gas emissions and the depletion of fossil fuels. Usually, in passenger cars, the direct frictional losses, excluding braking friction, are estimated to consume 28% of the fuel energy.1 Reduction of friction in mechanical systems is one of the most important ways for improving energy efficiency of the machine components and maintaining a clean environment. Depending upon contact pressure, there are several solid, liquid and gaseous lubricants which act effectively to reduce friction and wear. At the microscopic scale, lubrication using carbon nanotubes and fullerene shows wear free motion attributed to weak van der Waals forces acting between the interlayers of walls and translational/rotational motion accomplished by fullerene moieties acting as springs and nanobearings.2–4 On the other hand, graphite, graphene and other lamellar solids such as crystalline molybdenum disulphide (MoS2) and tungsten disulphide (WS2) are known to be good solid lubricants and, thus, are widely used in several practical applications. These layered lamellar structures are analogous to stacked non-adherent lattices which easily slip while applying the force, thereby yielding ultra-low friction coefficients.5–9 Usage of these lamellar materials is promising for engine lube additives required for direct energy saving applications. This is possible if liquid lubricants are chemically grafted with lamellar materials via functionalization which allow shear and high strength boundary film formation on sliding interfaces.10,11 Several engineering requirements like mechanical strength, load bearing capacity and shear stability of sliding interfaces are easily achieved by using nanostructured layered materials dispersed in the lube oils. However, dispersion of nanomaterials in the lube medium is challenging due to the difference in cohesive forces. But the high specific surface area of lamellar materials enhances the ability towards chemical functionalization and better dispersibility in the lube medium. There are several reports which show functionalized graphene as a compatible lube additive that functions as a friction reducing agent via weak shear forces acting between the lamellar sheets. This effect is realized when graphene is chemically grafted with a lube component.6,12–15 Functionalization and chemical grafting of carbon materials with hydrocarbon based lubricants is favorable compared to other lamellar materials due to molecular similarity which allows easy chemical bridging. It is reported that uniform dispersion of graphite nanosheets in the base oil is effective if –OH and –COOH groups are introduced during sheet preparation.12,16 A functionalization with long chain compounds, i.e. aliphatic amine to obtain the amide derivative, enhances their dispersibility in nonpolar solvents. On the other hand, polarity increases in functionalized nanosheets and it can be dispersed through the use of a dispersant, avoiding further chemical reaction. This makes carbon a robust and technically suitable material for synthesizing lube based friction reducing additives. It is reported that dispersed graphene additives in the lube medium significantly reduces friction and wear of the sliding interfaces.6,10–12,14 However, enhanced lubrication properties of this material are restricted only to smooth contact interfaces due to the low dimensional order (2D) of graphene. Thinner sheets of graphene stick and further penetrate the metal subsurface of the sliding contacts due to plastic deformation and limit their sustainability which is required to provide a long term lubrication mechanism. To overcome these above problems, a dispersion of functionalized graphite nanosheets possibly restricts subsurface penetration due to their larger dimension (3D). It is possible to provide direct lubrication in rough contact when the thickness of the graphite sheet becomes larger than the contact asperities. On the one hand, solid lubrication properties of graphite in micro- and macroscopic scale are well studied and it is understood that low friction behavior in this material is governed by weak van der Waals interlayer forces, passivation of dangling bonds and the presence of incommensurate sliding interfaces.5,17–21 Unfortunately, less research has been carried out to understand the lubrication mechanism of freely suspended graphite nanosheets (Gr-NS) as compared to graphene based lube additives. It is understood that preparation of graphene requires chemical processing which generates unwanted harmful chemical waste for the environment. However, graphite nanosheets can be prepared and functionalized without releasing unwanted chemical waste.For the first time, we propose direct dispersion and functionalization of commercial grade graphite nanosheets (Gr-NS) in poly(ethylene-glycol) (PEG200) by applying a γ-irradiation dose. This is an environmentally clean and facile approach to produce graphite nanosheets for friction and wear reducing additives in lube medium. It is proposed that oxygen functionalization of Gr-NS is achieved through grafting, by the hydrogen bonding with hydroxyl groups of intercalated PEG molecules. PEG-Gr-NS are characterized using X-ray photoelectron spectroscopy (XPS), Fourier transform infra-red (FTIR) spectroscopy, Raman spectroscopy and high resolution transmission electron microscopy (HR-TEM). Evidence of the lubrication mechanism due to the presence of the Gr-NS tribo-film in the wear track was obtained by micro-Raman spectroscopy. Wear track dimension, morphology and chemical behavior was investigated to observe the effect of lubrication.
2 Experimental
2.1 Material synthesis
Standard commercial grade graphite was obtained from Sigma-Aldrich. Prior to γ-ray treatment, graphite powder (weight: 30 mg) in 3 mL of PEG200 was dispersed by ultrasonication, working at a frequency of 30 kHz for 3 hours. The γ-irradiation is effective when the volume of the material is small. Under these conditions, the dose of irradiation is homogeneously distributed all around the sample. PEG is a promising solid–liquid organic phase change material because of its high phase change enthalpy, chemical stability and suitable melting temperature which can be tuned by its molecular weight.22,23 Nitrogen purging was carried out for 5 minutes to remove the dissolved oxygen content. The resultant dispersion of graphite (weight: 30 mg) in 3 mL of PEG200 was then irradiated in a γ-ray chamber which housed a 60Co γ-ray source for 0, 18, 36 and 54 hours (h) at a dose rate of 5.1 kGy h−1 under atmospheric sealed conditions. After completion of the reaction, the glass vial colour changed to brown and the dark blackish colour dispersed PEG200 functionalized graphite powder was collected. This was processed with centrifugation, washing in water and drying in a vacuum oven at 60 °C to obtain the powder form of PEG200 functionalized Gr-NS. The dose dependent irradiation effect on the PEG-Gr-NS was investigated using various techniques. The procedure is green and facile for the synthesis and functionalization of a Gr-NS hybrid material for tribological applications. In this process, PEG200 solvent undergoes high-energy γ-irradiation resulting in the formation of ions, excited molecules, electrons and radicals. The electrons can easily become further solvated with PEG solvent molecules. The highly reducing activated electrons or solvated electrons are responsible for the reduction of oxygen functionalities24 and therefore, PEG radicals react with Gr-NS leading to functionalization through hydrogen bonding. For simplicity, the samples with γ-ray exposure of 0, 18, 36 and 54 h will be hereafter designated by PEG-Gr-NS0, PEG-Gr-NS1, PEG-Gr-NS2 and PEG-Gr-NS3, respectively, throughout the manuscript. The PEG-Gr-NS0 sample is pristine and non-irradiated.2.2 Characterization of hybrid PEG-Gr-NS
The morphology and microstructure of PEG-Gr-NS were analyzed using a field emission scanning electron microscope (FESEM, Zeiss Supra 55) and HR-TEM. Powder X-ray diffraction (XRD) measurements were carried out using a PANalytical X’pert Pro dual goniometer consisting of a Cu Kα (λ = 0.15418 nm) rotating anode to investigate the crystallography of PEG-Gr-NS samples. Chemical bonding features were investigated using XPS (ULVAC-Phi ESCA1800) using a monochromatic MgKα source operated at 400 W and 1253.6 eV. Chemical structure investigations of the samples including wear track analysis were carried out using a micro-Raman spectrometer (Renishaw) operating with a laser wavelength of 514.5 nm. A FTIR spectrometer (Bruker Optics), operating in transmission mode, with a spectral resolution of 4 cm−1, was used for the functional analysis of the PEG and PEG-Gr-NS samples. This analysis was also carried out on buried PEG-Gr-NS dispersed in PEG which was collected from the wear track after the tribology test. Wear track dimensions and morphology were determined using an optical microscope and FE-SEM. PEG200 was used as a synthetic lube base oil for tribological evaluation of PEG-Gr-NS hybrid nanomaterials. PEG200 functionalized powder graphite nanosheets, i.e. abbreviated by PEG-Gr-NS, were thoroughly dispersed in PEG200 by an ultrasonication process and their dispersion stability was monitored for 3 days. Ultrasonication was carried out for 3 hours at a frequency of 30 kHz for the dispersion of powder PEG-Gr-NS in PEG200 lube medium. The dispersion time was optimized at a constant frequency of 30 kHz. It was visibly observed that for less than 1 hour the dispersion of the Gr-NS was not stable and particles were agglomerated after 1 day. However, when the ultrasonication time was more than 1 hour, the agglomeration was absent and PEG200 functionalized Gr-NS were homogeneously distributed in PEG200 medium. The tribo-evaluation of PEG200 dispersed PEG-Gr-NS was carried out by measuring friction and wear properties using a ball-on-disc standard tribometer (CSM Instrument, Switzerland) operating in linear reciprocating mode. A 100Cr6 spherical steel ball with a diameter of 6 mm was used as a sliding material against the stationary lubricated steel (316LN) disc. The sliding ball was mounted in a holder, which was connected through a stiff lever coupled with the friction force transducer. The friction coefficient was determined using a linear variable differential transformer (LVDT) sensor measuring the deflection in the elastic arm. All experiments were carried out at constant normal load of 1 N, linear sliding speed of 3 cm s−1, stroke length of 4 mm and sliding distance of 100 meters. In each tribo-test, two drops of PEG-Gr-NS dispersed in PEG200 lubricant were used which thoroughly lubricated the sliding interfaces. In situ wear depth was measured using a LVDT sensor coupled to the core of a tribometer. All tribo-tests were carried out in the ambient environment.3 Results and discussion
3.1 XRD, FE-SEM and HR-TEM analysis of PEG-Gr-NS
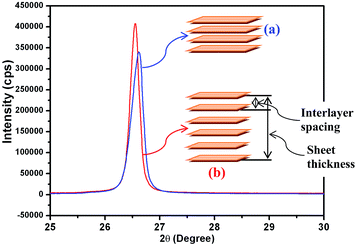
XRD analysis was used to characterize the crystalline nature and phase purity of the Gr-NS samples. PEG-Gr-NS0 shows a diffraction peak of the (002) plane at 26.62° 2θ which is shifted to low 2θ in PEG-Gr-NS3, which clearly indicates an increase in interlayer spacing after the γ-radiolysis (Fig. 1). The FWHM of the (002) peak is reduced in the PEG-Gr-NS3 sample, indicating an increase in thickness of the graphite sheets along the c-axis. This value is 5.3 nm in PEG-Gr-NS0 and increased to 8.93 nm in the PEG-Gr-NS3 sample. The thickness of the PEG-Gr-NS samples was calculated by the Scherrer equation:where d is the mean size of crystalline graphite domains in c-axis, K is a dimensionless shape factor with a value close to unity, λ is the X-ray wavelength, β is the line broadening and the θ is the Bragg angle. The above analysis clearly points to an increase in not only the interlayer spacing but also an increase in the number of sheets in graphite that could be driven by γ-radiolysis. In both samples, the XRD results are produced for three different locations and the characteristics were nearly similar.
Though the interlayer spacing increases, the crystallinity improves in the PEG-Gr-NS3 sample. The γ-irradiation-induced ordering in graphite was earlier reported by Bin Li et al.25 The well-resolved morphology and microstructure of the PEG-Gr-NS3 sample are shown in FE-SEM, TEM and HR-TEM images (Fig. 2). A strained curved edge (arrow in FE-SEM) and semitransparent Gr-NS are observed in FE-SEM and TEM images which clearly point to the fact that the graphite sheet is composed of several layers. HR-TEM images reveal a bunch of Gr-NS indicated in region (a) of Fig. 2b. It is observed that the lateral dimension of the graphite is significantly larger than the thickness of the graphite sheet and this is clearly revealed in low resolution TEM and FE-SEM images (Fig. 2a). The lattice fringes show an interlayer distance of 0.41 nm, corresponding to the graphite (002) plane and this is in good agreement with XRD data. In highly oriented pyrolytic graphite (HOPG) the interlayer distance is 0.32 nm.26 Region (b) in Fig. 2b shows localized flaking of a few layers of the graphene sheets. Regions (c) and (d) typically represent the amorphous carbon structure. From this analysis, it is confirmed that the distance of (002) graphite planes is increased due to intercalation of PEG200. It is understood that structure is dominated by a combination of Gr-NS, localized graphene and amorphous carbon constituents.
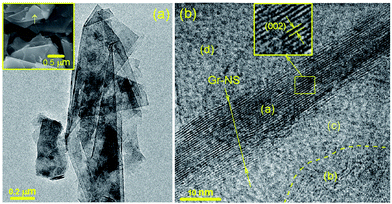 | ||
| Fig. 2 Low resolution (a) and high resolution TEM (b) of the PEG-Gr-NS3 sample. Inset in (a) shows an FE-SEM image of the PEG-Gr-NS3 sample. | ||
3.2 FTIR analysis
FTIR analysis was conducted to characterize the changes in chemical bonds that occurred during the γ-radiolysis of PEG-Gr-NS. For this analysis, three samples were selected. Fig. 3 shows the FTIR spectra of the PEG200, PEG-Gr-NS0 and PEG-Gr-NS3 samples. The PEG200 spectrum shows characteristic bands of specific functional groups. The doublets at 2938 and 2872 cm−1 belong to symmetric and antisymmetric –CH2 peaks of alkyl chains, respectively. The peak at 1062 cm−1 is assigned to the –C–O–C group.27 These two characteristic bands and some other bands appeared in the PEG-Gr-NS3 spectrum, indicating the existence of hydrogen bonding of PEG200 to the Gr-NS.23 The change in color of PEG-Gr-NS3 dispersed in the PEG200 medium is a clear indication of chemical reaction followed by grafting which is shown in the digital image. This image was obtained after a month of sample preparation and it clearly shows excellent stability of PEG-Gr-NS dispersion in the PEG200 lube. Peaks related to –CH2 and –C–O–C groups shifted to higher wavenumbers, suggesting the occurrence of stronger coordination between oxygen atoms in the –C–O–C group and PEG-Gr-NS.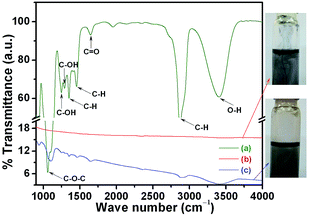 | ||
| Fig. 3 FTIR of (a) PEG200 (b) PEG-Gr-NS0 and (c) PEG-Gr-NS3. Digital images showing a change in color due to γ-radiolysis in sample (c) PEG-Gr-NS3. | ||
The hydrogen bonding contributes to the shape-stabilization because the PEG200 molecules are tied to the Gr-NS by the confinement effect of strong intermolecular hydrogen bonding, which hinders their freedom of motion. The bending vibrations of C–OH at 1242 and 1288 cm−1 along with C![[double bond, length as m-dash]](https://www.rsc.org/images/entities/char_e001.gif) O stretching vibration at 1651 cm−1 originate from hydroxyl (–OH) and carboxyl groups (–COOH) chemically linking PEG200 and Gr-NS through hydrogen bonding.22 Carboxylic acids are polar and behave as hydrogen-bond acceptors (–C
O stretching vibration at 1651 cm−1 originate from hydroxyl (–OH) and carboxyl groups (–COOH) chemically linking PEG200 and Gr-NS through hydrogen bonding.22 Carboxylic acids are polar and behave as hydrogen-bond acceptors (–C![[double bond, length as m-dash]](https://www.rsc.org/images/entities/char_e001.gif) O) and hydrogen-bond donors (–OH) and therefore, participate in hydrogen bonding. The band at 3407 cm−1 is the stretching O–H mode of the C–OH group in PEG which becomes broader in the PEG-Gr-NS3 sample. Absorption at 1342 and 1460 cm−1 is attributed to a deformed vibration of the C–H bond existing in PEG200 which conjugates with Gr-NS forming hydrogen bonds. From these results, it is confirmed that PEG-Gr-NS3 chemically links with Gr-NS. However, the PEG-Gr-NS0 sample does not show functional peaks of PEG200 and Gr-NS which clearly indicates the absence of functionalization and chemical grafting. This is visibly reflected in the digital image which shows agglomerated precipitates of Gr-NS.
O) and hydrogen-bond donors (–OH) and therefore, participate in hydrogen bonding. The band at 3407 cm−1 is the stretching O–H mode of the C–OH group in PEG which becomes broader in the PEG-Gr-NS3 sample. Absorption at 1342 and 1460 cm−1 is attributed to a deformed vibration of the C–H bond existing in PEG200 which conjugates with Gr-NS forming hydrogen bonds. From these results, it is confirmed that PEG-Gr-NS3 chemically links with Gr-NS. However, the PEG-Gr-NS0 sample does not show functional peaks of PEG200 and Gr-NS which clearly indicates the absence of functionalization and chemical grafting. This is visibly reflected in the digital image which shows agglomerated precipitates of Gr-NS.
3.3 Raman spectra
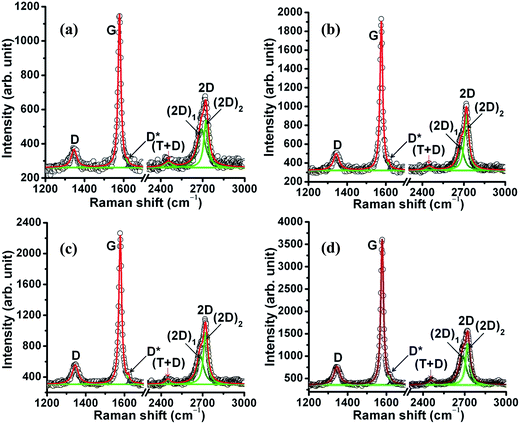
Two phonon modes with E2g symmetry at the center of the first Brillouin zone are active in first-order Raman scattering in highly oriented pyrolytic graphite (HOPG), i.e. quasi-perfect infinite ABAB… stacking of graphene layers. The first one is located at about 43 cm−1 and corresponds to anti-phase translational motion of successive layers perpendicular to their normal.28 It is hardly observable because of its proximity to the Rayleigh line. The second one, commonly called the G band, is located at 1580 cm−1 and corresponds to the zone center vibration of carbon atoms.29–31 These are the common vibrational characteristics of graphene and graphite materials. In samples PEG-Gr-NS(0–3) (Fig. 4), the G band appears at 1577–1578 cm−1 and is close to that of crystalline graphite which is in good agreement with the XRD data (Fig. 1). In these samples, full width at half maximum (FWHM) of the G band is 17.5–18 cm−1 which is a signature of the crystalline structure of graphite.32,33 A weak feature D band with A1g symmetry appears at 1345 cm−1 as a consequence of a double resonance which involves scattering of the electron by a phonon and defect. It is sensitive to the structural changes and attributed to the significant defect concentration. These defects are mainly in-plane substitutional heteroatoms, vacancies, or grain boundaries/edges.34 The D* band is bond disordered symmetry and originates from the intra-valley double resonance scattering process.35 This band involves graphene layers existing at the surface of a graphitic crystal i.e. graphene layers which are not sandwiched between two other graphene layers.The integrated intensity ratio I(D)/I(G) is widely used for characterizing the defect concentration in graphite. This ratio is a measure of the degree of disorder in the graphite structure and it is inversely proportional to the average size of the sp2 C![[double bond, length as m-dash]](https://www.rsc.org/images/entities/char_e001.gif) C cluster.29,30 An increasing I(D)/I(G) ratio indicates in-plane defects such as interstitials and vacancies and their clusters which eventually result in bond formation, disordering and turbulence of the basal planes. From this analogical point of view, the I(D)/I(G) ratio is 0.31 in sample PEG-Gr-NS0 which decreased to 0.21 in sample PEG-Gr-NS3 indicating a reduction in defect concentration (Fig. 5). For both the graphite samples, the Raman spectra exhibits second-order bands and analysis of these bands is equally important to investigate order/disordered states in graphite. In the second-order Raman spectrum, the mode generated at the K symmetry point of the Brillouin zone gives rise to the 2D band.36
C cluster.29,30 An increasing I(D)/I(G) ratio indicates in-plane defects such as interstitials and vacancies and their clusters which eventually result in bond formation, disordering and turbulence of the basal planes. From this analogical point of view, the I(D)/I(G) ratio is 0.31 in sample PEG-Gr-NS0 which decreased to 0.21 in sample PEG-Gr-NS3 indicating a reduction in defect concentration (Fig. 5). For both the graphite samples, the Raman spectra exhibits second-order bands and analysis of these bands is equally important to investigate order/disordered states in graphite. In the second-order Raman spectrum, the mode generated at the K symmetry point of the Brillouin zone gives rise to the 2D band.36
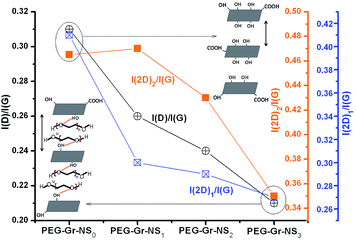 | ||
| Fig. 5 γ-Radiolysis of PEG-Gr-NS vs. structural changes considering change in the I(D)/I(G), I(2D)1/I(G) and I(2D)2/I(G) ratio. | ||
This band is active for HOPG due to two phonon emissions having equal and opposite wave-vectors and hence conserved momentum. Since zone-boundary phonons do not satisfy the Raman fundamental selection rule they are not observed in the first order Raman spectra of defect-free graphite.28 Such phonons give rise to a D band Raman peak at 1345 cm−1 in defected graphite. The 2D band arises from a splitting in the π-electron dispersion and is attributed to strong interaction between the basal planes of graphite. Results show that the 2D band splits into (2D)1 and (2D)2 bands centered at 2682 and 2721 cm−1, respectively.37,38 The splitting of these bands is described as a characteristic feature of a 3D graphite lattice.28,36,39 These bands are associated with contributions from regions near the K and M points of the wave vector, respectively.40 The I(2D)1/I(G) and I(2D)2/I(G) ratios are high in sample PEG-Gr-NS0 which consistently decreases and become smallest in sample PEG-Gr-NS3 signifying less stacking faults in the graphite sheets.41 The relationship of I(D)/I(G) with I(2D)1/I(G) and I(2D)2/I(G) ratios is clearly shown in Fig. 5. The decrease of these ratios describes the reduction in the above mentioned defects and this is schematically shown in the inset of Fig. 5. The interlayer distance due to intercalation of PEG increased, preserving the structural integrity. The defects reduced due to γ-irradiation which induces reduction of oxygen functionalities. This acts to promote chemical grafting of PEG between the graphite sheets. The band at 2450–2453 cm−1 (T + D) can be attributed to the Raman-active first overtone of a Raman-inactive graphitic lattice vibration mode that occurs at 1220 cm−1.38,42
3.4 HR-XPS analysis
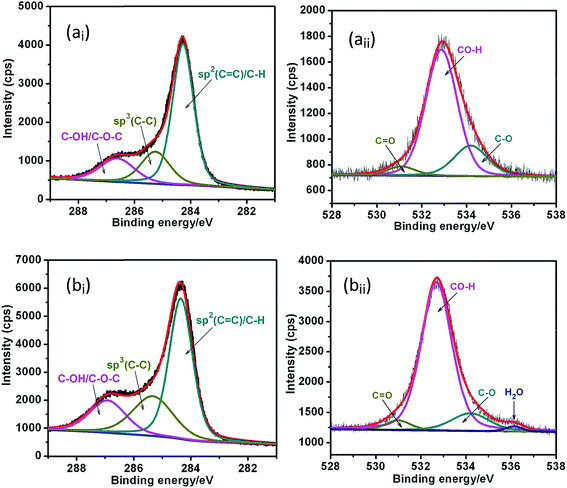
To reveal the carbon–oxygen groups and chemical structure, the XPS of C 1s and O 1s spectra were obtained. The spectra were fitted using the Gaussian–Lorentzian function to respective components with binding energy (BE) values for C 1s and O 1s photoelectrons characteristic for the particular groups. Fig. 6 shows high resolution C 1s and O 1s XPS spectra of the PEG-Gr-NS0 and PEG-Gr-NS3 samples. The doublet peak of the C 1s spectrum can be deconvoluted into three chemically shifted distinct components, C![[double bond, length as m-dash]](https://www.rsc.org/images/entities/char_e001.gif) C sp2, C–C sp3 and C–OH/C–O–C at BE 284.27, 285.26 and 286.65 eV, respectively, in PEG-Gr-NS0 (Fig. 6ai).43,44
C sp2, C–C sp3 and C–OH/C–O–C at BE 284.27, 285.26 and 286.65 eV, respectively, in PEG-Gr-NS0 (Fig. 6ai).43,44
These peaks are slightly shifted to 284.3, 285.3 and 286.9 eV in sample PEG-Gr-NS3 (Fig. 6bi). Consequently, in this sample, a broad O 1s peak is deconvoluted into three different chemically shifted components with major hydroxyl/epoxy groups C–OH/C–O–C at 532.8 eV. The other two peaks pertain to carboxyl C–O and carbonyl C![[double bond, length as m-dash]](https://www.rsc.org/images/entities/char_e001.gif) O functionalities existing at 534.1 and 531.1 eV, respectively (Fig. 6aii). However, in PEG-Gr-NS3, a broad O 1s peak is deconvoluted into four chemically shifted components with an additional minor peak of chemisorbed H2O at 536.13 eV (Fig. 6bii). Such a wide range of BE is attributed due to the presence of water in PEG200-incorporated Gr-NS. The carbon functional groups create hydrogen bonds with water molecules via oxygen and/or hydrogen.45,46 A high content of C–C sp3 in PEG-Gr-NS3 is explained by the presence of extensively functionalized oxygen and possible linking of alkyl groups to carbon atoms. The C–OH hydroxyl group from O 1s is placed at higher BE compared to the C–OH/C–O–C group bonded to carbon. This is observed in C 1s spectra and indicates the presence of water molecules attached to functionalized oxygen and incorporated between the Gr-NS. This is also evident from the FTIR analysis. In both samples, oxygen groups resulting in the O 1s spectra are approximately similar to the respective components resulting from the fitting of C 1s spectra. It is noticed that the CO–H component in O 1s increases with an increase in the CO–H/C–O–C component of the C 1s spectra in PEG-Gr-NS3. In these samples, the presence of a carbonyl group indicates C
O functionalities existing at 534.1 and 531.1 eV, respectively (Fig. 6aii). However, in PEG-Gr-NS3, a broad O 1s peak is deconvoluted into four chemically shifted components with an additional minor peak of chemisorbed H2O at 536.13 eV (Fig. 6bii). Such a wide range of BE is attributed due to the presence of water in PEG200-incorporated Gr-NS. The carbon functional groups create hydrogen bonds with water molecules via oxygen and/or hydrogen.45,46 A high content of C–C sp3 in PEG-Gr-NS3 is explained by the presence of extensively functionalized oxygen and possible linking of alkyl groups to carbon atoms. The C–OH hydroxyl group from O 1s is placed at higher BE compared to the C–OH/C–O–C group bonded to carbon. This is observed in C 1s spectra and indicates the presence of water molecules attached to functionalized oxygen and incorporated between the Gr-NS. This is also evident from the FTIR analysis. In both samples, oxygen groups resulting in the O 1s spectra are approximately similar to the respective components resulting from the fitting of C 1s spectra. It is noticed that the CO–H component in O 1s increases with an increase in the CO–H/C–O–C component of the C 1s spectra in PEG-Gr-NS3. In these samples, the presence of a carbonyl group indicates C![[double bond, length as m-dash]](https://www.rsc.org/images/entities/char_e001.gif) O interaction with the adsorbed water via hydrogen bonding. The C
O interaction with the adsorbed water via hydrogen bonding. The C![[double bond, length as m-dash]](https://www.rsc.org/images/entities/char_e001.gif) C sp2/C–C sp3 ratio is 3.3 and 2.6 in the PEG-Gr-NS0 and PEG-Gr-NS3 samples, respectively. Therefore, C
C sp2/C–C sp3 ratio is 3.3 and 2.6 in the PEG-Gr-NS0 and PEG-Gr-NS3 samples, respectively. Therefore, C![[double bond, length as m-dash]](https://www.rsc.org/images/entities/char_e001.gif) C sp2/[C–OH/C–O–C] and C–C sp3/[C–OH/C–O–C] are 3.81 and 2.78 in PEG-Gr-NS0. These values decreased to 1.15 and 1.08 in the PEG-Gr-NS3 sample which is a clear indication of increased PEG200 functionalization. The O 1s intensity ratio of oxygen functional groups with respect to the C–C sp3 and C
C sp2/[C–OH/C–O–C] and C–C sp3/[C–OH/C–O–C] are 3.81 and 2.78 in PEG-Gr-NS0. These values decreased to 1.15 and 1.08 in the PEG-Gr-NS3 sample which is a clear indication of increased PEG200 functionalization. The O 1s intensity ratio of oxygen functional groups with respect to the C–C sp3 and C![[double bond, length as m-dash]](https://www.rsc.org/images/entities/char_e001.gif) C sp2 domains increases in PEG-Gr-NS3 leading to the formation of the epoxide (C–O–C) linkage which results in the increased interlayer spacing.47
C sp2 domains increases in PEG-Gr-NS3 leading to the formation of the epoxide (C–O–C) linkage which results in the increased interlayer spacing.47
3.5 Friction and lubrication mechanism of hybrid PEG-Gr-NS dispersed in PEG200
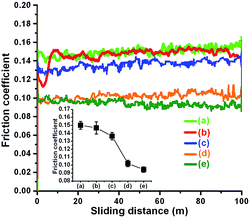
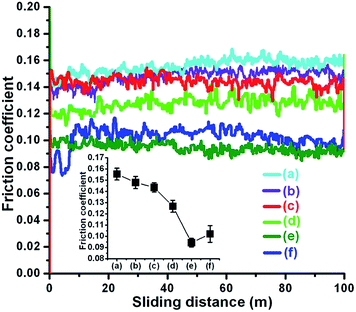
The friction coefficients of PEG200 and PEG-Gr-NS0 have a similar magnitude of value ∼0.15 (Fig. 7). This indicates that without γ-irradiation PEG-Gr-NS do not have a friction reducing capability due to the absence of chemical grafting with PEG200. However, this value is consistently decreased with an increase in γ-irradiation dose and becomes lowest (∼0.09) in the PEG-Gr-NS3 sample (curve (e)). The average value is plotted in the inset of Fig. 7.The friction coefficient values of PEG-Gr-NS2 and PEG-Gr-NS3 are approximately close (Fig. 7d–e) which indicates that the effect of irradiation becomes ineffective after a certain critical dose. In the next step, the concentration of PEG-Gr-NS3 was varied in PEG medium to obtain the lowest value of the friction coefficient (Fig. 8). This value was lowest (∼0.09) at a concentration of 0.03 mg mL−1 and this is clearly shown in the inset of Fig. 8. At the lowest concentration (0.02 mg mL−1) this value is slightly higher as compared to 0.03 mg mL−1 and consistently increases with the increase in concentration. This indicates the sensitivity of friction coefficient to the concentration of PEG-Gr-NS in lube medium. At higher concentration, it is assumed that Gr-NS collide in contact which may generate wear and disrupt the lamellar motion.48 In contrast, the effective lubrication process decreases when the concentration of PEG-Gr-NS is small enough, which does not properly fill the contact interfaces during sliding. From here, three tribo-test conditions, only PEG200, PEG-Gr-NS0 and PEG-Gr-NS3, were selected for investigating the lubrication mechanism. Choosing the above mentioned conditions is meaningful in order to understand the lubrication mechanism when only PEG200 was introduced during the tribo-test. Consequently, comparison of lubrication in the other two conditions, where PEG-Gr-NS0 belongs to the non-irradiated sample, showed the highest value of friction coefficient whilst PEG-Gr-NS3 displayed the lowest one. The other two samples, PEG-Gr-NS1 and PEG-Gr-NS2, show close friction results with PEG-Gr-NS0 and PEG-Gr-NS3, respectively.
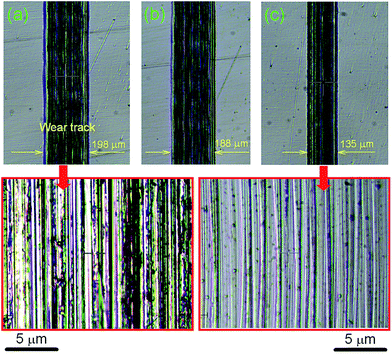
It is clearly seen that wear width is approximately similar for PEG200 and PEG-Gr-NS0 (Fig. 9a and b) and it is greatly reduced for the PEG-Gr-NS3 tribo-conditions (Fig. 9c). The magnified image of the wear track in PEG200 lubricated conditions shows deep scratches, cracks, grooves and delaminated deformed ripples, suggesting severe plastic deformation along with adhesive wear. However, the wear track is smoother in PEG-Gr-NS3 lubricated conditions. Penetration depth is also greatly reduced for the PEG-Gr-NS3 sample (Fig. 10).
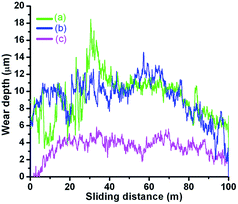 | ||
| Fig. 10 In situ penetration depth in steel disc for (a) PEG200, (b) PEG-Gr-NS0 and (c) PEG-Gr-NS3 tribo-test conditions. | ||
The other two samples, PEG200 and PEG-Gr-NS0, show a high penetration depth and the curves are unstable, with large periodic deviation which is the signature of high periodic wear and formation of scratches and grooves. This indicates that the work done by friction is directly proportional to the wear of the contacting bodies. Such a relationship is important to investigate from a chemical point of view. For the analysis, after the tribological test, the buried lubricant from the contacting bodies was collected for FTIR studies. The ratio of –C–H/O–H is greatly reduced and this is related to the oxidation of decomposed methyl groups which chemically interact with atmospheric moisture, resulting in highly disordered oxygenated Gr-NS (Fig. 11). This reaction enhances formation of carbonyl and carboxyl functional groups along with a new peak related to the carbonyl C![[double bond, length as m-dash]](https://www.rsc.org/images/entities/char_e001.gif) O stretching mode appearing at 1736 cm−1. Results confirm the existence of hydroxyl and carbonyl groups in the PEG-Gr-NS0 and PEG-Gr-NS3 systems which are in agreement with the proposed structural models.16
O stretching mode appearing at 1736 cm−1. Results confirm the existence of hydroxyl and carbonyl groups in the PEG-Gr-NS0 and PEG-Gr-NS3 systems which are in agreement with the proposed structural models.16
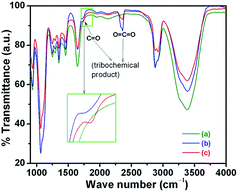 | ||
| Fig. 11 FTIR of buried lubricant collected from the tribo-contact after the test of (a) PEG200, (b) PEG-Gr-NS0 and (c) PEG-Gr-NS3. | ||
This indicates that the main functional groups in PEG200 and Gr-NS are preserved after the tribological test. In addition, the FTIR results suggest that there are C![[double bond, length as m-dash]](https://www.rsc.org/images/entities/char_e001.gif) O and O–H groups in both PEG and Gr-NS, which indicates possible hydrogen bonding between PEG and Gr-NS. An antisymmetric stretching mode at 2342 cm−1 belongs to the tribochemical product of CO2 molecules entrapped in PEG-Gr-NS0 and PEG-Gr-NS3 samples which is a consequence of the oxidation of carbon. The shift in peak position and change in relative intensity are attributed to grafting through hydrogen bonding. However, functionalization in buried tribo-tested PEG200 samples remains the same as compared to pure PEG200, indicating an absence of weak/strong chemical interactions. The similarities in tribo-functional changes in PEG-Gr-NS0 and PEG-Gr-NS3 do not satisfactorily answer the large difference in friction coefficient. This may be related to the small amount of PEG-Gr-NS dispersed in the lube medium of PEG200. Therefore, the Raman spectra inside of the wear tracks of the above mentioned tribo-conditions were obtained to investigate the formation of the adsorbed tribo-film. A very weak feature of carbonaceous material was detected at around 1320–1460 cm−1 inside the wear track (Fig. 12a). This is a product of the tribochemical reaction of PEG200 with the steel surface. Such carbonaceous material is formed due to the presence of a small amount of carbon in steel and decomposed hydrocarbon of PEG200 which is an adsorbed product of the wear track. This behavior is observed when only PEG200 is introduced in tribo-contact. However, a strong feature of the Raman peaks inside the wear track reveals the signature of graphite/a-C in the PEG-Gr-NS0 sample (Fig. 12b). In this case, the I(D)/I(G) ratio increases to 1.26 which clearly signifies a large quantity of in-plane defects such as heteroatoms, grain boundaries and the formation of aliphatic chains. These results point to structural instability associated with basal planes. The D* band (1616 cm−1) becomes stronger with the newly appeared (G + D) line (2940 cm−1) which is a signature of defects, and characteristics of these defects are mentioned above in detail (Section 3.3). The G band intensity does not change much but it becomes broad because of the appearance of a shoulder D* line contributing to an increase in intensity of the D band. Increase in the I(D)/I(G) and I(D*)/I(G) ratios clearly induce an increase in C
O and O–H groups in both PEG and Gr-NS, which indicates possible hydrogen bonding between PEG and Gr-NS. An antisymmetric stretching mode at 2342 cm−1 belongs to the tribochemical product of CO2 molecules entrapped in PEG-Gr-NS0 and PEG-Gr-NS3 samples which is a consequence of the oxidation of carbon. The shift in peak position and change in relative intensity are attributed to grafting through hydrogen bonding. However, functionalization in buried tribo-tested PEG200 samples remains the same as compared to pure PEG200, indicating an absence of weak/strong chemical interactions. The similarities in tribo-functional changes in PEG-Gr-NS0 and PEG-Gr-NS3 do not satisfactorily answer the large difference in friction coefficient. This may be related to the small amount of PEG-Gr-NS dispersed in the lube medium of PEG200. Therefore, the Raman spectra inside of the wear tracks of the above mentioned tribo-conditions were obtained to investigate the formation of the adsorbed tribo-film. A very weak feature of carbonaceous material was detected at around 1320–1460 cm−1 inside the wear track (Fig. 12a). This is a product of the tribochemical reaction of PEG200 with the steel surface. Such carbonaceous material is formed due to the presence of a small amount of carbon in steel and decomposed hydrocarbon of PEG200 which is an adsorbed product of the wear track. This behavior is observed when only PEG200 is introduced in tribo-contact. However, a strong feature of the Raman peaks inside the wear track reveals the signature of graphite/a-C in the PEG-Gr-NS0 sample (Fig. 12b). In this case, the I(D)/I(G) ratio increases to 1.26 which clearly signifies a large quantity of in-plane defects such as heteroatoms, grain boundaries and the formation of aliphatic chains. These results point to structural instability associated with basal planes. The D* band (1616 cm−1) becomes stronger with the newly appeared (G + D) line (2940 cm−1) which is a signature of defects, and characteristics of these defects are mentioned above in detail (Section 3.3). The G band intensity does not change much but it becomes broad because of the appearance of a shoulder D* line contributing to an increase in intensity of the D band. Increase in the I(D)/I(G) and I(D*)/I(G) ratios clearly induce an increase in C![[double bond, length as m-dash]](https://www.rsc.org/images/entities/char_e001.gif) C sp2 boundaries and heteroatoms.49 The shift in the G band and increase in the D band FWHM are associated with the formation of more C–C sp3 carbon atoms in the graphite lattice. This indicates oxidation of Gr-NS which tends to distort in-plane C
C sp2 boundaries and heteroatoms.49 The shift in the G band and increase in the D band FWHM are associated with the formation of more C–C sp3 carbon atoms in the graphite lattice. This indicates oxidation of Gr-NS which tends to distort in-plane C![[double bond, length as m-dash]](https://www.rsc.org/images/entities/char_e001.gif) C sp2 domains.30 In addition, increases in I(2D)1/I(G) and decreases in I(2D)2/I(G) ratios to 0.5 and 0.2, respectively, indicate enhanced stacking defects in graphite. An additional higher-order band is observed at 2942 cm−1, which is a combination of the G and D (G + D) mode, characteristic of disordered graphitic structures.50
C sp2 domains.30 In addition, increases in I(2D)1/I(G) and decreases in I(2D)2/I(G) ratios to 0.5 and 0.2, respectively, indicate enhanced stacking defects in graphite. An additional higher-order band is observed at 2942 cm−1, which is a combination of the G and D (G + D) mode, characteristic of disordered graphitic structures.50
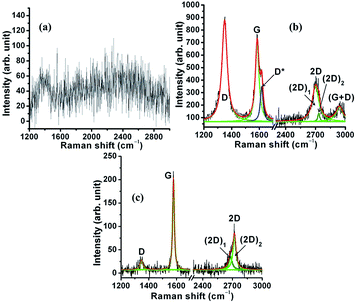 | ||
| Fig. 12 Raman spectra inside the wear track of the steel sample for (a) PEG200, (b) PEG-Gr-NS0 and (c) PEG-Gr-NS3. | ||
The above mentioned Raman characteristics indicate that defects in Gr-NS are greatly contributed by oxidation41 which is related to dissipation of high frictional energy. Absence of PEG200 functionalization in PEG-Gr-NS0 samples is the reason behind the high frictional energy which causes oxidation and structural disorder in Gr-NS. Although a tribolayer is formed in the steel wear track, the friction does not reduce due to the oxidized graphite structure. However, Raman spectral characteristics such as the shape and peak position inside the wear track lubricated with PEG-Gr-NS3 are similar to the virgin γ-irradiated PEG-Gr-NS3 sample. The comparison can be seen in Fig. 4d and 12c. The I(D)/I(G) ratio decreased to 0.13 which indicates reduction of various in-plane defects. This induces ordering in the basal plane. The ratios of I(2D)1/I(G) and I(2D)2/I(G) are 0.17 and 0.4, respectively, which signifies a reduction in c-axis stacking defects.41 The absence of D* and (G + D) bands including the above mentioned spectral characteristics indicates ordering in the graphite lattice. This shows structural stability of Gr-NS, mediated through the chemical interaction with functional groups of PEG200 and functionalized Gr-NS. Linkage of PEG200 and Gr-NS through hydrogen bonding acts as a molecular spring in the normal direction which counters the tribo-induced contact stress. This is schematically represented in Fig. 13. Specifically, this mechanism absorbs the energy produced in the normal direction through molecular bridging, helping to reduce the deformation and wear. This effect is possible when the O–H⋯O bond length integrated between PEG-Gr-NS changes due to a change in electrostatic potential. Consequently, interlayer graphite sheets easily shear when the distance between the sheets increases due to intercalation of PEG200 molecules. In this condition, effective interlayer shearing reduces the energy in the lateral direction. The hydrogen bonding between PEG200 and Gr-NS contributes to the shape-stabilizer. This happens when PEG molecules are tied to the surface of Gr-NS by the confinement effect of strong intermolecular hydrogen bonding aligned parallel to the graphite sheet.51 The graphite tribolayer is possibly formed when cohesive interaction between the sliding surfaces and PEG200 is locally disrupted by the critical contact pressure and cleavage of hydrogen bonding due to the shear force. In these conditions, the small domain of the graphite tribolayer is deposited on the steel wear track.52 This layer is sustainable and preserved due to the dissipation of less frictional energy. The remarkable lubricating effect exists even in the case of tribo-film of nanometer scale.52,53 This is an indication of a predominant surface rather than a bulk effect. In macroscale studies, sliding over the various nano-objects reduced friction and wear due to the multiple nano-object contact interfaces.54 The lowest friction coefficient and wear in macroscale contact occurs with nanoparticles due to the reduced contact area.
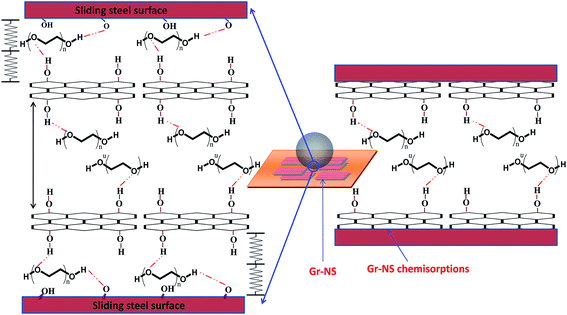 | ||
| Fig. 13 Tribo-contact conditions and lubrication mechanism of PEG-Gr-NS dispersed in poly(ethylene glycol). | ||
4 Conclusion
The γ-irradiation process reduces the oxygen functionalities of Gr-NS in the presence of PEG200, resulting in an ordered structure of graphite nanosheets. Hydroxyl functional groups of PEG200 are chemically grafted with hydroxyl, carbonyl and carboxylic groups of Gr-NS through hydrogen bonding. This is possible due to the production of active radicals through the solvent γ-radiolysis which enhances the dispersion capability of Gr-NS in the PEG200 lube medium. Though the oxygen functionality reduces, the inter-planer distance of Gr-NS is increased due to intercalation of PEG200 molecules, preserving the orderly structure. Tribological properties of PEG200 grafted Gr-NS with the minute concentration of 0.03 mg mL−1 in PEG200 lubricated conditions showed a significant reduction in friction coefficient and wear. This value was 0.15 in a PEG200 lubricated medium and reduced to 0.09 for hybrid PEG-Gr-NS with PEG200 lubricated conditions. Wear loss from the steel disc was also reduced by up to 32%. Such an improvement in tribological properties is explained by: (a) effective shearing of graphite interlayers due to grafting of PEG200 with Gr-NS; (b) attachment of PEG-Gr-NS functionalized groups to sliding surfaces; and (c) formation of chemisorbed Gr-NS tribo-film in the wear track. The deposited Gr-NS prevent direct contact between the tribo-pairs and exhibited a remarkable improvement in wear properties.Conflict of interest
The authors declare that there is no competing financial interest.Acknowledgements
B. Gupta would like to acknowledge DST, New Delhi for the Inspire Fellowship award. The contribution of Shailesh Joshi (IGCAR) for FTIR and IITM Chennai for HR-TEM characterization is acknowledged. We thank M. P. Janwadker, Director, MSG and Dr P. R. Vasudev Rao, Director, IGCAR for support.References
- K. Holmberg, P. Andersson and A. Erdemir, Tribol. Int., 2012, 47, 221–234 CrossRef PubMed.
- J. Cumings and A. Zettl, Science, 2000, 289, 602–604 CrossRef CAS.
- M. R. Falvo, R. M. Taylor, A. Helser, V. Chi Jr, F. P. Brooks, S. Washburn and R. Superfine, Nature, 1999, 397, 236–238 CrossRef CAS PubMed.
- R. Luthi, E. Meyer, H. Haefke, L. Howald, W. Gutmannsbauer and H. J. Guntherodt, Science, 1994, 266, 1979–1981 CAS.
- M. Dienwiebel, G. S. Verhoeven, N. Pradeep and J. W. M. Frenken, Phys. Rev. Lett., 2004, 92, 126101–126104 CrossRef.
- D. Berman, A. Erdemir and A. V. Sumant, Mater. Today, 2014, 17, 31–42 CrossRef CAS PubMed.
- C. M. Mate, G. M. McClelland, R. Erlandsson and S. Chiang, Phys. Rev. Lett., 1987, 59, 1942–1945 CrossRef CAS.
- L. Rapoport, N. Fleischer and R. Tenne, Adv. Mater., 2003, 15, 651–655 CrossRef CAS PubMed.
- C. Dae-Hyun, L. Wang, K. Jin-Seon, L. Gwan-Hyoung, K. Eok Su, L. Sunhee, L. S. Yoon, J. Hone and L. Changgu, Nanoscale, 2013, 5, 3063–3069 RSC.
- P. Jibin, W. Shanhong, Z. Wenjie, M. Yufei, Z. Xiaoqian, W. Liping and X. Qunji, J. Phys. Chem. C, 2011, 115, 13275–13284 Search PubMed.
- K. Sangita, O. P. Sharma, G. Rashi, H. P. Mungse, K. Aruna, N. Kumar, H. Sugimura and O. P. Khatri, ACS Appl. Mater. Interfaces, 2015, 7, 3708–3716 Search PubMed.
- H. P. Mungse and O. P. Khatri, J. Phys. Chem. C, 2014, 118, 14394–14402 CAS.
- X. Feng, S. Kwon, J. Y. Park and M. Salmeron, ACS Nano, 2013, 7, 1718–1724 CrossRef CAS PubMed.
- K. Varsha, P. Minh-Quan, K. Nitee, Y. Hae-Sung, K. Chung-Soo, P. A. Jae-IL and A. Sung-Hoon, ACS Appl. Mater. Interfaces, 2013, 5, 4063–4075 Search PubMed.
- H. Liang, Y. Bu, J. Zhang, Z. Cao and A. Liang, ACS Appl. Mater. Interfaces, 2013, 5, 6369–6375 CAS.
- D. R. Dreyer, S. Park, C. W. Bielawski and R. S. Ruoff, Chem. Soc. Rev., 2010, 39, 228–240 RSC.
- R. D. Arnell and D. G. Teer, Nature, 1968, 218, 1155–1156 CrossRef CAS PubMed.
- X. Jinkun, Z. Lei, Z. Kechao, L. Jianguo, X. Xinlin and L. Zhiyou, Carbon, 2013, 65, 53–62 CrossRef PubMed.
- J. C. Rietsch, P. Brender, J. Dentzer, R. Gadiou, L. Vidal and C. Vix-Guterl, Carbon, 2013, 55, 90–97 CrossRef CAS PubMed.
- J. A. Ruan and B. Bhushan, J. Appl. Phys., 1994, 76, 8117–8120 CrossRef CAS PubMed.
- L. Ze, Y. Jiarui, G. Francois, Z. L. Jefferson, L. Yilun, W. Yibing, Y. Yanlian, C. Yao and Z. Quanshui, Phys. Rev. Lett., 2012, 108, 205503–205507 CrossRef.
- S. Zhang, Q. Tao, Z. Wang and Z. Zhang, J. Mater. Chem., 2012, 22, 20166–20169 RSC.
- C. Wang, L. Feng, H. Yang, G. Xin, W. Li, J. Zheng, W. Tian and X. Li, Phys. Chem. Chem. Phys., 2012, 14, 13233–13238 RSC.
- Y. W. Zhang, H. L. Ma, Q. L. Zhang, J. Peng, J. Q. Li, M. L. Zhai and Z. Z. Yu, J. Mater. Chem., 2012, 22, 13064–13069 RSC.
- L. Bin, Y. Feng, K. Ding, G. Qian, X. Zhang and J. Zhang, Carbon, 2013, 60, 186–192 CrossRef PubMed.
- J. Hwang, J. P. Carbotte, S. Tongay, A. F. Hebard and D. B. Tanner, Phys. Rev. B: Condens. Matter Mater. Phys., 2011, 84, 41410–41413 CrossRef.
- G. Mani, S. M. J. Yousuf, V. Elangovan and S. Balasubramanian, J. Mater. Chem. B, 2014, 2, 418–427 RSC.
- R. J. Nemanich and S. A. Solin, Phys. Rev. B: Condens. Matter Mater. Phys., 1979, 20, 392–401 CrossRef CAS.
- A. C. Ferrari and J. Robertson, Phys. Rev. B: Condens. Matter Mater. Phys., 2001, 64, 75414–75427 CrossRef.
- A. C. Ferrari and J. Robertson, Phys. Rev. B: Condens. Matter Mater. Phys., 2000, 61, 14095–14107 CrossRef CAS.
- A. C. Ferrari and D. M. Basko, Nat. Nanotechnol., 2013, 8, 235–246 CrossRef CAS PubMed.
- C. Beny-Bassez and J. N. Rouzaud, Scanning Electron Microsc., 1985, 1, 119–132 Search PubMed.
- O. Beyssac, J. N. Rouzaud, B. Goffe, F. Brunet and C. Chopin, Contrib. Mineral. Petrol., 2002, 143, 19–31 CrossRef CAS PubMed.
- L. M. Malard, M. A. Pimenta, G. Dresselhaus and M. S. Dresselhaus, Phys. Rep., 2009, 473, 51–87 CrossRef CAS PubMed.
- L. Nikiel and P. W. Jagodzinski, Carbon, 1993, 31, 1313–1317 CrossRef CAS.
- M. A. Pimenta, G. Dresselhaus, M. S. Dresselhaus, L. G. Cancado, A. Jorio and R. Saito, Phys. Chem. Chem. Phys., 2007, 9, 1276–1290 RSC.
- E. del Corro, A. O. de la Roza, M. Taravillo and V. G. Baonza, Carbon, 2012, 50, 4600–4606 CrossRef CAS PubMed.
- P. H. Tan, Y. M. Deng and Q. Zhao, Phys. Rev. B: Condens. Matter Mater. Phys., 1998, 58, 5435–5439 CrossRef CAS.
- L. G. Cancado, K. Takai, T. Enoki, M. Endo, Y. A. Kim, H. Mizusaki, N. L. Speziali, A. Jorio and M. A. Pimenta, Carbon, 2008, 46, 272–275 CrossRef CAS PubMed.
- A. C. Ferrari, J. C. Meyer, V. Scardaci, C. Casiraghi, M. Lazzeri, F. Mauri, S. Piscanec, D. Jiang, K. S. Novoselov, S. Roth and A. K. Geim, Phys. Rev. Lett., 2006, 187, 187401–187404 CrossRef.
- K. Karthikeyan, V. Murugan, Y. Kyusik and S. J. Kim, Carbon, 2013, 53, 38–49 CrossRef PubMed.
- A. Sadezky, H. Muckenhuber, H. Grothe, R. Niessner and U. Poschl, Carbon, 2005, 43, 1731–1742 CrossRef CAS PubMed.
- L. Stobinskia, B. Lesiaka, A. Malolepszy, M. Mazurkiewicz, B. Mierzwa, J. Zemek, P. Jiricek and I. Bieloshapk, J. Electron Spectrosc. Relat. Phenom., 2014, 195, 145–154 CrossRef PubMed.
- B. Lesiak, L. Stobinski, A. Malolepszy, M. Mazurkiewicz, L. Kövér and J. Tóth, J. Electron Spectrosc. Relat. Phenom., 2014, 193, 92–99 CrossRef CAS PubMed.
- A. Buchsteiner, A. Lerf and J. Pieper, J. Phys. Chem. B, 2006, 110, 22328–22338 CrossRef CAS PubMed.
- M. Acik, C. Mattevi, C. Gong, G. Lee, K. Cho, M. Chhowalla and Y. J. Chabal, ACS Nano, 2010, 4, 5861–5868 CrossRef CAS PubMed.
- D. W. Lee and J. W. Seo, J. Phys. Chem. C, 2011, 115, 2705–2712 CAS.
- O. Elomaa, V. K. Singh, I. A. Iyer, T. J. Hakala and J. Koskinen, Diamond Relat. Mater., 2015, 52, 43–48 CrossRef CAS PubMed.
- Z. Zafar, Z. H. Ni, X. Wu, Z. X. Shi, H. Y. Nan, J. Bai and L. T. Sun, Carbon, 2013, 61, 57–62 CrossRef CAS PubMed.
- Y. Wang, D. C. Alsmeyer and R. L. McCreery, Chem. Mater., 1990, 2, 557–563 CrossRef CAS.
- Q. Guo-Qiang, L. Cheng-Lu, B. Rui-Ying, L. Zheng-Ying, Y. Wei, X. Bang-Hu and Y. Ming-Bo, Sol. Energy Mater. Sol. Cells, 2014, 123, 171–177 CrossRef PubMed.
- H. P. Mungse, N. Kumar and O. P. Khatri, RSC Adv., 2015, 5, 25565–25571 RSC.
- T. Huang, T. Li, Y. Xin, B. Jin, Z. Chen, C. Su, H. Chena and S. Nutt, RSC Adv., 2014, 4, 19814–19823 RSC.
- D. Maharaj and B. Bhushan, Nanoscale, 2014, 6, 5838–5852 RSC.
| This journal is © The Royal Society of Chemistry 2015 |


