 Open Access Article
Creative Commons Attribution 3.0 Unported Licence
Mechanical and optical properties of ultralarge flakes of a metal–organic framework with molecular thickness†
Cristina
Hermosa
ab,
Benjamin R.
Horrocks
c,
José I.
Martínez
d,
Fabiola
Liscio
e,
Julio
Gómez-Herrero
*bf and
Félix
Zamora
*af
aDepartamento de Química Inorgánica, Universidad Autónoma de Madrid, 28049 Madrid, Spain. E-mail: felix.zamora@uam.es
bDepartamento de Física de la Materia Condensada, Universidad Autónoma de Madrid, 28049 Madrid, Spain. E-mail: julio.gomez@uam.es
cChemical Nanoscience Laboratory, School of Chemistry, Newcastle University, UK
dInstituto de Ciencia de Materiales CSIC, 28049 Madrid, Spain
eCNR-IMM, Instituto per la Microelettronica e Microsistemi,
via P. Gobetti 101, I-40129 Bologna, Italy
fCondensed Matter Physics Center (IFIMAC), Universidad Autónoma de Madrid, 28049 Madrid, Spain
First published on 16th February 2015
Abstract
The isolation of 2D-materials is already a success for graphene, graphene oxide, boron nitride and a few clays or metal chalcogenides, however despite the fact that some of them show very interesting physical properties, they lack useful functionalities. Metal–Organic Frameworks (MOFs) are multifunctional materials showing a wide range of physical and chemical properties that can be structurally designed by suitable selection of their building-blocks. This strategy may allow the production of layers with a variety of useful electronic and molecular recognition functionalities. Herein we isolate 2D-MOF flakes with areas of hundreds of square microns and an excellent control of the molecular thickness (from single up to ca. 50 layers). The samples exhibit such good photoluminescence and mechanical properties as to allow free-standing characterization of few layers’ flakes.
Introduction
Two-dimensional (2D) materials have attracted increasing attention in the last few years due to their potential expected applications.1 Graphene, a single layer of graphite, represents the first material of this kind.2 The fascinating physical properties3 and potential applications of graphene4,5 have stimulated the development of a number of 2D related materials including graphene oxide,6,7 BN,8 MoS2,9 and clays.10 However all of them show a rather limited or no chemical design and functionalities. Recently, it has been pointed out that covalent polymers,11 and layered covalent organic frameworks (COFs)1,12,13 or metal–organic frameworks (MOFs)14 could bring à la carte 2D materials with a variety of architectures, pre-designed cavities, and chemical functionalities.15 Even more importantly, suitable selection of the initial building blocks should enable preparation of multifunctional materials with interesting physical and chemical properties. In particular, MOFs are crystalline porous materials formed by linking organic molecules with metal fragments. They show a large number of properties and potential applications ranging from gas storage and separation, molecular sieves and catalysis to sensing.16,17 Additionally they have been used as a source of nanomaterials for the production, for instance, of nanoparticles18 and nanowires.19 The expected potential of metal–organic sheets to provide novel 2D-materials has triggered global research interest.1,13 Indeed, intensive attempts to generate 2D-layers of MOFs have been reported, applying different interesting strategies to this purpose. Thus, bottom-up procedures based on on-surface synthesis have been used to produce layers of MOFs but, unfortunately, the lateral dimensions of these structures are, so far, too small to expect relevant sheet-like properties;20,21 furthermore, they cannot yet be isolated and manipulated. Additionally, layer formation at the air–water interphase and subsequent deposition on surfaces has been proved as an alternative for production of MOFs exceeding micron lateral dimensions.22–24 However, although free-standing layers on TEM grids have demonstrated neither mechanical nor any other physical properties, they have been reported.Alternatively, the top-down approach based on liquid phase exfoliation (LPE) of crystals of layered MOFs assisted by ultrasound has been developed as an alternative procedure.25 Some examples following this top-down approach have been recently published, but in all of them the lateral dimensions of the layers have precluded both free-standing isolation and physical characterization.26–28
Along this line we have designed a new laminar MOF of formula [Cu(μ-pym2S2)(μ-Cl)]n (pymS2 = dipyrimidindisulfide), showing an interlayer interaction so weak that it can be delaminated just by interaction with an excess of solvent.29 Despite the fact that the bulk material showed intense red emission, the physical characterization of the layers of [Cu(μ-pym2S2)(μ-Cl)]n was not possible due to their reduced lateral size. In this work, we have been able to set up a method to produce ultra-large layers with control over the thickness that has allowed us to obtain free-standing few-layers flakes of this MOF and characterize their mechanical properties and its emission in 2D-materials ranging from single to a few layers. The results show the high potential of several chemically designed layered materials, such as MOFs, to produce novel 2D layered functional polymers.
Results and discussion
Flakes production and characterization
Prismatic crystals [Cu(μ-pym2S2)(μ-Cl)]n·nMeOH (pymS2 = dipyrimidindisulfide) were synthesized by slow evaporation of a dipyrimidinedisulfide MeOH![[thin space (1/6-em)]](https://www.rsc.org/images/entities/char_2009.gif) :
:![[thin space (1/6-em)]](https://www.rsc.org/images/entities/char_2009.gif) MeCN solution into a methanolic solution of CuCl2·2H2O (ESI† for details).
MeCN solution into a methanolic solution of CuCl2·2H2O (ESI† for details).
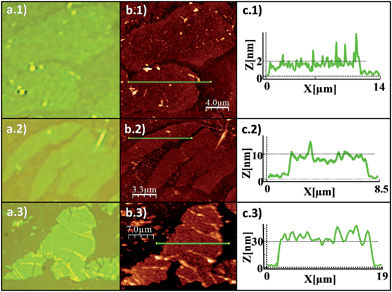
Fig. 1 shows schematic views of the structure of the MOF [Cu(μ-pym2S2)(μ-Cl)]n·nMeOH in which the presence of a layered structure with cavities containing solvent molecules is remarkable. Large orange crystals of [Cu(μ-pym2S2)(μ-Cl)]n·nMeOH were suspended in water, then sonicated and centrifuged to obtain a homogeneous suspension of larger surface area flakes. The integrity of the material obtained after sonication was confirmed by X-ray diffraction analysis, Fig. S5.† The productions of these large lateral dimensions are a consequence of the size of the starting crystals (dimensions ca. 125–60 × 45–80 × 35–70 μm3) which are significantly bigger than those previously used.29 These improvements in the dimensions of the laminar crystals combined with control of the exfoliation and centrifugation parameters allowed the production of large MOF-layers with controlled thickness (Fig. 2). The flakes were adsorbed by dip-coating at room temperature on Si/SiO2 (300 nm) (ESI† for experimental details). Fig. 2 shows AFM vs. optical images of MOF-layers with thicknesses ranging from 2 to 30 nm. XPS characterization of these flakes deposited on highly oriented pyrolytic graphite (HOPG) agrees with the data previously published by us29 confirming their composition. The control over the thickness of the MOF layers is achieved by adjusting the sonication time in the exfoliation procedure (ESI† for experimental details). The statistical analysis of the thickness of the MOF-layers shows the excellent control of the exfoliation within the sonication time and the production of homogeneous materials (Fig. S1†).
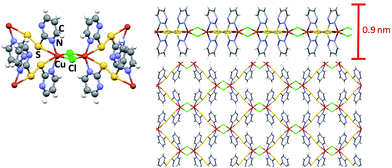 | ||
| Fig. 1 Representation of the basic components and structure of a layer of [Cu(μ-pym2S2)(μ-Cl)]n·nMeOH obtained by X-ray diffraction. | ||
Free-standing flakes of [Cu(μ-pym2S2)(μ-Cl)]n are obtained by dip-coating with a water suspension of the polymer at 55 °C on a Si/SiO2 (300 nm) substrate with predefined circular wells (diameters ranging from 0.5 to 3 μm and 400 nm depth; Fig. S2 in ESI†). The increase of temperature of the suspension helps to reduce the surface tension of water minimizing the formation of the meniscus in the wells and makes the solution slightly more volatile improving the ratio of free-standing vs. collapsed MOF layers.
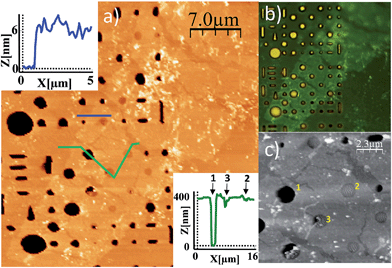
The adjustment of withdrawal speed and solution concentration seems to be critical to obtain free-standing flakes during dip-coating. Inspection by optical microscopy revealed polymer flakes covering several holes of the substrate (Fig. 3b). Importantly, the existence of suspended layers implies that we are not facing the deposition of random material, or some kind of precipitation process, we are really delaminating the crystals.
Atomic force microscopy (AFM) images30 (Fig. 3a and c) confirm this observation and provide a narrow height distribution for the flakes that ranges between 4–8 nm corresponding, to 5 to 10 layers of [Cu(μ-pym2S2)(μ-Cl)]n·nMeOH, with lateral dimensions ca. 300–3600 μm2. Although in the ideal case such sheets consist of single monolayers, they are often manifested as incompletely exfoliated flakes comprising a small number (<10) of stacked monolayers.
Additionally the AFM images reveal holes where the flake is perfectly suspended and others where it has collapsed, probably as a consequence of the capillary forces introduced by the solvent during evaporation. The high ratio of holes with suspended layers indicates a strong tendency of this large polymer flakes to withstand these forces. As a matter of fact, if a water suspension of graphene oxide flakes is deposited by drop-casting on a holed surface, they also exhibit an even higher tendency to collapse as a consequence of the capillary forces.31 These results show these flakes are mechanically stable to be spanned over the holes and give qualitative insights into the robustness of the sheets that further will be tested by their mechanical characterization.
Mechanical properties of free-standing flakes
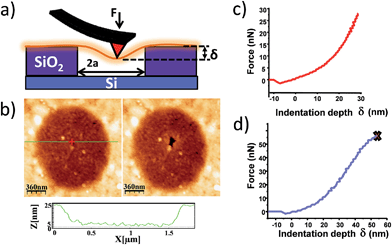
Mechanical stability is a relevant topic for 2D materials. The mechanical properties are sensitive to defects and thus they can be used as an indicator for the structural integrity and stability of the layers towards their application potential and device fabrication.35Mechanical characterization of the suspended flakes was performed using a standard nanoindentation set up with AFM.32Fig. 4a displays a scheme of the experimental set up. The mechanical load applied by the AFM tip can be considered to a good approximation as a punctual force F that produces an indentation δ given by:
 | (1) |
The same experimental set up can also be used to estimate the breaking force F0 and breaking strength given by σ* = [F0E/(hπRtip)]1/2 where Rtip is the tip radius (we have used two different AFM tips with radii 25 and 15 nm).32 We measured breaking forces of about 40 nN yielding σ* = 1 ± 0.4 GPa. Notice that the expression for the breaking force is for a linear material that tends to overestimate this figure.
Density functional calculations were carried out on [Cu(μ-pym2S2)(μ-Cl)]n·nMeOH (ESI† for details) yielding E ranging from 3.4 GPa for the polymer single layer without solvent molecules, up to 4.1 GPa when methanol molecules are considered.36 Both figures are in good agreement with the experimental results.
Table 1 summarizes the results. The Young's modulus measured for the MOF studied here is the lowest reported so far, being approximately 200 times lower than the one measured for pristine graphene. The breaking strength follows a similar tendency being 150 times lower than the one for graphene, yet it was still possible to suspend very thin layers of this compound from solution, where the capillary forces tend to collapse the membranes. Therefore, contrary to what one might expect, the weak strength bonds are enough to retain the 2D-layer structure as mechanically coherent entities.
Luminescence studies
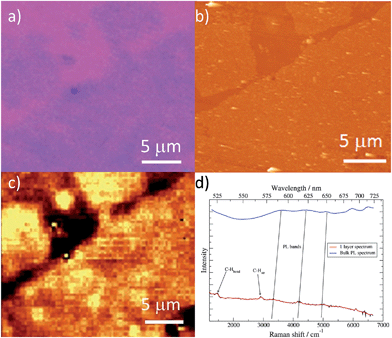
Studies of additional physical properties are of the greatest interest and never reported before for layers of MOFs of nanometer thickness. Therefore, since optical properties of single crystals of [Cu(μ-pym2S2)(μ-Cl)]n·nMeOH were previously reported by us,29 we decided to study how these optical properties persist to isolated layers. To this end, samples of [Cu(μ-pym2S2)(μ-Cl)]n·nMeOH were imaged in reflection to locate large ‘flakes' and suitable candidates for spectroscopy were identified by their apparent colour in the optical microscope, which is observed due to interference effects in very thin few layers flakes on the Si/SiO2 substrate. These flakes were subsequently characterized by AFM in order to determine their thickness and thereby to calculate the number of layers in each flake – the individual flakes are easily recognizable by their individual shapes and orientations relative to each other. After locating a flake, confocal spectral images were obtained by rastering the laser focus across the selected area of the sample.Each image corresponds to 104 individual spectra and the colour-scale is determined by integration of the spectra over a certain range of Raman shift. Fig. 5c shows an image of elastically-scattered light (<100 cm−1 Raman shift from the laser line 488 nm). Several large flakes are clearly visible and the identical flakes can also be identified in the optical and AFM images of Fig. 5a and b, respectively. Height analysis of the AFM images revealed that these flakes correspond to a single layer (height ca. 2 nm).29
Fig. 5d shows the Raman/luminescence spectra of the sample from Fig. 5a–c. It is clear that there are similarities as well as differences between the flake spectra and the bulk spectrum. Three bands (indicated by grey vertical lines) are present in the bulk and flake spectra near 580 nm, 615 nm and 650 nm. We assign these features to PL because the same emission wavelength was observed with a different excitation wavelength of 531 nm (in ESI Fig. S9† feature (iii)); they are blue-shifted in the flake spectra compared to the bulk spectrum by about 5–10 nm. In Fig. 5d we also observe bands centred at 526 nm (1470 cm−1 Raman shift) and 569 nm (2920 cm−1 Raman shift). Similar features appear in Fig. S9 (ESI†), although more details are visible because the longer wavelength excites PL to a lesser extent. Because these bands appear at fixed energy with respect to the laser, we assign them to Raman processes described by C–H bending and C–H stretching modes of the 2D-MOF and associated solvent (MeOH) molecules.
Density functional calculations (B3LYP/6-31G(d)) (ESI† for details) of the vibration modes of the ligand confirm that there are groups of vibrations near 1470 cm−1 (Fig. S9 in ESI†) which are associated with normal modes that are combinations of sp2 C–H bending and either C–C or C–N modes of the ring. These features are sharp in the bulk spectrum, but are broad and weak for flakes, which can be understood in terms of the partial loss of translational symmetry in the thin layers. In addition, it should be noted that solvent exchange effects MeOH/H2O are known for this compound29 and these may have a strong influence on the Raman features in this region because solvent molecules present in the bulk crystal are less easily exchanged than those present near the surface, which will exchange even in air. These solvent effects could explain the differences in behaviour of [Cu(μ-pym2S2)(μ-Cl)]n compared to graphite37 and MoS2 (ref. 38) with respect to the evolution of Raman spectra with sample thickness.
Other properties appear less sensitive to solvent effects. The luminescence properties of flakes on silicon oxide with thickness ranging from single, few to many layers, shift to the red, but otherwise do not significantly change as the number of layers increases (see also Fig. S8 and S9†).
Finally, we also measured Raman spectra of flakes suspended over circular holes (Fig. 6 and S11†). It is observed that the spectrum of free-standing flakes are qualitatively the same, though with a slightly larger intensity, to those lying on the Si/SiO2 substrates previously analysed and do not arise from flake–substrate interactions.
Experimental section
General methods
All chemicals were of reagent grade and were used as commercially obtained. The reactions were carried out under dry argon atmosphere using Schlenk techniques and vacuum-line systems. The dipyrimidinedisulfide (pym2S2) ligand was prepared according to the published procedure.39 [Cu(μ-pym2S2)(μ-Cl)]n·nMeOH was prepared with a slight modification of the procedure already published.29Luminescence/Raman measurements
The spectral images were recorded on α300RA and CRM200 confocal Raman microscopes (Witec GmbH, Ulm, Germany). The 532 and 488 nm lines, respectively, of an Nd-YAG and an argon ion laser provided the excitation light and the emitted and/or scattered light passed through a Raman edge filter to remove elastically scattered light. The filtered light was collected by a multimode optical fibre that also served as the confocal pinhole. The objective was a (100×) lens with a numeric aperture of 0.95 and a 50 μm single mode fibre was used to supply the excitation light. Luminescence excitation and emission spectra of the solid [Cu(μ-pym2S2)(μ-Cl)]n·nMeOH were performed at 25 °C on a 48000s (T-Optics) spectrofluorometer from SLM-Aminco.AFM measurements
Atomic Force Microscope (AFM) techniques were used in dynamic mode using a Nanotec Electronica system operating at room temperature in ambient conditions. The images were processed using WSxM.30 For AFM measurements, commercial Olympus Si/N and Ti/Pt cantilevers were used with a nominal force constant of 0.75 N m−1 and 2 N m−1, respectively (ESI† for details). Mechanical characterization of the free-standing flakes was performed by indenting an AFM tip at the centre of the suspended area. Only membranes showing a flat and homogeneous surface were selected for the measurements. Curves acquired on the Si/SiO2 (300 nm) non-deforming substrate were used as a reference for calculating the applied force and the resulting deflection of the layers (indentation δ).Conclusions
In summary, we report the use of liquid phase exfoliation and dip-coating as a simple an efficient top-down method for the production of flakes of a metal–organic framework with lateral dimensions of hundreds of square microns and with an excellent control of the thickness. The isolated layers on SiO2 have been characterized by AFM and Raman, they show red emission, and this observation remains for isolated free-standing flakes. The mechanical characterization confirms the stability of these layers. To the best of our knowledge, this is first time that the physical properties of layers of a free-standing MOF are reported. Mechanical stability of layers based on MOFs15 will be a requirement for device fabrication. Herein we have shown a proof-of-concept on the feasibility of materials based on MOF-layers. Obviously, polymers such as covalent organic fragment-works (COFs) will be a source of 2D-materials in the near future.Acknowledgements
The authors acknowledge financial support from MICINN (MAT2013-46753-C2-1-P and MAT2013-46753-C2-2-P and Consolider CSD2010-00024).Notes and references
- J. Sakamoto, J. van Heijst, O. Lukin and A. D. Schluter, Angew. Chem., Int. Ed., 2009, 48, 1030–1069 CrossRef CAS PubMed
.
- A. K. Geim and K. S. Novoselov, Nat. Mater., 2007, 6, 183–191 CrossRef CAS PubMed
.
- K. S. Novoselov, V. I. Fal'ko, L. Colombo, P. R. Gellert, M. G. Schwab and K. Kim, Nature, 2012, 490, 192–200 CrossRef CAS PubMed
.
- Y. M. Lin, A. Valdes-Garcia, S. J. Han, D. B. Farmer, I. Meric, Y. N. Sun, Y. Q. Wu, C. Dimitrakopoulos, A. Grill, P. Avouris and K. A. Jenkins, Science, 2011, 332, 1294–1297 CrossRef CAS PubMed
.
- L. B. Gao, G. X. Ni, Y. P. Liu, B. Liu, A. H. C. Neto and K. P. Loh, Nature, 2014, 505, 190–194 CrossRef CAS PubMed
.
- C. Gomez-Navarro, M. Burghard and K. Kern, Nano Lett., 2008, 8, 2045–2049 CrossRef CAS PubMed
.
- J. W. Suk, R. D. Piner, J. H. An and R. S. Ruoff, ACS Nano, 2010, 4, 6557–6564 CrossRef CAS PubMed
.
- L. Song, L. J. Ci, H. Lu, P. B. Sorokin, C. H. Jin, J. Ni, A. G. Kvashnin, D. G. Kvashnin, J. Lou, B. I. Yakobson and P. M. Ajayan, Nano Lett., 2010, 10, 3209–3215 CrossRef CAS PubMed
.
- A. Castellanos-Gomez, M. Poot, G. A. Steele, H. S. J. van der Zant, N. Agrait and G. Rubio-Bollinger, Adv. Mater., 2012, 24, 772–774 CrossRef CAS PubMed
.
- D. A. Kunz, E. Max, R. Weinkamer, T. Lunkenbein, J. Breu and A. Fery, Small, 2009, 5, 1816–1820 CrossRef CAS PubMed
.
- P. Kissel, R. Erni, W. B. Schweizer, M. D. Rossell, B. T. King, T. Bauer, S. Gotzinger, A. D. Schluter and J. Sakamoto, Nat. Chem., 2012, 4, 287–291 CrossRef CAS PubMed
.
- A. P. Cote, A. I. Benin, N. W. Ockwig, M. O'Keeffe, A. J. Matzger and O. M. Yaghi, Science, 2005, 310, 1166–1170 CrossRef CAS PubMed
.
- R. Mas-Balleste, C. Gomez-Navarro, J. Gomez-Herrero and F. Zamora, Nanoscale, 2011, 3, 20–30 RSC
.
- D. J. Tranchemontagne, J. L. Mendoza-Cortes, M. O'Keeffe and O. M. Yaghi, Chem. Soc. Rev., 2009, 38, 1257–1283 RSC
.
- J. W. Colson and W. R. Dichtel, Nat. Chem., 2013, 5, 453–465 CrossRef CAS PubMed
.
-
S. R. Batten, S. M. Neville and D. Turner, Coordination Polymers: Design, Analysis and Applications, RSC Publishing, 2009 Search PubMed
.
- A. U. Czaja, N. Trukhan and U. Muller, Chem. Soc. Rev., 2009, 38, 1284–1293 RSC
.
- A. Carne, C. Carbonell, I. Imaz and D. Maspoch, Chem. Soc. Rev., 2011, 40, 291–305 RSC
.
- R. Mas-Balleste, J. Gomez-Herrero and F. Zamora, Chem. Soc. Rev., 2010, 39, 4220–4233 RSC
.
- M. Lackinger and W. M. Heckl, J. Phys. D: Appl. Phys., 2011, 44, 464011 CrossRef
.
- S. Stepanow, M. Lingenfelder, A. Dmitriev, H. Spillmann, E. Delvigne, N. Lin, X. B. Deng, C. Z. Cai, J. V. Barth and K. Kern, Nat. Mater., 2004, 3, 229–233 CrossRef CAS PubMed
.
- T. Bauer, Z. K. Zheng, A. Renn, R. Enning, A. Stemmer, J. Sakamoto and A. D. Schluter, Angew. Chem., Int. Ed., 2011, 50, 7879–7884 CrossRef CAS PubMed
.
- Z. Zheng, C. S. Ruiz-Vargas, T. Bauer, A. Rossi, P. Payamyar, A. Schutz, A. Stemmer, J. Sakamoto and A. D. Schluter, Macromol. Rapid Commun., 2013, 34, 1670–1680 CrossRef CAS PubMed
.
- Z. K. Zheng, L. Opilik, F. Schiffmann, W. Liu, G. Bergamini, P. Ceroni, L. T. Lee, A. Schutz, J. Sakamoto, R. Zenobi, J. VandeVondele and A. D. Schluter, J. Am. Chem. Soc., 2014, 136, 6103–6110 CrossRef CAS PubMed
.
- P. Amo-Ochoa, L. Welte, R. González-Prieto, P. J. Sanz Miguel, C. J. Gómez-García, E. Mateo-Martí, S. Delgado, J. Gómez-Herrero and F. Zamora, Chem. Commun., 2010, 46, 3262–3264 RSC
.
- P. Z. Li, Y. Maeda and Q. Xu, Chem. Commun., 2011, 47, 8436–8438 RSC
.
- J. C. Tan, P. J. Saines, E. G. Bithell and A. K. Cheetham, ACS Nano, 2012, 6, 615–621 CrossRef CAS PubMed
.
- P. J. Beldon, S. Tominaka, P. Singh, T. S. Dasgupta, E. G. Bithell and A. K. Cheetham, Chem. Commun., 2014, 50, 3955–3957 RSC
.
- A. Gallego, C. Hermosa, O. Castillo, I. Berlanga, C. J. Gómez-García, E. Mateo-Marti, J. I. Martínez, F. Flores, C. Gómez-Navarro, J. Gómez-Herrero, S. Delgado and F. Zamora, Adv. Mater., 2013, 25, 2141–2146 CrossRef CAS PubMed
.
- I. Horcas, R. Fernandez, J. M. Gomez-Rodriguez, J. Colchero, J. Gomez-Herrero and A. M. Baro, Rev. Sci. Instrum., 2007, 78, 013705 CrossRef CAS PubMed
.
- J. W. Suk, R. D. Piner, J. An and R. S. Ruoff, ACS Nano, 2010, 4, 6557–6564 CrossRef CAS PubMed
.
- C. Lee, X. D. Wei, J. W. Kysar and J. Hone, Science, 2008, 321, 385–388 CrossRef CAS PubMed
.
- P. Li, Z. You, G. Haugstad and T. H. Cui, Appl. Phys. Lett., 2011, 98, 253105 CrossRef PubMed
.
- A. Turchanin, A. Beyer, C. T. Nottbohm, X. H. Zhang, R. Stosch, A. Sologubenko, J. Mayer, P. Hinze, T. Weimann and A. Golzhauser, Adv. Mater., 2009, 21, 1233–1237 CrossRef CAS
.
- P. Payamyar, K. Kaja, C. Ruiz-Vargas, A. Stemmer, D. J. Murray, C. J. Johnson, B. T. King, F. Schiffmann, J. VandeVondele, A. Renn, S. Gotzinger, P. Ceroni, A. Schutz, L. T. Lee, Z. K. Zheng, J. Sakamoto and A. D. Schluter, Adv. Mater., 2014, 26, 2052–2058 CrossRef CAS PubMed
.
- E. Cadelano and L. Colombo, Phys. Rev. B: Condens. Matter Mater. Phys., 2012, 85, 245434 CrossRef
.
- D. Graf, F. Molitor, K. Ensslin, C. Stampfer, A. Jungen, C. Hierold and L. Wirtz, Nano Lett., 2007, 7, 238–242 CrossRef CAS PubMed
.
- C. Lee, H. Yan, L. E. Brus, T. F. Heinz, J. Hone and S. Ryu, ACS Nano, 2010, 4, 2695–2700 CrossRef CAS PubMed
.
- R. Leino and J. E. Lonnqvist, Tetrahedron Lett., 2004, 45, 8489–8491 CrossRef CAS PubMed
.
Footnote |
| † Electronic supplementary information (ESI) available: Extended experimental details, additional Figures and theoretical calculations. See DOI: 10.1039/c4sc03115f |
| This journal is © The Royal Society of Chemistry 2015 |

