 Open Access Article
Creative Commons Attribution 3.0 Unported Licence
Membrane protein mobility depends on the length of extra-membrane domains and on the protein concentration†
Gernot
Guigas
and
Matthias
Weiss
*
Experimental Physics I, University of Bayreuth, 95440 Bayreuth, Germany. E-mail: matthias.weiss@uni-bayreuth.de
First published on 6th November 2014
Abstract
Diffusion of membrane proteins is not only determined by the membrane anchor friction but also by the overall concentration of proteins and the length of their extra-membrane domains. We have studied the influence of the latter two cues by mesoscopic simulations. As a result, we have found that the total friction of membrane proteins, γ, increases approximately linearly with the length of the extra-membrane domain, L, whereas a slightly nonlinear dependence on the total protein concentration, ϕ was observed. We provide an educated guess for the functional form of γ(L, ϕ) and the associated diffusion coefficient. This expression not only matches our simulation data but it is also in favorable agreement with previously published experimental data. Our findings indicate that diffusion coefficients of membrane proteins are not solely determined by the friction of membrane anchors but also extra-membrane domains and the crowdedness of the membrane need to be considered to obtain a comprehensive view of protein diffusion on cellular membranes.
Diffusion is the major driving force for the motion of membrane proteins. Diffusion supports the mixing of membrane-anchored proteins and therefore facilitates the encounter of cognate members of signaling pathways1 or supports a rapid exchange of surface proteins on pathogens.2 At present, the diffusion of membrane proteins is commonly described by an expression that has been derived by Saffman and Delbruck:3
 | (1) |
Originally, eqn (1) was derived for a single incompressible cylinder which completely spans a thin layer of a viscous fluid (the membrane) that is surrounded by a bulk fluid. However, the situation of proteins in cellular membranes differs significantly from this idealized model. First, many membrane proteins have bulky soluble extra-membrane domains that extend into adjacent bulk fluids, e.g. the cytoplasm or the extracellular space. Second, cell membranes are crowded with proteins, while the Saffman–Delbruck relation assumes dilute conditions. In fact, proteins occupy up to 30% of the membrane area and represent about 50% of the mass of cellular membranes.11 In line with this notion, simulations and experimental data suggest that both, long extra-membrane domains12,13 and total protein concentration8,14–16 have a significant influence on protein diffusion. Yet, a comprehensive study that quantifies simultaneously the impact of protein concentration, ϕ, and the length of extra-membrane domains, L, has been lacking so far. In other words, the functional form of the proteins' friction coefficient γ(L, ϕ) has remained poorly explored.
Here, we have used mesoscopic simulations to explore the influence of extra-membrane domain length and protein concentration on the diffusion of membrane proteins. In particular, we have used dissipative particle dynamics (DPD) as a simulation method. An introduction and details of the simulation method may be found in ref. 17. In brief, we imposed a linear repulsive force FCij = aij(1 − rij/r0)![[thin space (1/6-em)]](https://www.rsc.org/images/entities/char_2009.gif)
![[r with combining circumflex]](https://www.rsc.org/images/entities/b_char_0072_0302.gif) ij between any two beads i, j having a distance rij = |rij| = |ri − rj| ≤ r0; the associated unit vector is denoted by
ij between any two beads i, j having a distance rij = |rij| = |ri − rj| ≤ r0; the associated unit vector is denoted by ![[r with combining circumflex]](https://www.rsc.org/images/entities/b_char_0072_0302.gif) ij = rij/rij. Bead hydrophobicity was tuned via the interaction strength aij. Bonds within lipids and proteins were modeled via a harmonic potential U(ri, ri+1) = k(ri,i+1 − l0)2/2 and bending stiffness was imposed via the potential V(ri−1, ri, ri+1) = κ[1 −
ij = rij/rij. Bead hydrophobicity was tuned via the interaction strength aij. Bonds within lipids and proteins were modeled via a harmonic potential U(ri, ri+1) = k(ri,i+1 − l0)2/2 and bending stiffness was imposed via the potential V(ri−1, ri, ri+1) = κ[1 − ![[r with combining circumflex]](https://www.rsc.org/images/entities/b_char_0072_0302.gif) i−1,i·
i−1,i·![[r with combining circumflex]](https://www.rsc.org/images/entities/b_char_0072_0302.gif) i,i+1]. For the thermostat, dissipative and random forces were defined by FDij = −γij(1 − rij/r0)2(
i,i+1]. For the thermostat, dissipative and random forces were defined by FDij = −γij(1 − rij/r0)2(![[r with combining circumflex]](https://www.rsc.org/images/entities/b_char_0072_0302.gif) ijvij)
ijvij)![[r with combining circumflex]](https://www.rsc.org/images/entities/b_char_0072_0302.gif) ij and FRij = σij(1 − rij/r0)ζij
ij and FRij = σij(1 − rij/r0)ζij![[r with combining circumflex]](https://www.rsc.org/images/entities/b_char_0072_0302.gif) ij, respectively, when rij ≤ r0. Here, vij = vi − vj while ζij is an independent random variable with zero mean. Magnitudes of random force and dissipation, σij and γij, are related via the fluctuation–dissipation theorem18σij2 = 2γijkBT. The interaction cut-off r0, the bead mass m, and the thermostat temperature kBT were set to unity; the remaining parameters were γij = 9/2, σij = 3, k = 100kBT/r02, l0 = 0.45r0, κ = 10kBT, aHT = aWT = 200kBT, and aWW = aHH = aTT = aWH = 25kBT (indices W, H, and T denote water, lipid head, and lipid tail bead, respectively).
ij, respectively, when rij ≤ r0. Here, vij = vi − vj while ζij is an independent random variable with zero mean. Magnitudes of random force and dissipation, σij and γij, are related via the fluctuation–dissipation theorem18σij2 = 2γijkBT. The interaction cut-off r0, the bead mass m, and the thermostat temperature kBT were set to unity; the remaining parameters were γij = 9/2, σij = 3, k = 100kBT/r02, l0 = 0.45r0, κ = 10kBT, aHT = aWT = 200kBT, and aWW = aHH = aTT = aWH = 25kBT (indices W, H, and T denote water, lipid head, and lipid tail bead, respectively).
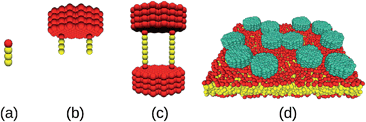
Lipids were modeled as linear chains (HT3; cf.Fig. 1a), and two different types of proteins were considered: Anchored proteins (Fig. 1b) consisted of two lipid anchors (HT3) connected three beads away from the symmetry axis of the hydrophilic domain (a filled hexagon of length Hn with a ‘diameter’ of 13 chains). Transmembrane proteins (Fig. 1c) consisted of two equal hydrophilic domains connected by two transmembrane chains (HT6H) that were attached at a distance of three beads from the hexagon symmetry axis. A typical simulation snapshot is shown in Fig. 1d. For both protein types, we have simulated hydrophilic domain lengths of n = 2, 4, 6, 10, and 15 beads. Water surrounding the lipid bilayer was modeled by individual beads and the equations of motion were integrated with a velocity Verlet scheme19 (time step Δt = 0.01) using periodic boundary conditions (box size (35r0)3). Conversion to SI units was done by gauging the membrane thickness and the lipid diffusion coefficient10 (r0 ≡ 1 nm, Δt ≡ 90 ps). Diffusion coefficients D were determined by tracking the center of mass of individual proteins for 107 time steps and fitting the time-averaged mean square displacement with the equation 〈r2〉 = 4Dt (see ESI† for representative datasets). For each condition, all proteins of four separate runs were evaluated individually to obtain error bounds. The friction coefficient was determined from these data as γ = kBT/D.
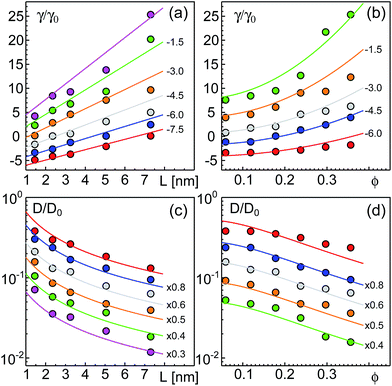
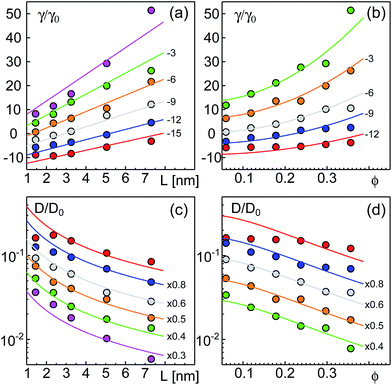
As a result of our simulations, we found that the reduced friction coefficients, γ/γ0 (γ0 = 1.13 × 10⁻⁹ kg s−1 being the friction of a single lipid), showed an approximately linear increase with the extra-domain length, L, for anchored (Fig. 2a) and transmembrane proteins (Fig. 3a). In addition, the friction increased nonlinearly with the area fraction ϕ that was occupied by proteins (Fig. 2b and 3b, respectively). The associated reduced diffusion constants D/D0 = γ0/γ are shown in Fig. 2c and d and 3c and d, respectively. Here, D0 = 3.8 μm2 s−1 denotes the diffusion constant of a single lipid. For all data points the standard deviation of the mean was less than 20%. For better visibility, we have omitted these error bars in Fig. 2 and 3 but provide individual plots of γ/γ0 with error bars in the ESI.†
 | ||
| Fig. 2 Friction coefficients γ of anchored proteins (normalized to a single lipid’s friction, γ0) increase with the length L of the extra-membrane domain and the overall protein area fraction ϕ. (a) A linear scaling γ ∼ L is seen for all the tested area fractions (simulation data for ϕ = 0.0594, 0.1188, 0.1782, 0.2376, 0.2970, and 0.3564 shown as red, blue, grey, orange, green, and magenta symbols; bottom to top). (b) For any tested length of the extra-membrane domain, a superlinear dependence of γ on ϕ is observed (simulation data for L = 1.45, 2.35, 3.25, 5.05, and 7.30 nm shown as red, blue, grey, orange, and green symbols; from bottom to top). Full lines in (a) and (b) indicate the best global fit according to eqn (2) (see the main text for details). For better visibility, data have been shifted downwards by the indicated offsets. (c and d) Associated diffusion coefficients, D = kBT/γ (normalized to the diffusion coefficient of a single lipid, D0) decrease in agreement with eqn (3) which is the reciprocal of eqn (2). Colors, lines, and symbols as in (a) and (b), respectively; please note the semi-logarithmic plot style. Data have been shifted downwards by the indicated factors for better visibility. The error bars of γ and D varied with L and ϕ but were always smaller than 20% (see the individual plots of γ/γ0 in the ESI†). | ||
 | ||
| Fig. 3 Friction coefficients γ of transmembrane proteins (normalized to a single lipid friction, γ0) increase with the length L of the extra-membrane domain and the overall protein area fraction ϕ. (a) A linear scaling γ ∼ L is seen for all the tested area fractions (simulation data for ϕ = 0.0594, 0.1188, 0.1782, 0.2376, 0.2970, and 0.3564 shown as red, blue, grey, orange, green, and magenta symbols; bottom to top). (b) For any tested length of the extra-membrane domain, a superlinear dependence of γ on ϕ is observed (simulation data for L = 1.45, 2.35, 3.25, 5.05, and 7.30 nm shown as red, blue, grey, orange, and green symbols; from bottom to top). Full lines in (a) and (b) indicate the best global fit according to eqn (2) (see the main text for details). For better visibility, data have been shifted downwards by the indicated offsets. (c and d) Associated diffusion coefficients, D = kBT/γ (normalized to the diffusion coefficient of a single lipid, D0) decrease in agreement with eqn (3) which is the reciprocal of eqn (2). Colors, lines, and symbols as in (a) and (b), respectively; please note the semi-logarithmic plot style. Data have been shifted downwards by the indicated factors for better visibility. The error bars of γ and D varied with L and ϕ but were always smaller than 20% (see the individual plots of γ/γ0 in the ESI†). | ||
We next aimed at a quantitative description of our data. The protein friction within the membrane can be expected to dominate over frictional contributions in the adjacent fluid due to the very different viscosities of the two environments.20 Hence, we started with a Taylor expansion of γ with respect to L and ϕ:
| γ = (γm + ηL) (1 + b1ϕ + b2ϕ2). | (2) |
Unlike the contribution of the domain length, L, the occupied area fraction, ϕ, may need an expansion up to quadratic order. A linear scaling of the effective viscosity has been derived already by Einstein22 for very dilute systems (ϕ → 0), while nonlinear analytical expressions for the viscosity of colloidal suspensions23 and two-dimensional lattice gases with hard-core interactions24 have been derived later for semidilute conditions. The latter can be approximated well by a quadratic expansion for ϕ < 0.4, the relevant range for our simulation data. Based on eqn (2), our educated guess for the protein diffusion coefficient therefore reads:
 | (3) |
Using eqn (2), we performed a global fitting to all simulation data γ/γ0 in Fig. 2a and b and 3a and b using the nlin function of MatLab. Indeed, friction data for anchored and transmembrane proteins are well described by these global fits. Please note that for fitting the data of transmembrane proteins, the combined length of both soluble domains needs to be inserted for L. Trivially, the goodness of the global fit was preserved when converting γ/γ0 to reduced diffusion coefficients, D/D0 = γ0/γ (Fig. 2c and d and 3c and d). The resulting fit parameters were γm/γ0 = 0.4028, η = 1.0173, b1 = 0.0054, and b2 = 16.9735 for anchored proteins, whereas for transmembrane proteins we found γm/γ0 = 0.7516, η = 0.8516, b1 = 0.004, and b2 = 17.8423. It is worth noting that the twofold higher value of γm/γ0 for transmembrane proteins is anticipated as these proteins are subject to friction in both leaflets of the lipid bilayer, whereas anchored proteins only interact with lipids in one leaflet. Notably, parameters η, b1, and b2 varied much less between both protein types and may be regarded as nearly constant. Given that both protein types were studied in the same lipid bilayer and the surrounding bulk fluid, this result is anticipated.
We note that γm/γ0 is slightly smaller than unity for both protein constructs which implies that for L, ϕ → 0 a protein experiences less friction than a simple lipid. This is clearly unphysical and most likely reflects the aforementioned neglect of hydrodynamic coupling in eqn (2). We also note that the global fits shown in Fig. 2 and 3 are not equally good for the whole range of L and ϕ. Clear deviations are seen, for example, for the smallest value of L. Besides the aforementioned neglect of hydrodynamic coupling between the membrane anchor and the protein extra-membrane domain, also the use of soft potentials and the problem of a low Schmidt number in our DPD simulations may contribute to these deviations. Dropping the condition that all data for varying L, ϕ need to be matched simultaneously, considerably better fits can be obtained at the cost of varying parameters γm, η, b1, and b2. Still, the favorable agreement between fit and our simulation data underlines that eqn (2) (and therefore also eqn (3)) are good heuristic descriptions for the diffusion of proteins with extra-membrane domains of varying length in different crowding situations.
Having found that eqn (2) and (3) agree well with our simulation data, we wondered about its applicability to experimentally obtained diffusion data. At this point we would like to note that only few experimental reports with comparable measurement techniques, membranes, and proteins are available. Nevertheless we have used these, bearing in mind that the few experimental data points only provide a limited test for eqn (3). Studies by Zhang et al.12 and Jacobson et al.13 had reported, for example, on the diffusion coefficients of GPI-linked proteins and membrane-spanning proteins carrying extra-membrane domains of different lengths. Some of the proteins studied in these articles are comparable in shape to model proteins in our simulations.
In ref. 12 diffusion of different chimeric protein constructs was measured in Cos-1 cells. Extra-membrane domains of these constructs were anchored to the plasma membrane either by a GPI-link or by the membrane-spanning domains of VSV-G or MHC class I antigen D. Diffusion coefficients of most constructs had values in the range of 0.1 μm2 s−1, with few constructs being considerably slower. The authors concluded from their measurements that for most constructs no significant interactions of extra-membrane domains with cell surface structures were present, that is, the surfaces of theses domains can be regarded as ‘slippery’. The few cases of strongly reduced diffusivity were attributed to interactions with cellular structures like the actin cortex beneath the plasma membrane. We therefore have not considered the latter.
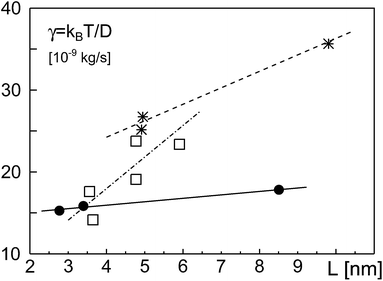
In Fig. 4, we have plotted the friction coefficients γ(L) = kBT/D reported in ref. 12 for proteins with ‘slippery’ extra-membrane domains. The domain length L was calculated by assuming extra-membrane domains to behave as random coils consisting of N amino acids. We gauged the random coil via length and amino acid number of the ectodomain of the protein VSV-G, i.e. L/N3/5 = LVSVG/NVSVG3/5, with LVSVG = 8 nm and NVSVG = 463. Since the protein area fraction ϕ was not reported for the experiments, we fixed ϕ in eqn (2) and (3) for each class of proteins, yielding a fit curve that only depended on L: γ(L) = γeff + ηeffL. Indeed, this linear function yielded good fits for the experimental data found for GPI-linked and membrane-spanning proteins reported in ref. 12 (Fig. 4). While the effective membrane-mediated friction was similar for both datasets (γeff = 1.426 × 10⁻⁸ kg s−1 and γeff = 1.62 × 10⁻⁸ kg s−1), the varying effective viscosities (ηeff = 0.42 Pa s and ηeff = 2.01 Pa s) most likely reflect different types and intensities of interactions between extra-membrane domains. Diffusion data of GPI-anchored and transmembrane isoforms of neural cell adhesion molecules (NCAMs) in 3T3 cells, reported in ref. 13 also were well described by eqn (2) (Fig. 4). Here, fitting parameters assumed the values γeff = 2.57 × 10⁻⁹ kg s−1 and ηeff = 3.85 Pa s. Most likely, the somewhat different values of the fit parameters are due to specific features and interactions of the proteins and/or the various cell types used in the experiments.
 | ||
| Fig. 4 Friction coefficients γ, derived from experimentally determined diffusion coefficients,12,13 grow approximately linearly with the length L of the protein extra-membrane domain. Data for GPI-linked proteins, membrane-spanning proteins, and NCAM proteins are shown as filled circles, asterisks, and open squares, respectively. Best fits according to eqn (2) with constant ϕ, implying γ = γeff + ηeffL, are shown as full, dashed, and dash-dotted lines, respectively. See the main text for discussion. | ||
Notably, in our simulations we found a potential reduction of diffusion coefficients by up to one order of magnitude whereas experimental data from ref. 12 and 13 showed a somewhat smaller reduction of D when the domain length was increased. Yet, in these experiments domain length variations were smaller than in our simulations and effects of apparent protein concentrations were not taken into account. We also would like to emphasize that these few experimental data points cannot thoroughly probe the validity of eqn (2). Rather, the comparison in Fig. 4 only yields a first indication that a linear increase of γ with the length of the extra-membrane domain, L, seems to hold. More experimental data are needed for a more detailed test, preferably taken with the same measurement method and host membrane system, using tunable extra-membrane domain lengths on the same anchor.
In conclusion, we have shown by means of mesoscopic simulations that the friction coefficients γ of membrane proteins with lengthy soluble extra-membrane domains depend on the length of these domains and on the overall protein concentration. Friction increases, i.e. diffusion decreases, with an increasing length L of the soluble domains and an increasing protein area fraction ϕ. Our simulations suggest that eqn (3) provides a good, heuristic description of the diffusion coefficient. Hence, not only the membrane anchor but also extra-membrane domain length and the total concentration of proteins need to be considered when quantifying the diffusion properties of proteins on cellular membranes. We speculate that tuning the diffusion rapidity by changing the effective length of a membrane protein could play a role in processes occurring on cellular membranes: It is conceivable that recruiting or releasing protein co-factors, e.g. during the formation of coated vesicles and/or during auto-phosphorylation cascades of tyrosine kinases on the plasma membrane, could be used as a gear for membrane protein diffusion. As a consequence, encounter times with potential reaction partners would be altered, hence promoting or hampering rapid protein–protein interactions in cellular pathways.
References
- C. Tischer and P. I. Bastiaens, Nat. Rev. Mol. Cell Biol., 2003, 4, 971–974 CrossRef CAS PubMed.
- M. Engstler, T. Pfohl, S. Herminghaus, M. Boshart, G. Wiegertjes, N. Heddergott and P. Overath, Cell, 2007, 131, 505–515 CrossRef CAS PubMed.
- P. G. Saffman and M. Delbrück, Proc. Natl. Acad. Sci., 1975, 72, 3111–3113 CrossRef CAS.
- B. D. Hughes, B. A. Pailthorpe and L. R. White, J. Fluid Mech., 1981, 110, 349–372 CrossRef CAS.
- R. Peters and R. J. Cherry, Proc. Natl. Acad. Sci., 1982, 79, 4317–4321 CrossRef CAS.
- C. C. Lee and N. O. Petersen, Biophys. J., 2003, 84, 1756–1764 CrossRef CAS.
- P. Cicuta, S. Keller and S. Veatch, J. Phys. Chem. B, 2007, 111, 3328–3331 CrossRef CAS PubMed.
- S. Ramadurai, A. Holt, V. Krasnikov, G. van den Bogaart, J. Killian and B. Poolman, J. Am. Chem. Soc., 2009, 131, 1265056 CrossRef PubMed.
- K. Weiss, A. Neef, Q. Van, S. Kramer, I. Gregor and J. Enderlein, Biophys. J., 2013, 105, 455–462 CrossRef CAS PubMed.
- G. Guigas and M. Weiss, Biophys. J., 2006, 91, 2393–2398 CrossRef CAS PubMed.
- D. M. Engelman, Nature, 2005, 438, 578–580 CrossRef CAS PubMed.
- F. Zhang, B. Crise, B. Su, Y. Hou, J. K. Rose, A. Bothwell and K. Jacobson, J. Cell Biol., 1991, 115, 75–84 CrossRef CAS.
- K. A. Jacobson, S. E. Moore, B. Yang, P. Doherty, G. W. Gordon and F. S. Walsh, Biochim. Biophys. Acta, 1997, 1330, 138–144 CrossRef CAS.
- M. Frick, K. Schmidt and B. Nichols, Curr. Biol., 2007, 17, 462 CrossRef CAS PubMed.
- M. Javanainen, H. Hammaren, L. Monticelli, J.-H. Jeon, M. Miettinen, H. Martinez-Seara, R. Metzler and I. Vattulainen, Faraday Discuss., 2013, 161, 397 RSC.
- J. Goose and M. Sansom, PLoS Comput. Biol., 2013, 9, e1003033 CAS.
- G. Guigas, D. Morozova and M. Weiss, Adv. Protein Chem. Struct. Biol., 2011, 85, 143–182 CAS.
- P. Español and P. Warren, Europhys. Lett., 1995, 30, 191 CrossRef.
- P. Nikunen, M. Karttunen and I. Vattulainen, Comput. Phys. Commun., 2003, 153, 407–423 CrossRef CAS.
- O. G. Mouritsen, Life-as a Matter of Fat. The Emerging Science of Lipidomics, Springer Verlag, Berlin, 2005 Search PubMed.
- J. Happel and H. Brenner, Low Reynolds number hydrodynamics : with special applications to particulate media, ed. M. Nijhoff, Distributed by Kluwer Boston, The Hague, Boston Hingham, MA, USA, 1st edn, 1983, p. 553 Search PubMed.
- A. Einstein, Ann. Phys., 1906, 19, 289 CrossRef CAS.
- S. Mueller, E. Llewellin and H. Mader, Proc. R. Soc. A, 2010, 446, 1201–1228 CrossRef.
- H. van Beijeren and R. Kutner, Phys. Rev. Lett., 1985, 55, 238–241 CrossRef CAS.
Footnote |
| † Electronic supplementary information (ESI) available. See DOI: 10.1039/c4sm01846j |
| This journal is © The Royal Society of Chemistry 2015 |

