Multicolor upconversion NaLuF4 fluorescent nanoprobe for plant cell imaging and detection of sodium fluorescein
Zenghui
Chen
a,
Xiaofeng
Wu
*b,
Shigang
Hu
b,
Pan
Hu
b,
Huanyuan
Yan
c,
Zhijun
Tang
b and
Yunxin
Liu
*a
aDepartment of Physics and Electronic Science, Hunan University of Science and Technology, Xiangtan 411201, China. E-mail: lyunxin@163.com
bSchool of Information and Electrical Engineering, Hunan University of Science and Technology, Xiangtan 411201, China. E-mail: xfwuvip@126.com
cCollege of Mechanical and Electrical Engineering, Hunan University of Science and Technology, Xiangtan 411201, China
First published on 8th September 2014
Abstract
Multicolor upconversion NaLuF4 nanocrystals with strong upconversion luminescence and biocompatibility were synthesized by a general solvothermal method and subsequent surface modification. The emission color of these NaLuF4 upconversion nanoparticles can be easily modulated by the doping. These multicolor NaLuF4 upconversion nanocrystals can be employed as fluorescent probes for in vivo biological imaging for living beings, without the need of a slicing process. Importantly, the upconversion nanoprobes (UCNPs) with an acidic ligand can quickly capture the basic sodium fluorescein (SF) in plant cells and form a close UCNPs@SF system. The UCNPs@SF system can emit cyan light due to luminescence resonant energy transfer (LRET) from UCNPs to SF under the excitation of 980 nm infrared light, which is actually composed of the blue emission of NaLuF4:18%Yb3+/0.5%Tm3+ nanoprobes and the green emission of SF. According to the Integral Intensity Ratio of Green to Blue fluorescent signals (IIRGB), the concentration of SF can be easily addressed. The detection limit of sodium fluorescein for this upconversion fluorescent nanoprobe can reach upto 0.14 μg cm−3 in plant cells.
1. Introduction
Fluorescent labeling has numerous applications for imaging biological tissues and cell units at different wavelengths. With this technique the complex biological processes inside or between cells can be observed more clearly and distinguished more accurately, avoiding the slicing process involved in the conventional biological imaging.1–7 Fluorescent labels with high sensitivity, natural affinity, well stability and sharp emission band are very desirable to achieve high and precise detection for cell imaging in vivo or in vitro.8–10 In recent years, there is increasing interest in developing novel materials with high fluorescent signal to noise ratio for cell imaging and for tracing metal ions or organic chemicals in vivo.11,12 Conventional organic dyes and fluorescent proteins have been used for imaging cells and tissues already.13–15 Unfortunately, there are some intrinsic shortcomings limiting their ability for long-term and high-resolution imaging. For example, the strong photo-bleaching produced when used in cell imaging; the broad emission band of organic fluorophores that cannot be well coded for multicolor biological labeling and their rapid metabolic and photo degradation.16,17 Semiconductor quantum dots (such as CdS, CdTe) have also been developed for a new generation of probes for optical labeling and cell imaging.18,19 Though QDs possess high quantum yields, broad ultraviolet (UV) excitation, narrow size-dependent tunable emission bandwidth, high photostability, and long fluorescence lifetime, their potential toxicity and chemical instability are intrinsic limitations for achieving stable and innocuous cell imaging and clinical applications.20–23 In addition, both organic dyes and QDs are excited by UV and visible light, which often induces an inevitable autofluorescence background from biological tissues that leads to low signal to noise ratios. To overcome these drawbacks of organic dyes and QDs, advanced upconversion nanoparticle probes are being developed and are receiving increasing attention.24,25Upconversion luminescence (UCL) is a process where low energy photons (infrared light) are always converted into higher energy ones (visible light) by sequential absorption of two photons or multiphoton. Upconversion nanoparticles have many advantages compared with conventional dyes and quantum dots, such as greater tissue penetration of infrared excitation, intense visible emission, complete absence of autofluorescence from biological tissues, high signal to noise ratio and large Stokes shift. This results in an increasing applicability in cell imaging and clinical therapy.26–28 To date, upconversion nanocrystals with surface modification have been widely reported in HeLa cell imaging in vitro, living mice imaging in vivo, and for monitoring the lymph nodes, tumors, and chemical analytes.17,29–31
In this work, we focus on the application of multicolor upconversion nanoparticles in onion epidermal cell imaging and the detection of sodium fluorescein in onion epidermal cells.32,33 A series of NaLuF4 nanocrystals with controlled particle size and intense luminescence were synthesized via a facile solvent-thermal method that can emit six different colors under a 980 nm laser excitation by varying the dopant concentration.34 Multicolor UCL imaging is demonstrated by labeling onion epidermal cells with these synthesized nanoparticles. On the other hand, we developed an upconversion LRET-based nanosystem composed by NaLuF4:18%Yb3+/0.5%Tm3+ UCNPs and sodium fluorescein (UCNPs@SF), where sodium fluorescein can emit green light by absorbing blue emission from NaLuF4:18%Yb3+/0.5%Tm3+ nanoprobes under the excitation of a 980 nm laser, as shown in Scheme 1. The IIRGB signal is measured to accurately detect the concentration of sodium fluorescein in the onion epidermal cells by a convenient and fast manner without the interference of photobleaching and autofluorescence.35 The LRET-based UCNPs@SF system can be extended to detect other organic dyes and fluorescent proteins in living beings in vivo.
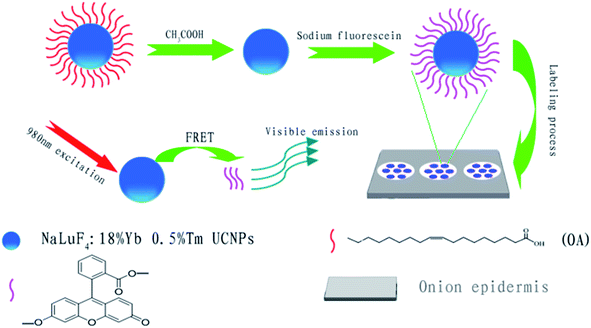 | ||
| Scheme 1 Schematic illustration of LRET-based detection of sodium fluorescein using UCNPs as probes. | ||
2. Experimental
LuCl3·6H2O (99.9%), YbCl3·6H2O (99.9%), TmCl3·6H2O (99.9%), ErCl3·6H2O (99.9%), NaOH (98%), NH4F (98%), methanol (99.5%), 1-octadecene (ODE) (90%), oleic acid (OA) (90%) and sodium fluorescein, were purchased from Sigma Aldrich. Deionized water was used throughout. Unless otherwise noted, all the chemicals were used directly without further purification.2.1 Synthesis of NaLuF4 nanoparticles
In a typical procedure for the synthesis of NaLuF4:Yb3+, Er3+/Tm3+ nanoparticles, 2 ml of a water solution of RECl3·6H2O (0.2 M, RE = Lu, Yb and Er/Tm) was added to a 50 ml flask containing ODE (12 ml) and OA (4 ml). The resulting mixture was heated to 160 °C with constant stirring to remove residual water and oxygen. After 30 min, the temperature was cooled to room temperature using a general flow of argon gas through the reaction flask. Shortly thereafter, 5 ml of methanol solution of NH4F (1.5 mmol) and NaOH (1 mmol) were added, and the resultant solution was stirred for another 30 min at 50 °C. After the methanol from the reaction mixture was evaporated and the solution was heated to 310 °C under an argon atmosphere for 60 min. It was then cooled to room temperature naturally. The resulting nanoparticles were precipitated by the addition of ethanol, collected by centrifugation at 10![[thin space (1/6-em)]](https://www.rsc.org/images/entities/char_2009.gif) 000 rpm for 5 min and washed with ethanol three times. Finally, these prepared nanocrystals could be re-dispersed in nonpolar organic solvent such as cyclohexane and chloroform.
000 rpm for 5 min and washed with ethanol three times. Finally, these prepared nanocrystals could be re-dispersed in nonpolar organic solvent such as cyclohexane and chloroform.
2.2 Characterization of nanoparticles
The size and morphology of the prepared nanoparticles were measured using a H-7650c transmission electron microscopy (TEM) operating at 80 kV and a JEM 3010 high-resolution transmission electron microscopy operating at 200 kV (HRTEM). The photoluminescence (PL) emission spectra was measured from 400 to 700 nm using a Hitachi F-2700 spectrophotometer equipped with a 980 nm laser as the excitation source. The photo of upconversion luminescence was obtained digitally by a Sony multiple CCD camera.Imaging of the nanoparticles uptook by onion epidermal cells was carried out using an Olympus BX43 fluorescence microscopy under the excitation of a NIR 980 nm laser. The power density was 100 mW cm−2 in the front of lens. The multicolor fluorescence was collected by a Tucsen H-694CICE digital camera. All the studies were carried out at room temperature.
3. Results and discussion
3.1 Upconversion fluorescence of NaLuF4 nanoparticles
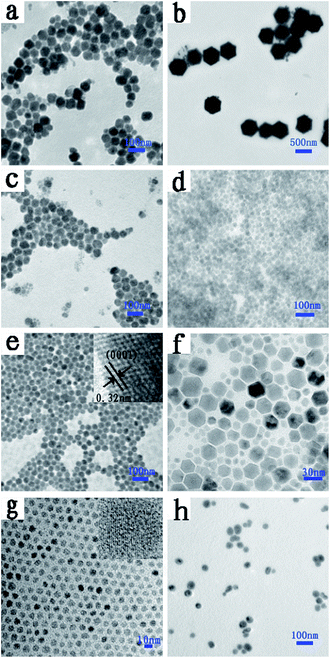
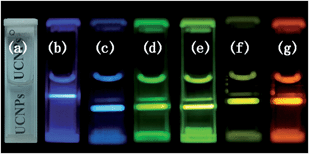
A solvothermal method was employed to synthesize NaLuF4 nanocrystals with controlled particle size. Dopants play a major role in controlling the size and shape of NaLuF4 nanoparticles. To reveal the morphology and size, the synthesized NaLuF4 nanocrystals were characterized by using TEM and high resolution TEM (HRTEM), as shown in Fig. 1. From these TEM images, all the eight kinds of as-prepared nanoparticles appear almost spherical in shape and monodisperse. The average diameters of the prepared NaLuF4 nanoparticles doped with 18%Yb3+/0.5%Tm3+, 18%Yb3+/0.04%Er3+/0.7%Tm3+, 18%Yb3+/2%Er3+, (30, 32, 50, 70 and 90%)Yb3+/1%Er3+ are determined to be about 40 ± 2.6, 600 ± 3.1, 50 ± 1.4, 20 ± 1.0, 30 ± 1, 25 ± 5.2, 7 ± 0.4 and 30 ± 2.4 nm, respectively. As shown in Fig. 1b, uniform hexagonal particles with lager diameters could be obtained by co-doping Er3+ and Tm3+. When the dopant concentration of Yb3+ increases from 30% (Fig. 1d) to 32% (Fig. 1e), the diameter of NaLuF4 nanoparticles increased from ∼20 nm to ∼30 nm. Lu3+ ions (r = 1.117 Å) in NaLuF4 host lattice have been partly substituted by the slightly lager lanthanide ions Yb3+ (r = 1.125 Å). Therefore, the size of the prepared nanocrystals becomes larger than before when controlling over other experimental variables.36 However, when the concentration of Yb3+ increased from 32% to 70% (Fig. 1e–g), the corresponding diameter decreased. In fact, the samples doped with 32% to 70% Yb3+ ions are solid solution composed of NaLuF4 and NaYbF4 crystal phase. There is competition for the nucleation and growth of NaLuF4 and NaYbF4 crystals. It can be inferred from Fig. 1e–f that NaLuF4 and NaYbF4 crystals reach an equivalent nucleation and growth values for the samples at 70% Yb3+ such that the smallest particles are formed with uniform particle size. When the content of Yb3+ is increased to 90%, this equivalence disappeared and almost pure NaYbF4 crystal phase was formed, accompanied with an increase in particle size (see Fig. 1h). These uniform nanoparticles display regular morphology and high crystal quality. A typical high resolution transmission electron microscopy (Fig. 1e, inset) shows the distance between the lattice fringes to be 0.32 nm along (0001) orientation in the NaLuF4 nanocrystals, which also revealed their highly crystalline nature and structural uniformity.The upconversion luminescence spectra of Yb3+/Er3+/Tm3+ co- or tri-doped NaLuF4 nanoparticles were measured under a 980 nm diode laser excitation and shown in Fig. 2 and 3. The luminescence spectrum of NaLuF4:18%Yb3+, 0.5%Tm3+ (Fig. 2a) shows two sharp emission bands centered at 452 nm and 479 nm, which can be assigned to the Tm3+-4fn electronic transitions 1D2 → 3F4 and 1G4 → 3H6, respectively, and show blue light to naked eyes (Fig. 4b). For Yb3+/Er3+/Tm3+ tri-doped NaLuF4 nanoparticles (Fig. 2b), the strongest blue emission peak at 479 nm is attributed to the 1G4 → 3H6 transition of Tm3+, while the green emission peaks at 529 nm and 541 nm are attributed to the 2H11/2 → 4I15/2 and 4S3/2 → 4I15/2 transition of Er3+ ions, respectively, showing cyan light to naked eyes (Fig. 4c). Fig. 2c shows the upconversion luminescence spectrum of NaLuF4:18%Yb3+/2%Er3+ nanocrystal, the dominant green emission peaks at 529 nm and 541 nm can be assigned to the 2H11/2 → 4I15/2 and 4S3/2 → 4I15/2 transition, respectively. The extremely weak red emission peak at 659 nm corresponds to the 4F9/2 → 4I15/2 transition. The co-doped NaLuF4:Yb3+/Er3+ system exhibits green light to naked eyes (Fig. 4d). According to Auzel's theory, the upconversion emission intensity (I) is related to the excitation power (P), that can expressed by the equation I ∝ Pn, where n is the number of the absorbed infrared photons for emitting a visible photon.37 Both green and blue emissions usually involve a two-photon upconversion process (n = 2) because the excitation energy of an infrared photon is inadequate for generating one visible emission photon.5
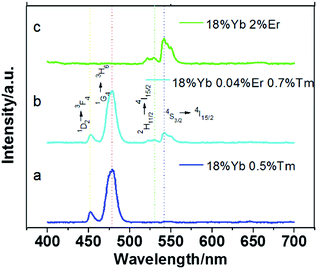 | ||
| Fig. 2 Room-temperature upconversion fluorescent spectra of NaLuF4 doped with (a) 18%Yb3+/0.5%Tm3+, (b) 18%Yb3+/0.04%Er3+/0.7%Tm3+, (c) 18%Yb3+/2%Er3+ under the excitation of a 980 nm laser diode. | ||
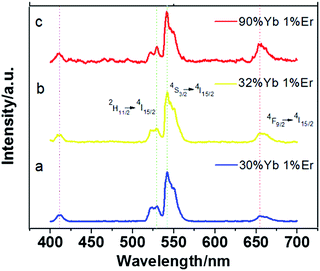 | ||
| Fig. 3 Room-temperature upconversion fluorescent spectra of NaLuF4 doped with (30, 32 and 90%)Yb3+/1%Er3+ under the excitation of a 980 nm laser diode. | ||
To obtain the multicolor output from yellow-green to red emission in the visible region, the UC emissions of NaLuF4:Yb3+, Er3+ nanocrystals is tuned by controlling the dopant concentration of the Yb3+ ion. In Fig. 3, four common emission peaks at 411 nm, 529 nm, 541 nm and 657 nm are observed, which are assigned to the 4F5/2 → 4I15/2, 2H11/2, 4S3/2 → 4I15/2 and 4F9/2 → 4I15/2 transition of Er3+, respectively. Noticeably, the relative intensity of red to green emission gradually increases along with the concentration of Yb3+ ions from 30 mol% to 90 mol%. There are mainly two reasons producing this variation.
First, the energy transfer rate from Yb3+ to Er3+ is improved when the content of Yb3+ ion increases under the excitation of a 980 nm infrared power, which can be theoretically explained according to Dexter's formulation as follows:38
 | (1) |
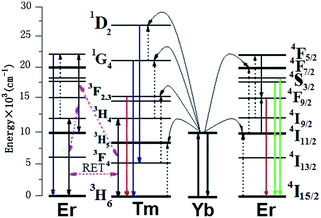 | ||
| Fig. 5 Schematic energy level diagram of upconversion excitation and emission processes and the reversible energy transfer between Er3+ and Tm3+. | ||
Second, when the dopant concentration of Yb3+ ion increases in the heavy doping level, the concentration quenching effect dominates the upconversion emission and leads to the decrease of both green and red emission bands of Er3+ ion. However, it should be noted that the concentration quenching effect has different impact on red and green emissions. On the condition of heavy doping with Yb3+ ion, most of the irradiation energy from Yb3+ ions is consumed by the thermal vibration of crystal lattice such that the electronic population of Er3+-4F7/2 level is obviously decreased. On the other hand, the green light levels (4S3/2/2H11/2) of Er3+ are predominantly depopulated by the upper 4F7/2 level. Thus, the decrease of the electronic population in 4F7/2 level directly leads to the decrease of the electronic population in 4S3/2/2H11/2 levels. Different from the relatively homogeneous population path of green light level (4S3/2/2H11/2), the red light level (4F9/2) has more adequate populating routes. It is not only depopulated by the upper 4F7/2 level and affected by the population of 4F7/2 level, but also simultaneously populated by other more efficient route 4F7/2 + 4I11/2 → 2*4F9/2. Therefore, the heavy doping of Yb3+ ion decreases the green emission more than the red emission of Er3+ ion due to the concentration quenching effect. Of course, this presents a relative increase in red to green emission on the fluorescent spectra.
3.2 Plant cell imaging
Conventional bio-slice imaging technology has been gradually substituted by fluorescent imaging in biological and clinical applications because of its complicated slicing process and strictly limited thickness, which is restricted to the bio-imaging in vitro. Fluorescent bio-imaging has recently been renovated and developed based on the upconversion nanoparticles. The imaging mechanism of upconversion fluorescent imaging is completely different from bio-slice imaging, where the upconversion fluorescence imaging is accomplished by collecting the reflected fluorescent signal from the tissues in vivo or in vitro, while the transmitted light through the flimsy tissue with the slicing process is collected for conventional imaging in vitro. Moreover, upconversion fluorescent imaging employs infrared light as excitation source, which has higher temporal and spatial resolution, absence of auto-fluorescence, and higher penetration depth in tissues (up to 3.2 cm) than the visible light source employed in the conventional slice imaging.39 Because of these advantages, upconversion fluorescent labels have great potential for applications in the field of biological imaging in vivo and in vitro.In our work, fluorescence imaging technique was used for imaging the onion epidermal cells. However, in order to accurately compare with conventional bio-slice imaging by the way of collecting transmitted light, the onion slices were adopted as research objectives for the fluorescence imaging, although the living onion (without the slicing process) can be directly used for fluorescence imaging in vivo in practical biological applications.
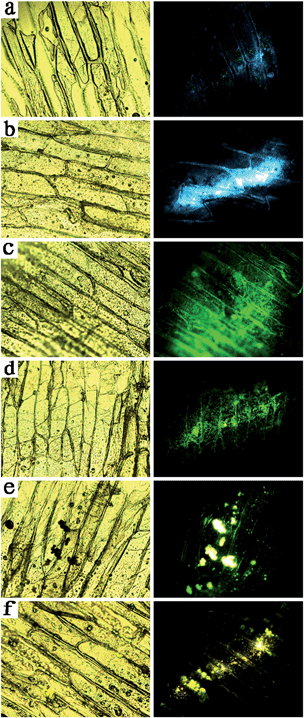
To confirm the feasibility of upconversion nanoprobes, the multicolor bioimaging is conducted on onion epidermal cells incubated with NaLuF4 nanocrystals. First, the onion epidermal slices were dried at 35 °C for one day. Second, an aqueous dispersion of UCNPs was added to the container with the onion epidermal slices, which were incubated for 15 min at 26 °C. The cell imaging was performed by a confocal fluorescence microscopy (Olympus BX43) equipped with a 980 nm NIR diode laser after incubating the samples with different kinds of NaLuF4 nanocrystal aqueous solution. The fluorescent images of the onion epidermal cells with upconversion nanoprobes are shown in Fig. 6, compared with conventional slicing imaging. Fig. 6a shows that the onion epidermal cells exhibited eye-visible blue UC luminescence. In addition, unambiguous cell structure is observed with the assistance of UC fluorescence. The shape and position of the cells overlapped very well in bright and dark field, which indicated good biocompatibility between NaLuF4 nanocrystals and onion epidermal cells. Importantly, the cell wall and cytoplasm can be specifically distinguished by the chiseled fluorescent imaging, since they have different biocompatibility to upconversion nanoprobes.
To change the multicolor upconversion nanoprobes, cyan, green, olivine, yellow, and red images of onion epidermal cells could be obtained, as shown in Fig. 6b–f.
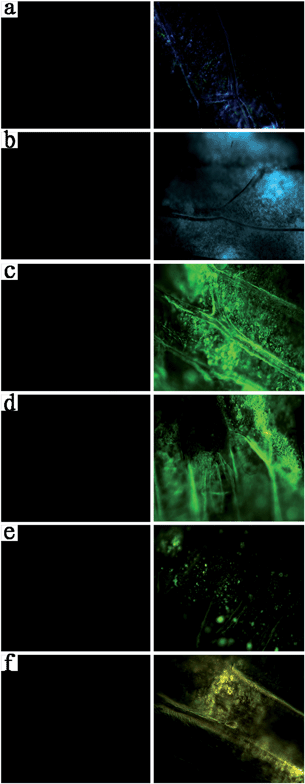
Conventional transmission imaging (left column in Fig. 6) and upconversion fluorescent imaging (right column in Fig. 6) are both capable of presenting the microstructure of the slicing cells in vitro. However, the conventional slicing transmission imaging is incapable of presenting the cell microstructures in vivo. We chose a complete and living onion which was loaded with upconversion nanoprobes in the surface cells by drying and immersing procedures. Fig. 7 shows that upconversion fluorescent nanoprobes can clearly show the cell microstructures (right column in Fig. 7) in vivo, while the conventional transmission imaging has no optical signals (left column in Fig. 7), since it is just suitable for imaging ultrathin slices.
3.3 Detection of sodium fluorescein
Sodium fluorescein is a kind of organic dye which is widely applied as the injection for clinical diagnosis of the cornea. It is almost harmless to humans if the doses are correctly controlled.Here, we show that upconversion fluorescent nanoprobes are efficient and viable for detecting sodium fluorescein in vitro or in vivo, based on a luminescent resonance energy transfer process from UCNPs to sodium fluorescein. The detection limit can reach 0.14 μg ml−1 in solution or 0.14 μg cm−3 in living organisms. More importantly, the detection sensitivity of these LRET based nanoprobes is higher than that of conventional approach by several orders of magnitude, where the blue pump power is directly applied for detecting sodium fluorescein. Furthermore, the merits of these LRET based nanoprobes include deeper penetration of the infrared excitation light, background-free imaging, and high signal to noise ratios.
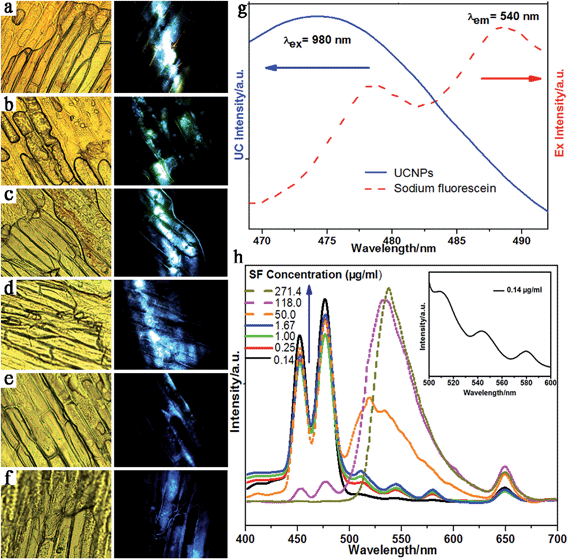
There is a perfect overlap between the excitation spectra of sodium fluorescein and the emission spectra of NaLuF4:18%Yb3+/0.5%Tm3+ nanoparticles in the blue region such that an LRET based sensor system can be successfully constructed by combining the UCNPs with sodium fluorescein, in which UCNPs play the role of energy donor and sodium fluorescein acts as the energy acceptor. It is clear from Fig. 8g that the excitation peak of SF solution is located at 479 nm. Furthermore, the UC emission of NaLuF4 nanoparticles (donors) is centered at 474 nm with a large overlap area with the excitation peaks of sodium fluorescein (acceptor). The UC fluorescent nanoprobes with an acidic ligand (OA) can quickly capture the basic sodium fluorescein in plant cells and form a close UCNPs@SF system. The right column in Fig. 8a–c shows that the UCNPs@SF system can emit cyan light under the excitation of a 980 nm infrared light, which is actually composed of the blue emission of NaLuF4:18%Yb3+/0.5%Tm3+ nanoparticles and green emission of sodium fluorescein. This simultaneously indicates the occurrence of an efficient LRET process.
The fluorescence imaging of onion epidermal cells with UCNPs@SF are depicted in right column of Fig. 8a–f, where the concentration of sodium fluorescein is decreased from 5 to 0 μg ml−1. The fluorescence imaging was collected by a confocal fluorescence microscopy equipped with a 980 nm diode laser as the excitation source. The onion epidermal cell cytoskeleton can be clearly observed with more than 0.625 μg ml−1 of sodium fluorescein, exhibiting bright cyan light to naked eyes. Decreasing the concentration of sodium fluorescein from 5 to 0 μg ml−1, produces a gradual variation from cyan color emission to blue color emission in the cells without the attenuation of comprehensive luminescence intensity.
Fig. 8d shows that blue emission dominates the overall fluorescence because of the relative weaker green emission from sodium fluorescein. On decreasing the concentration of sodium fluorescein to 0, the onion epidermal cells exhibited pure blue color fluorescence without cyan color emission (Fig. 8f). The corresponding UC luminescence spectra of the UCNPs@SF system with various concentrations of sodium fluorescein solution were also investigated in Fig. 8h. There are main peaks located at ∼477 nm, ∼650 nm and ∼537 nm in upconversion fluorescent spectra, which are ascribed to the 1G4 → 3H6, 3F2,3 → 3H6 transition of Tm3+ and exciton recombination radiation in sodium fluorescein achieved by LRET from NaLuF4 nanoparticles (Donors) to sodium fluorescein (Acceptors) in the onion epidermal cells under a 980 nm laser excitation. The red shift of the emission peaks of SF were due to two main reasons: first, dipolymers and polymers were developed by polymerization with increasing concentrations of SF and the excitation energy of their first electronic singlet state is lower than that of monomer. As a result, there exists a red shift for emission wavelength. Second, when adding the SF aqueous solution, the polarity of the solvent was enhanced owing to the elevated amount of water, and the fluorescence emission was gradually substituted by relaxation state emission, which is the other reason for a red shift.
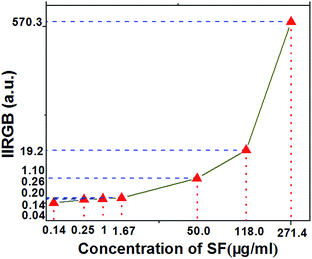
The three emission peaks centered at ∼510 nm, ∼540 nm, and ∼580 nm are assigned to emission of three different isomers of sodium fluorescein when the pH of the solution is about 7. The alkalinity of the whole solution is increased along with the concentration of SF. As a result, there is only one form of SF in solution, corresponding to one emission peak. The peak at around 650 nm originated from the 3F2,3–3H6 transition of Tm3+ ions. In addition, it can be seen from Fig. 8h that the green emission center at 537 nm increases along with the blue emission centered at 477 nm when the concentration of sodium fluorescein increases. Importantly, the integral intensity ratio of green to blue emission (IIRGB) can vary in a large range as shown in Fig. 9e.g., the UCNPs@SF system with 0.14 μg ml−1 has a IIRGB value of 0.04 while the one with 271.4 μg ml−1 has a IIRGB value of 570.3. The concentration of sodium fluorescein can be easily addressed according to IIRGB signal. A wide range of IIRGB values is beneficial to the quick and precise detection of the sodium fluorescein concentration. Employing a 980 nm-diode infrared power source of 0.2 W mm−2, the detection limit of sodium fluorescein can reach 0.14 μg cm−3 in living onion cells, if the concentration of upconversion nanoprobes is properly controlled.
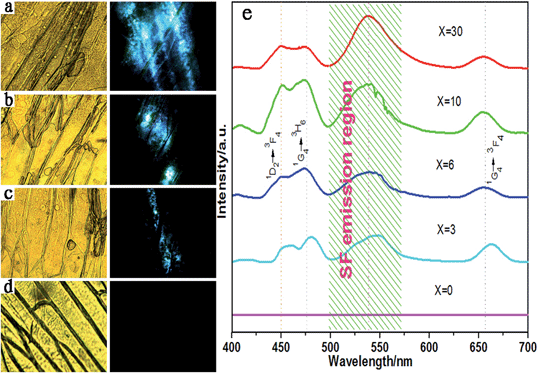
The concentration of NaLuF4 upconversion nanoprobes has also remarkable influence on the detection precision of the UCNPs@SF system. The fluorescent imaging of onion epidermal cells with UCNPs@SF was depicted in the right column of Fig. 10a–d, of which the emission intensity decreases along with the concentration of upconversion nanoprobes. Noticeably, it is observed from Fig. 10d that no fluorescence was detected, which strongly supports the idea that the green emission of sodium fluorescein is excited by the blue light from NaLuF4:Yb3+/Tm3+ upconversion nanoprobes.
UC fluorescent spectra of UCNPs@SF with various concentrations of NaLuF4 nanoparticles are shown in Fig. 10e. All luminescent spectra present four peaks centered at 449 nm, 474 nm, 655 nm (Tm) and ∼538 nm (UCNPs@SF) except the one without upconversion nanoprobes. The three peaks of upconversion nanoprobes were easily attributed to 1D2 → 3F4, 1G4 → 3H6 and 1G4 → 3F4 transition of Tm3+, while the emission peak centered at 538 nm is ascribed to the emission of sodium fluorescein by LRET between UCNPs and SF. Especially, it can be noted that a redshift occurs when the concentration of upconversion nanoprobes decreases from 30 to 3 mg ml−1. Unexpectedly, the IIRGB value is independent on the concentration of upconversion nanoprobes if the concentration of SF is fixed.
4. Conclusions
In conclusion, NaLuF4 upconversion fluorescent nanoprobes with doping were successfully synthesized via the solvothermal method, in which multicolor emission can be efficiently tuned from blue to red under the excitation of a single wavelength infrared light source. There UC fluorescent nanoprobes were subsequently used for imaging the onion epidermal cells and detecting sodium fluorescein in plant cells. For direct fluorescent imaging in vivo, a complete and living onion was loaded with upconversion nanoprobes in the surface cells by drying and immersing procedures. The measured fluorescent images in a confocal fluorescence microscopy indicates that these UC fluorescent nanoprobes can clearly show the cell microstructures in vivo, while the conventional transmission imaging has no detectable optical signals, since it is just suitable for imaging ultrathin slices.We detected sodium fluorescein in plant cells based on a LRET process from UCNPs to SF. The UC fluorescent nanoprobes with an acidic ligand can quickly capture the basic sodium fluorescein in plant cells and forms a close UCNPs@SF system. The measured fluorescent images indicate that the UCNPs@SF system can emit cyan light under the excitation of 980 nm infrared light, which is actually composed by the blue emission of NaLuF4:18%Yb3+/0.5%Tm3+ nanoprobes and green emission of SF. The concentration of SF can be easily addressed according to the IIRGB signal. The wide range of IIRGB values is beneficial to the quick and precise detection of SF concentration. Employing a 980 nm-diode infrared power source of 0.2 W mm−2, the detection limit of SF can reach up to 0.14 μg cm−3 in living onion cells if the concentration of upconversion nanoprobes is properly controlled. Unexpectedly, the IIRGB value is independent on the concentration of upconversion nanoprobes if the concentration of SF is fixed.
This procedure based on LRET process opens a novel route for detecting sodium fluorescein in living organisms and presents promising applications in the clinical diagnosis of the cornea.
Acknowledgements
Financial support from the National Natural Scientific Foundation of China (Grant No. 21301058, 61376076 and 61274026) and in part from Natural Scientific Foundation of Hunan Province (13JJ4080), Research Fund of Hunan Province Science and Technology Department (2014FJ2017) and Hunan Education Department (14B060).Notes and references
- M. Schuelke, Nat. Biotechnol., 2000, 18, 233 CrossRef CAS PubMed.
- M. P. Robin, P. Wilson, A. B. Mabire, J. K. Kiviaho, J. E. Raymond, D. M. Haddleton and R. K. O. Reilly, J. Am. Chem. Soc., 2013, 135, 2875 CrossRef CAS PubMed.
- J. C. Bigge, T. P. Patel, J. A. Bruce, P. N. Goulding, S. M. Charles and R. B. Parekh, Anal. Biochem., 1995, 230, 229 CrossRef CAS PubMed.
- D. Riccardi, P. Schaefer, Y. Yang, H. B. Yu, N. Ghosh, X. Prat-Resina, P. Konig, G. H. Li, D. G. Xu, H. Guo, M. Elstner and Q. Cui, J. Phys. Chem. B, 2006, 110, 6458 CrossRef CAS PubMed.
- F. Wang, D. Banerjee, Y. S. Liu, X. Y. Chen and X. G. Liu, Analyst, 2010, 135, 1839 RSC.
- J. G. White, W. B. Amos and M. Fordham, J. Cell Biol., 1987, 105, 41 CrossRef CAS.
- P. K. Jain, K. S. Lee, I. H. El-Sayed and M. A. El-Sayed, J. Phys. Chem. B, 2006, 110, 7238 CrossRef CAS PubMed.
- H. Li and L. Y. Wang, Analyst, 2013, 138, 1589 RSC.
- Q. Liu, J. J. Peng, L. N. Sun and F. Y. Li, ACS Nano, 2011, 5, 8040 CrossRef CAS PubMed.
- L. Q. Xiong, Z. G. Chen, M. X. Yu, F. Y. Li, C. Liu and C. H. Huang, Biomaterials, 2009, 30, 5592 CrossRef CAS PubMed.
- L. Cheng, K. Yang, Y. G. Li, J. H. Chen, C. Wang, M. W. Shao, S. T. Lee and Z. Liu, Angew. Chem., 2011, 123, 7523 CrossRef.
- C. X. Li, Z. Y. Hou, Y. L. Dai, D. M. Yang, Z. Y. Cheng, P. A. Ma and J. Lin, Biomater. Sci., 2013, 1, 213 RSC.
- G. B. Shan, R. Weissleder and S. A. Hilderbrand, Theranostics, 2013, 3, 276 CrossRef PubMed.
- M. De, S. Rana, H. Akpinar, O. R. Miranda, R. R. Arvizo, U. H. F. Bunz and V. M. Rotello, Nat. Chem., 2009, 1, 461 CrossRef CAS PubMed.
- C. Röcker, M. Pötz, F. Zhang, W. J. Parak and G. U. Nienhaus, Nat. Nanotechnol., 2009, 4, 577 CrossRef PubMed.
- L. Cheng, K. Yang, M. W. Shao, S. T. Lee and Z. Liu, J. Phys. Chem. C, 2011, 115, 2686 CAS.
- M. Wang, C. C. Mi, W. X. Wang, C. H. Liu, Y. F. Wu, Z. R. Xu, C. B. Mao and S. K. Xu, ACS Nano, 2009, 3, 1580 CrossRef CAS PubMed.
- M. D. Garrett, A. D. Dukes, J. R. McBride, N. J. Smith, S. J. Pennycook and S. J. Rosenthal, J. Phys. Chem. C, 2008, 112, 12736 CAS.
- A. M. Saad, M. B. Mohamed, M. T. H. A. Kana and I. M. Azzouz, Opt. Laser Technol., 2013, 46, 1 CrossRef CAS PubMed.
- J. C. Boyera and F. C. J. M. V. Veggel, Nanoscale, 2010, 2, 1417 RSC.
- M. Y. Berezin and S. Achilefu, Chem. Rev., 2010, 110, 2641 CrossRef CAS PubMed.
- L. Q. Xionga, T. S. Yanga, Y. Yanga, C. J. Xub and F. Y. Li, Biomaterials, 2010, 31, 7078 CrossRef PubMed.
- G. Tian, Z. J. Gu, L. J. Zhou, W. Y. Yin, X. X. Liu, L. Yan, S. Jin, W. L. Ren, G. M. Xing, S. J. Li and Y. L. Zhao, Adv. Mater., 2012, 24, 1226 CrossRef CAS PubMed.
- H. Kobayashi, N. Kosaka, M. Ogawa, N. Y. Morgan, P. D. Smith, C. B. Murray, X. C. Ye, J. Collins, G. A. Kumar, H. Bell and P. L. Choyke, J. Mater. Chem., 2009, 19, 6481 RSC.
- F. Wang and X. G. Liu, Acc. Chem. Res., 2014, 47, 1378 CrossRef CAS PubMed.
- S. Haacke, R. A. Taylor, I. B. Joseph, M. J. S. P. Brasil, M. Hartig and B. Deveaud, J. Opt. Soc. Am. B, 1998, 15, 1410 CrossRef CAS.
- Y. H. Chen, J. Z. Zhao, H. M. Guo and L. J. Xie, J. Org. Chem., 2012, 77, 2192 CrossRef CAS PubMed.
- Y. X. Liu, D. S. Wang, J. X. Shi, Q. Peng and Y. Li, Angew. Chem., Int. Ed., 2013, 52, 4366 CrossRef CAS PubMed.
- D. R. Larson, W. R. Zipfe, R. M. Williams, S. W. Clark, M. P. Bruchez, F. W. Wise and W. W. Webb, Science, 2003, 300, 1434 CrossRef CAS PubMed.
- Y. Sun, M. X. Yu, S. Liang, Y. J. Zhang, C. G. Li, T. T. Mou, W. J. Yang, X. Z. Zhang, B. Li, C. H. Huang and F. Y. Li, Biomaterials, 2011, 32, 2999 CrossRef CAS PubMed.
- Z. Q. Li, Y. Zhang and S. Jiang, Adv. Mater., 2008, 20, 4765 CrossRef CAS.
- N. S. Allen and D. T. Brown, Cell Motil. Cytoskeleton, 1988, 10, 153 CrossRef.
- M. L. Winter, M. D. Ellis and W. R. Snodgrass, Ann. Emerg. Med., 1990, 19, 663 CrossRef CAS.
- X. Z. Xiao, G. Z. Lua, S. D. Shen, D. S. Mao, Y. Guo and Y. Q. Wang, Mater. Sci. Eng., B, 2011, 176, 72 CrossRef CAS PubMed.
- P. Zhang, S. Rogelj, K. Nguyen and D. Wheeler, J. Am. Chem. Soc., 2006, 128, 12410 CrossRef CAS PubMed.
- R. D. Shannon, Acta Crystallogr., Sect. A: Cryst. Phys., Diffr., Theor. Gen. Crystallogr., 1976, 32, 751 CrossRef.
- M. Pollnau, D. R. Gamelin, S. R. Luthi, H. U. Gudel and M. P. Hehlen, Phys. Rev. B: Condens. Matter Mater. Phys., 2000, 61, 3337 CrossRef CAS.
- D. J. Dexter, J. Chem. Phys., 1953, 21, 836 CrossRef CAS PubMed.
- G. Y. Chen, J. Shen, T. Y. Ohulchanskyy, N. J. Patel, A. Kutikov, Z. P. Li, J. Song, R. K. Pandey, H. Ågren, P. N. Prasad and G. Han, ACS Nano, 2012, 6, 8280 CrossRef CAS PubMed.
| This journal is © The Royal Society of Chemistry 2015 |

