A portable optical waveguide resonance light-scattering scanner for microarray detection†
Xuefeng
Xing
a,
Wanyao
Liu
b,
Tao
Li
*a,
Shu
Xing
b,
Xueqi
Fu
b,
Dongyang
Wu
a,
Dianjun
Liu
a and
Zhenxin
Wang
*a
aState Key Laboratory of Electroanalytical Chemistry, Changchun Institute of Applied Chemistry, Chinese Academy of Sciences, Changchun, 130022, P. R. China. E-mail: litao@ciac.ac.cn; wangzx@ciac.ac.cn
bEdmond H. Fischer Signal Transduction Laboratory, School of Life Sciences, Jilin University, Changchun 130012, China
First published on 30th October 2015
Abstract
In the present work, a portable and low-cost planar waveguide based resonance light scattering (RLS) scanner (termed as: PW-RLS scanner) has been developed for microarray detection. The PW-RLS scanner employs a 2 × 4 white light emitting diode array (WLEDA) as the excitation light source, a folded optical path with a complementary metal oxide semiconductor (CMOS) as the signal/image acquisition device and stepper motors with gear drives as the mechanical drive system. The biological binding/recognizing events on the microarray can be detected with an evanescent waveguide-directed illumination and light-scattering label (e.g., nanoparticles) while the microarray slide acts as an evanescent waveguide substrate. The performance of the as-developed PW-RLS scanner has been evaluated by analyzing type 2 diabetes mellitus (T2DM) risk genes. Highly selective and sensitive (less than 1% allele frequency at the attomole-level) T2DM risk gene detection is achieved using single-stranded DNA functionalized gold nanoparticles (ssDNA-GNPs) as detection probes. Additionally, the successful simultaneous analysis of 15 T2DM patient genotypes suggests that the device has great potential for the realization of a personalized diagnostic test for a given disease or patient follow-up.
1. Introduction
Microarrays have emerged as one of the most powerful techniques for high throughput screening of various biorecognition events, including DNA hybridization, antigen–antibody binding, and ligand–protein interactions.1–15 Readout systems are a key part of microarray platforms and are used to convert recognition results into computer-readable digital images/signals for quantitative analysis. Currently, fluorescence based scanners/ devices are the most commonly used microarray readout systems which have several potential drawbacks, including poor fluorescence dye photostability (e.g., nonlinear photobleaching) and the requirement of complex and expensive instrumentation.7–15 These inherent defects rooted in fluorescence-based readout systems limits the wide employment of microarray techniques for analyzing practical samples such as clinical samples during routine testing. Since the late 1990s, numerous non-fluorescence detection systems have been employed to improve microarray detection performance.16–28 In particular, metal nanoparticle-based resonance light scattering (RLS) readout systems are attractive due to their ability to offer a reliable and cost-effective alternative to conventional fluorescence dyes.21–28 For instance, Mirkin et al. developed a simple yet powerful spherical nucleic acid–gold nanoparticle (GNP) conjugate based scanometric microRNA (miRNA) microarray platform for rapid and simultaneous quantification of miRNAs, thus providing a highly attractive alternative to current conventional methods.21–23 However, the surface excitation mode is commonly used to generate nanoparticle RLS in the currently available RLS-based microarray scanners. The background noise/signal is normally increased by increasing the excitation light intensity under the surface excitation mode, resulting in significantly reduced detection sensitivity and selectivity. Therefore, there is increasing interest in developing microarray detection systems with other excitation modes to further improve detection performance.The planar waveguide is a technology that has been extensively employed to develop simple and sensitive biosensing platforms for decades.29–35 In these biosensing platforms, light is directed at the bottom of the cartridge (planar plastic/glass slide) via the reader/detector, which allows excitation of the fluorophore labeled antibodies and the sensitive detection of binding events. The optical waveguide excitation mode can significantly reduce the exciting light induced background noise and increase the detection sensitivity.29–31 Recently, several planar waveguide-based microarrays have been successfully fabricated and applied in both environmental and biomedical fields and show great promise in facilitating the manufacturing of multiplex detection systems screening biotoxins and disease biomarkers.36–40 In particular, due to the trends of miniaturization of diagnostic instruments, more and more small-size and low-cost devices with high sensitivity have emerged on the market.41–44 Special attention has been paid to portable and low-cost planar waveguide-based microarray detectors because these may give rise to new opportunities to help physicians treat patients promptly and so improve patient outcome. The development of portable, low-cost planar waveguide microarrays with a RLS readout format may further improve detection sensitivity and provide more convenient personalized diagnostics.
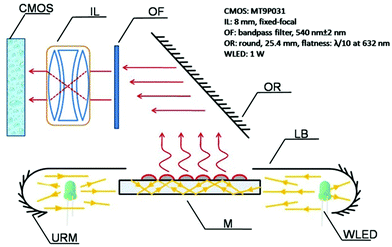
We previously demonstrated the potential of the planar waveguide technology for improving microarray detection sensitivity using a RLS readout format.45 Herein, based on antecedent work, a portable and low-cost planar waveguide-based RLS microarray scanner (termed as: PW-RLS scanner) was successfully fabricated on the basis of the planar waveguide technology which combined an unique folded optical path and a self-designed mechanical drive system. A 2 × 4 white light emitting diode array (WLEDA) was used as a light source and a U-reflective mirror and light barrier were used as the optical plastic system. A 90° folded imaging optical path and fixed-focal lenses were used in the optical imaging system and a complementary metal oxide semiconductor (CMOS) was used as a signal/image acquisition device. Stepper motors and gear drives were used as the mechanical drive system. The as-fabricated PW-RLS scanner demonstrated a high level of performance by simultaneously detecting type 2 diabetes mellitus (T2DM) associated risk genes on a GNP labeled oligonucleotide microarray.
2. Experimental section
2.1 Materials and reagents
All used synthetic single-stranded DNAs (ssDNAs; Tables S1 and S2†) were purchased from Sangon Ltd (Shanghai, China). 15 blood samples were collected from 15 T2DM patients in the clinical laboratory of China Japan Union Hospital, Changchun, China. Institutional Review Board approval was obtained from the Jilin University. A genomic DNA Extraction Kit and multifunction DNA Purification Kit were purchased from BioTeke Co. (Beijing, China). Tetrachloroaurate (HAuCl4) and a silver enhancer solution was acquired from Sigma-Aldrich Chemical Co. (U.S.). Aldehyde 3-D glass slides were obtained from CapitalBio Ltd (Beijing, China), sodium dodecyl sulfonate (SDS) was purchased from Aladdin Industrial Co. (Shanghai, China) and other chemicals used were analytical grade. Milli-Q water (18.2 MΩ cm) was used in all experiments. PCR products were prepared by the standard procedures and GNPs probes [ssDNA conjugated GNPs (ssDNA-GNPs) and peptide-stabilized GNPs] were prepared using our previously reported methods.25–28 (see the additional Experimental section in the ESI† for details)A digital image sensor (parameters: 1/2.5-inch 5-Megapixel CMOS MT9P031, 2592H × 1944 V and pixel size of 2.2 μm) was produced by Micron Technology, Inc. (Idaho, U.S.). The optical reflector (round, 25.4 mm, λ/10 at 632 nm) and optical filter (bandpass filter, center wavelength: 540 nm ± 2 nm) were produced by Newport Co. Ltd (U.S.). 8 mm fixed-focal lenses and the optical extender were produced by CBC Co., Ltd (Tokyo, Japan). Stepper motors and gear drives were produced by Sumtor Electrical Equipment Co. Ltd (Wuxi, China). The chip STM32f207 was produced by STmicroelectronics (Geneva, Switzerland).
2.2 System frame
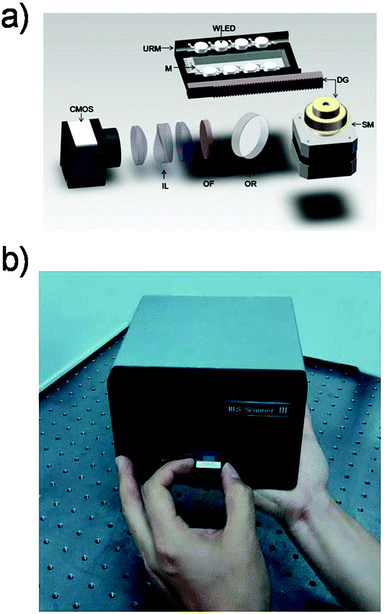
The PW-RLS scanner mainly included the optical module and mechanical motion module. The optical module [a 2 × 4 white light emitting diode array (WLEDA, 1 W)] was used as an excitation light source and a CMOS was used as the signal/image acquisition device. A U-reflective mirror and light barrier were used to shape the WLED light to parallel light prior to input into the long side of the microarray slide. The signal/image acquisition system software was built on Labview (National Instruments Co., U.S.) and the USB 2.0 communication protocol was used to output signals and control the dialogue between the software and hardware (Fig. S1†). In the mechanical motion module, stepper motors and a set of gear drives were used as a mechanical motion unit and controlled by the PC software. The chip STM32f207 was used to decode the USB data and motor control work.2.3 Microarray fabrication
The microarrays (DNA microarray, peptide microarray and protein microarray) were manufactured using standard procedures as previously reported (see the additional Experimental section in the ESI† for details).25–28 For DNA microarrays, alkylamine-modified probe ssDNAs (Table S1†) were dissolved in spotting buffer (3 × SSC, 1.5 M betaine, 0.005% (w/v) SDS) at desired concentrations and spotted onto aldehyde 3-D glass slides. After overnight incubation under 75% humidity at 37 °C, the slide was rinsed with washing buffer (1 × SSC, 0.01% (w/v) SDS) for 1 min and incubated in 30 mL blocking buffer for 1 h at 30 °C to inactivate any free aldehyde groups.After the blocking process, the microarrays were separated into 12 independent subarrays by a PTFE grid and hybridized with target ssDNAs or PCR products at the desired concentration in 20 μL hybridization buffer (4 × SSC, 0.1% (w/v) SDS) for 60 min at 30 °C. Afterward, the slides were subjected to a series of rinses: (I) hybridization buffer for 1 min; (II) washing buffer for 1 min; and (III) Milli-Q water for 1 min. Finally, the slides were dried by centrifugation (480g for 30 s).
For the allele frequency assay, a series of 20 μL mixed solutions of risk target ssDNAs (TnA) and wild target ssDNAs (Tn) (Table S1†) with total 2.5 pM in various ratios (TA![[thin space (1/6-em)]](https://www.rsc.org/images/entities/char_2009.gif) :
:![[thin space (1/6-em)]](https://www.rsc.org/images/entities/char_2009.gif) T = 100
T = 100![[thin space (1/6-em)]](https://www.rsc.org/images/entities/char_2009.gif) :
:![[thin space (1/6-em)]](https://www.rsc.org/images/entities/char_2009.gif) 0, 90
0, 90![[thin space (1/6-em)]](https://www.rsc.org/images/entities/char_2009.gif) :
:![[thin space (1/6-em)]](https://www.rsc.org/images/entities/char_2009.gif) 10, 70
10, 70![[thin space (1/6-em)]](https://www.rsc.org/images/entities/char_2009.gif) :
:![[thin space (1/6-em)]](https://www.rsc.org/images/entities/char_2009.gif) 30, 50
30, 50![[thin space (1/6-em)]](https://www.rsc.org/images/entities/char_2009.gif) :
:![[thin space (1/6-em)]](https://www.rsc.org/images/entities/char_2009.gif) 50, 30
50, 30![[thin space (1/6-em)]](https://www.rsc.org/images/entities/char_2009.gif) :
:![[thin space (1/6-em)]](https://www.rsc.org/images/entities/char_2009.gif) 70, 10
70, 10![[thin space (1/6-em)]](https://www.rsc.org/images/entities/char_2009.gif) :
:![[thin space (1/6-em)]](https://www.rsc.org/images/entities/char_2009.gif) 90, 5
90, 5![[thin space (1/6-em)]](https://www.rsc.org/images/entities/char_2009.gif) :
:![[thin space (1/6-em)]](https://www.rsc.org/images/entities/char_2009.gif) 95, 2
95, 2![[thin space (1/6-em)]](https://www.rsc.org/images/entities/char_2009.gif) :
:![[thin space (1/6-em)]](https://www.rsc.org/images/entities/char_2009.gif) 98, 1
98, 1![[thin space (1/6-em)]](https://www.rsc.org/images/entities/char_2009.gif) :
:![[thin space (1/6-em)]](https://www.rsc.org/images/entities/char_2009.gif) 99, 0.5
99, 0.5![[thin space (1/6-em)]](https://www.rsc.org/images/entities/char_2009.gif) :
:![[thin space (1/6-em)]](https://www.rsc.org/images/entities/char_2009.gif) 99.5, 0.2
99.5, 0.2![[thin space (1/6-em)]](https://www.rsc.org/images/entities/char_2009.gif) :
:![[thin space (1/6-em)]](https://www.rsc.org/images/entities/char_2009.gif) 99.8 and 0
99.8 and 0![[thin space (1/6-em)]](https://www.rsc.org/images/entities/char_2009.gif) :
:![[thin space (1/6-em)]](https://www.rsc.org/images/entities/char_2009.gif) 100 respectively) were added onto the DNA microarrays.
100 respectively) were added onto the DNA microarrays.
For the sensitivity study, various concentrations of risk target ssDNAs (TnA: 0.005 nM, 0.01 nM, 0.05 nM, 0.1 nM, 0.5 nM, 1 nM, 5 nM, 10 nM, 50 nM, 0.1 μM, 0.5 μM, and 1 μM.) and various concentrations of PCR products (50 ng mL−1, 100 ng mL−1, 500 ng mL−1, 1000 ng mL−1) in a 20 μL hybridization buffer were added onto the DNA microarrays.
For PCR products analysis, 1 μg mL−1 PCR products of 6 SNPs of each patient were mixed at an equal volume (the total volume of the mixed solution was 20 μL) and added to different subarrays on the DNA microarrays.
2.4 Attachment of GNPs probes and silver enhancement
After the biorecognition reaction, the microarrays were labeled by GNPs probes (see the additional Experimental section in the ESI† for details). For DNA microarrays, the slides were incubated with 5 nM ssDNA-GNPs (20 μL hybridization buffer each subarray) at 30 °C for 60 min and then washed with hybridization buffer, washing buffer and water as previously described. Next, 1 mL silver enhancer reagent [1![[thin space (1/6-em)]](https://www.rsc.org/images/entities/char_2009.gif) :
:![[thin space (1/6-em)]](https://www.rsc.org/images/entities/char_2009.gif) 1 mixed solutions A (AgNO3) and B (hydroquinone)] was applied to each slide for 8 min and the slides were washed with 30 mL water (3 times), and dried with centrifugation (480g for 30 s).
1 mixed solutions A (AgNO3) and B (hydroquinone)] was applied to each slide for 8 min and the slides were washed with 30 mL water (3 times), and dried with centrifugation (480g for 30 s).
2.5 Data acquisition and processing
The slides were detected using the PW-RLS scanner and commercial Colorimetric scanner (TeleChem International Inc., U.S.). The background intensities from each slide and the average signal intensity from the control samples (the same reactions without analytes) were subtracted to normalize each image prior to evaluation. The mean value and standard deviation of the 12 spot replicates were determined for per sample, with the detection limit determined to be the concentration where the signal/standard deviation = 3. To determine the linear range of each curve, the range of concentrations that best fitted the linear equation y = mx + b were specified.3. Results and discussion
3.1 Design and fabrication of the PW-RLS scanner
The design principle of the PW-RLS scanner is shown in Fig. 1. A WLEDA was employed as the excitation light source. In comparison with traditional light sources, such as xenon or halogen lamps, WLEDA offers two significant advantages: (1) as a cold light source, WLEDA can efficiently minimize the heat dissipation of the device without cooling the system, resulting in a reduced high temperature effect on the light path and equipment stability and (2) the small-size and low-cost of WLEDA can contribute to the miniaturization of the equipment and decreased manufacturing/testing costs of the instrument. Because the WLEDA emits white light at a divergence angle of approximately 120°, the U-reflective mirror and light barrier were used to replace the conventional coupling lens for achieving optical plastic and producing linearly parallel white light. The optical structure involves less loss of light energy than light coupling lenses because it reflects the exciting light repeatedly (Fig. S2†). The homogeneous and collimated parallel white light was projected onto the microarray slide via the two long side edges. The rest of the exciting light is parallel to the microarray, so it does not produce unwanted background noise (Fig. S3†). After carefully adjusting the incidence angle, the planar waveguide was achieved. The chromophores (e.g., GNPs) on the microarray spot can be excited by coupling the evanescent field of the propagating modes, thus generating a strong RLS and reducing the background noise. Due to the light incident generated from both long sides of the microarray slide, non-uniform field effects can be significantly minimized (Fig. S4†).46,47 Additionally, an optical reflector was used to generate a 90° folded imaging optical path, and an optical filter chosen according to the size of GNPs on the microarray spot was used to filter non-central wavelength (Fig. S5 and S6†).47 8 mm fixed-focal lenses matched with an optical extender located in front of CMOS were used to provide high quality focus. The CMOS usually used in the mobile phone camera served as the signal/image acquisition device, resulting in a further reduction in the device size and cost. In order to simplify the instrument structure and decrease the instrument cost, stepper motors and a set of gear drives were used as two main components of the mechanical drive system to provide the linear driving force in the PW-RLS scanner. Taking advantage of these designs, a portable [170 mm (length) × 200 mm (width) × 105 mm (high)] and low-cost (readily available parts and a single device can be built with less than 1000 dollars) device can be fabricated (Fig. 2). The scanning area of the PW-RLS scanner is able to cover the whole microarray slide (26 mm × 75 mm) and it just takes ca. 0.5 s per 2 mm × 2 mm scanning area with 0.79 μm resolution.3.2 Performance study
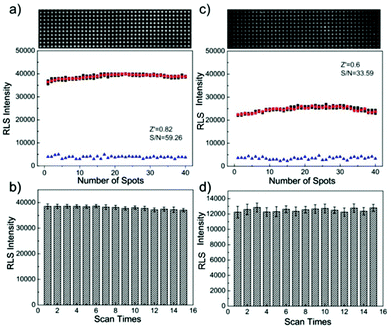
Several biorecognition events on the microarrays (including avidin–biotin interaction, protein binding and DNA hybridization, etc.) have been studied for evaluating the performance of the PW-RLS scanner. In this case, specific recognition of biomolecules were labeled by GNPs and further enhanced with the addition of the electroless deposition of silver onto the GNPs, which had been clearly shown to generate a very strong RLS.21,46,47 As expected, the performance of the PW-RLS scanner was better than that of the commercial scanner regarding the surface excitation mode (Fig. S7–S9†). Under the same experimental conditions, the signal intensity and detection sensitivity of the PW-RLS scanner was higher than that of the commercial scanner. Regarding DNA hybridization (Fig. 3), the signal-to-noise ratio (S/N = 59.26), the Z′ factor (Z′ = 0.82) and the coefficient of variation (CV = 1.48%) were all improved in the PW-RLS scanner relative to the commercial scanner (S/N = 33.59, Z′ = 0.6 and CV = 1.7%).3.3 Application in T2DM multiplex analysis
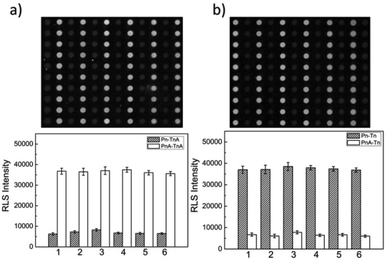
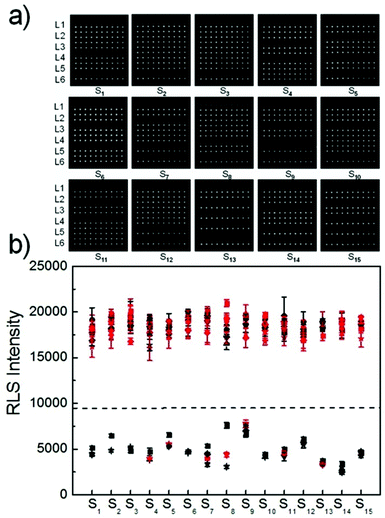
To further evaluate the capabilities of the PW-RLS scanner, six T2DM risk genes (Table S1†) were simultaneously detected on the DNA microarray, due to T2DM being associated with numerous inherited risk single nucleotide polymorphism (SNP) sites.48,49 The RLS signal for the fully complementary DNA was much stronger (6 times) than that of the single-base mismatch DNA, thus indicating that the PW-RLS scanner can be used to analyze SNPs on a DNA microarray (Fig. 4). As shown in Table S3, Fig. S10 and S11,† T2DM risk gene allele frequencies can be detected down to 0.2% in a 4 pmol DNA cocktail. This result indicates that an 8 fmol T2DM risk gene concentration can be selectively identified from a targeted DNA mixture. Additionally, the T2DM risk genes could be detected as low as 100 amol (5 pM in 20 μL reaction solution) with a dynamic range of 3 orders of magnitude (0.1 to 100 nM). Therefore, the microarray detection performance of the PW-RLS scanner proved satisfactory when performing a clinical analysis of T2DM risk genes (i.e., 0.1% in 400 pmol).Encouraged by the aforementioned detection results of mimic samples, clinical T2DM samples were further analyzed by the PW-RLS scanner with a DNA microarray system. In this case, six T2DM risk gene PCR products from 15 T2DM patient blood samples (Table 1; 13 men and 2 women) were analyzed, with the results as shown in Fig. 5. The targeted ssDNA PCR products hybridized readily with the specific probe ssDNA and generated strong RLS signals. For comparison, the PCR products were also determined using conventional Sanger sequencing assays (Fig. S12†), with the SNP genotypes as summarized in Table 1. The PW-RLS scanner results when utilized with a DNA microarray system were highly consistent with the result of the Sanger sequencing assay. Moreover, the RLS signal could be detected down to 50 ng mL−1 of the PCR product per blood sample (Fig. S13†), which is much lower than the detection limit of the Sanger sequencing assay (20 μg mL−1). These experimental results demonstrate that the PW-RLS scanner in conjunction with the DNA microarray system have great promise as a practical detection system that can provide high accuracy and sensitivity.
| No | Age | Sex | rs11196205 | rs11196218 | rs6585205 | rs10946398 | rs10811661 | rs7903146 | ||||||
|---|---|---|---|---|---|---|---|---|---|---|---|---|---|---|
| RLS | Sequencing | RLS | Sequencing | RLS | Sequencing | RLS | Sequencing | RLS | Sequencing | RLS | Sequencing | |||
| S1 | 61 | F | G | G | G/A | G/A | T/G | T/G | C | C | T/C | T/C | C | C |
| S2 | 47 | M | G | G | G/A | G/A | T/G | T/G | C/A | C/A | T/C | T/C | C | C |
| S3 | 49 | M | G | G | G/A | G/A | T/G | T/G | C/A | C/A | T/C | T/C | C | C |
| S4 | 49 | M | G | G | G/A | G/A | T | T | A | A | T/C | T/C | C/T | C/T |
| S5 | 63 | M | G | G | G | G | T/G | T/G | A | A | T/C | T/C | C | C |
| S6 | 40 | M | G | G | G/A | G/A | T | T | C/A | C/A | T | T | C/T | C/T |
| S7 | 60 | M | G | G | G | G | T/G | T/G | C/A | C/A | T | T | C | C |
| S8 | 45 | M | G | G | G/A | G/A | T/G | T/G | A | A | T/C | T/C | C | C |
| S9 | 49 | M | G | G | G/A | G/A | T | T | A | A | T | T | C | C |
| S10 | 63 | F | G | G | G/A | G/A | T | T | C/A | C/A | T/C | T/C | C | C |
| S11 | 59 | M | G | G | G | G | T/G | T/G | C | C | T/C | T/C | C/T | C/T |
| S12 | 44 | M | G | G | G/A | G/A | T/G | T/G | C/A | C/A | T | T | C | C |
| S13 | 48 | M | G | G | G | G | G | G | A | A | T | T | C | C |
| S14 | 64 | M | G | G | G/A | G/A | T | T | C/A | C/A | T | T | C | C |
| S15 | 67 | M | G | G | G | G | T/G | T/G | C | C | T | T | C | C |
4. Conclusions
In summary, a low-cost and portable planar waveguide based RLS scanner (termed as PW-RLS scanner) has been constructed for microarray detection using a fine optical and mechanical motion system design. The results of several well-known biorecognition events on microarrays demonstrate that the PW-RLS scanner exhibits a highly sensitive signal detection capability. In the proof of principle experiment, six T2DM risk genes have been examined and show that the device has great potential to develop microarray-based assays with excellent performance for clinical sample detection and early diagnostic of complex diseases.Acknowledgements
The authors would like to thank the National Natural Science Foundation of China (Grant No. 21127010 and 21205113) and Chinese Academy of Sciences (YZ201355) for financial supports.Notes and references
- G. MacBeath and S. L. Schreiber, Science, 2000, 289, 1760–1763 CAS.
- M. D. Shults, K. A. Janes, D. A. Lauffenburger and B. Imperiali, Nat. Methods, 2005, 2, 277–284 CrossRef CAS PubMed.
- W.-S. Yeo, D.-H. Min, R. W. Hsieh, G. L. Greene and M. Mrksich, Angew. Chem., Int. Ed., 2005, 44, 5480–5483 CrossRef CAS PubMed.
- M. Uttamchandani and S. Q. Yao, Curr. Pharm. Des., 2008, 14, 2428–2438 CrossRef CAS PubMed.
- L. Bodrossy and A. Sessitsch, Curr. Opin. Microbiol., 2004, 7, 245–254 CrossRef CAS PubMed.
- P. Angenendt, Drug Discovery Today, 2005, 10, 503–511 CrossRef CAS PubMed.
- A. H. Sikkema, S. H. Diks, W. F. A. den Dunnen, A. terElst, F. J. G. Scherpen, E. W. Hoving, R. Ruijtenbeek, P. J. Boender, R. de Wijn, W. A. Kamps, M. P. Peppelenbosch and E. S. J. M. de Bont, Cancer Res., 2009, 69, 5987–5995 CrossRef CAS PubMed.
- H. Y. Sun, C. H. S. Lu, M. Uttamchandani, Y. Xia, Y.-C. Liou and S. Q. Yao, Angew. Chem., Int. Ed., 2008, 47, 1698–1702 CrossRef CAS PubMed.
- N. Shao, S. M. Jiang, M. Zhang, J. Wang, S. J. Guo, Y. Li, H. W. Jiang, C. X. Liu, D. B. Zhang, L.T. Yang and S. C. Tao, Anal. Chem., 2014, 86, 1269–1276 CrossRef CAS PubMed.
- H. Qi, F. Wang, V. A. Petrenko and A. Liu, Anal. Chem., 2014, 86, 5844–5850 CrossRef CAS PubMed.
- Z. Tan, W. Lu, X. Li, G. Yang, J. Guo, H. Yu, Z. Li and F. Guan, J. Proteome Res., 2014, 13, 2783–2795 CrossRef CAS PubMed.
- J. Yang, A. Moraillon, A. Siriwardena, R. Boukherroub, F. Ozanam, A. C. Gouget-Laemmel and S. Szunerits, Anal. Chem., 2015, 87, 3721–3728 CrossRef CAS PubMed.
- C. Peng, Z. Li, Y. Zhu, W. Chen, Y. Yuan, L. Liu, Q. Li, D. Xu, R. Qiao, L. Wang, S. Zhu, Z. Jin and C. Xu, Biosens. Bioelectron., 2009, 24, 3657–3662 CrossRef CAS PubMed.
- P. Kozman, A. Lehmann, K. Wunderlich, D. Michel, S. Schumacher, E. Ehrentreich-Förster and F. F. Bier, Biosens. Bioelectron., 2013, 47, 415–420 CrossRef PubMed.
- G. Yoo, J. H. Bong, S. Kim, J. Jose and J. C. Pyun, Biosens. Bioelectron., 2014, 57, 213–218 CrossRef CAS PubMed.
- C. Zhou, S. M. Tabakman, A. P. Goodwin and H. J. Dai, Nat. Biotechnol., 2008, 26, 1285–1292 CrossRef PubMed.
- J. Gantelius, M. Hartmann, J. M. Schwenk, J. Roeraade, H. Andersson-Svahn and T. O. Joos, Nat. Biotechnol., 2009, 26, 269–276 CAS.
- M. Pabst, S. R. Fagerer, R. Köhling, S. K. Küster, R. Steinhoff, M. Badertscher, F. Wahl, P. S. Dittrich, K. Jefimovs and R. Zenobi, Anal. Chem., 2013, 85, 9771–9776 CrossRef CAS PubMed.
- I. E. Sendroiu, L. K. Gifford, A. Lupták and R. M. Corn, J. Am. Chem. Soc., 2011, 133, 4271–4273 CrossRef CAS PubMed.
- A. N. Rao, N. Vandencasteele, L. J. Gamble and D. W. Grainger, Anal. Chem., 2012, 84, 10628–10636 CrossRef CAS PubMed.
- T. A. Taton, C. A. Mirkin and R. L. Letsinger, Science, 2000, 289, 1757–1760 CrossRef CAS PubMed.
- S. I. Stoeva, J.-S. Lee, C. S. Thaxton and C. A. Mirkin, Angew. Chem., Int. Ed., 2006, 45, 3303–3306 CrossRef CAS PubMed.
- A. K. R. Lytton-Jean, M. S. Han and C. A. Mirkin, Anal. Chem., 2007, 79, 6037–6041 CrossRef CAS PubMed.
- D. Kim, W. L. Daniel and C. A. Mirkin, Anal. Chem., 2009, 81, 9183–9187 CrossRef CAS PubMed.
- Z. X. Wang, J. Lee, A. R. Cossins and M. Brust, Anal. Chem., 2005, 77, 5770–5774 CrossRef CAS PubMed.
- T. Li, D. J. Liu and Z. X. Wang, Anal. Chem., 2010, 82, 3067–3072 CrossRef CAS PubMed.
- T. Li, X. Liu, D. J. Liu and Z. X. Wang, Anal. Chem., 2013, 85, 7033–7037 CrossRef CAS PubMed.
- L. Ma, Z. J. Zhu, T. Li and Z. X. Wang, Biosens. Bioelectron., 2014, 52, 118–123 CrossRef CAS PubMed.
- S. J. Choquette, L. Locascio-Brown and R. A. Durst, Anal. Chem., 1992, 64, 55–60 CrossRef CAS.
- D. Stimpson, J. V. Hoijer, W. Hsienh, C. Jou, J. Gordon, T. Theriaults, R. Gambles and J. D. Baldesch wieler, Proc. Natl. Acad. Sci. USA, 1995, 92, 6379–6383 CrossRef CAS.
- D. Stimpson and J. Gondon, Genet. Anal.: Biomol. Eng., 1996, 13, 73–80 CrossRef CAS.
- M. J. Jory, E. Perkins and J. R. Sambles, J. Opt. Soc. Am. A, 2003, 20, 1589–1594 CrossRef PubMed.
- M. Zourob, S. Mohr, B. J. T. Brown, P. R. Fielden, M. B. McDonnellc and N. J. Goddard, Anal. Chem., 2005, 77, 232–242 CrossRef CAS PubMed.
- C. A. Rowe-Taitt, J. W. Hazzard, K. E. Hoffman, J. J. Cras, J. P. Golden and F. S. Ligler, Biosens. Bioelectron., 2000, 15, 579–589 CrossRef CAS PubMed.
- C. Murphy, E. Stack, S. Krivelo, D. A. McPartlin, B. Byrne, C. Greef, M. J. Lochhead, G. Husar, S. Devlin, C. T. Elliott and R. J. O'Kennedy, Biosens. Bioelectron., 2015, 67, 708–714 CrossRef CAS PubMed.
- P. Wu, P. Hogrebe and D. W. Grainger, Biosens. Bioelectron., 2006, 21, 1252–1263 CrossRef CAS PubMed.
- G. Sagarzazu, M. Bedu, L. Martinelli, N. Pelletier, V. I. Safarov, C. Weisbuch, T. Gacoin and H. Benisty, Biosens. Bioelectron., 2009, 24, 2281–2284 CrossRef CAS PubMed.
- M. J. Lochhead, K. Todorof, M. Delaney, J. T. Ives, C. Greef, K. Moll, K. Rowley, K. Vogel, C. Myatt, X. Q. Zhang, C. Logan, C. Benson, S. Reed and R. T. Schooley, J. Clin. Microbiol., 2011, 49, 3584–3590 CrossRef CAS PubMed.
- S. Herranz, M. D. Marazuela and M. C. Moreno-Bondi, Biosens. Bioelectron., 2012, 33, 50–55 CrossRef CAS PubMed.
- S. E. McNamee, C. T. Elliott, B. Greer, M. Lochhead and K. Campbell, Environ. Sci. Technol., 2014, 48, 13340–13349 CrossRef CAS PubMed.
- T. Laksanasopin, T. W. Guo, S. Nayak, A. A. Sridhara, S. Xie, O. O. Olowookere, P. Cadinu, F. Meng, N. H. Chee, J. Kim, C. D. Chin, E. Munyazesa, P. Mugwaneza, A. J. Rai, V. Mugisha, A. R. Castro, D. Steinmiller, V. Linder, J. E. Justman, S. Nsanzimana and S. K. Sia, Sci. Transl. Med., 2015, 273, 1–9 Search PubMed.
- J. Bao and M. G. Bawendi, Nature, 2015, 523, 67–70 CrossRef CAS PubMed.
- K. Garai, M. Muralidhar and S. Maiti, Appl. Opt., 2006, 45, 7538–7542 CrossRef CAS PubMed.
- K. Garai, R. Sureka and S. Maiti, Biophys. J., 2007, 92, L55–L57 CrossRef CAS PubMed.
- X. F. Xing, X. Liu, T. Li and Z. X. Wang, Chin. J. Anal. Chem., 2013, 41, 1458–1462 CrossRef CAS.
- J. Yguerabide and E. E. Yguerabide, J. Cell. Biochem., 2001, 37(Suppl.), 71–81 CrossRef PubMed.
- J. Yguerabide and E. E. Yguerabide, Anal. Biochem., 1998, 262, 137–156 CrossRef CAS PubMed.
- R. Sladek, G. Rocheleau, J. Rung, C. Dina, L. Shen, D. Serre, P. D. Vincent, A. Belisle, S. Hadjadj, B. Balkau, B. Heude, G. Charpentier, J. T. Hudson, A. Montpetit, A. V. Pshezhetsky, M. Prentki, B. I. Posner, D. J. Balding, D. Meyre, C. Polychronakos and P. Froguel, Nature, 2007, 445, 881–885 CrossRef CAS PubMed.
- Y. Wu, H. X. Li, R. J. F. Loos, Z. J. Yu, X. W. Ye, L. H. Chen, A. Pan, F. B. Hu and X. Lin, Diabetes, 2008, 57, 2834–2842 CrossRef CAS PubMed.
Footnote |
| † Electronic supplementary information (ESI) available: Experimental procedures, additional figure, tables and references. See DOI: 10.1039/c5an01839k |
| This journal is © The Royal Society of Chemistry 2016 |

