Proximity hybridization-regulated electrochemical stripping of silver nanoparticles via nanogold induced deposition for immunoassay
Jie
Li
a,
Jie
Wu
a,
Lin
Cui
a,
Mengmeng
Liu
a,
Feng
Yan
b and
Huangxian
Ju
*a
aState Key Laboratory of Analytical Chemistry for Life Science, School of Chemistry and Chemical Engineering, Nanjing University, Nanjing 210023, P.R. China. E-mail: hxju@nju.edu.cn; Fax: +86 25 89683593; Tel: +86 25 89683593
bDepartment of Clinical Laboratory, Nanjing Medical University Cancer Hospital & Jiangsu Cancer Hospital, 42 Baiziting Road, Nanjing 210009, P.R. China. E-mail: yanfeng2007@sohu.com
First published on 20th October 2015
Abstract
A simple and disposable electrochemical immunosensor was developed for sensitive and selective detection of a protein biomarker via target-induced proximity hybridization and electrochemical stripping analysis of silver nanoparticles (AgNPs). The immunosensor was prepared by assembling single-stranded DNA modified gold nanoparticles (ssDNA@AuNPs) on a graphene oxide modified disposable screen-printed carbon electrode (SPCE). In the presence of a target protein and two DNA-labeled antibodies, the proximate complex formed in homogeneous solution could hybridize with the assembled DNA to take away AuNPs, which decreased AuNP-catalyzed deposition of AgNPs on the immunosensor surface, and thus the anodic stripping signal. The proposed method avoided the interference of dissolved oxygen. Using the carcinoembryonic antigen (CEA) as a model analyte, this method showed a linear range of four magnitude orders with a detection limit down to 3.9 pg mL−1. The electrochemical immunosensor possessed preparation convenience, good stability and high sensitivity, and could be extended to sensitive biosensing of other analytes, showing potential application in point-of-care testing.
Introduction
Sensitive and selective detection of cancer biomarkers and cancer cells is of great importance in early clinical diagnosis and biomedical research because of the positive correlation between the levels of tumor biomarkers in serum/tissue and the stages of tumors.1–3 Various immunoassay methods, such as enzyme-linked immunosorbent assay (ELISA),4 and electrochemical,5,6 fluorescent,7 luminescent8 and colorimetric immunoassays,9 have been designed for the detection of protein biomarkers. Due to the high sensitivity, inherent simplicity, portability and low cost, the electrochemical immunoassay methods have attracted considerable interest. This technology has been coupled with a proximity ligation of a pair of oligonucleotide-labeled antibodies in the presence of a target protein for extending its application in point-of-care testing.10–12The proximity ligation assay (PLA) is a recently developed strategy for protein analysis.13 Through a DNA ligation reaction of oligonucleotides, the early detection methods used a pair of proximity probes to bind the target protein and form an amplifiable DNA strand suitable for real-time PCR.13–15 These methods showed the extremely sensitive and specific detection of proteins. By using electrochemical10,16 and chemiluminescent17 readouts, this strategy has conveniently been used for sensitive quantitation of proteins. In these electrochemical PLAs, a DNA strand such as hairpin DNA or an aptamer is covalently immobilized on the electrode surface for capture of the proximity ligation product, which brings the electrochemically active label for signal-on detection. To achieve point-of-care testing, here, a screen-printed carbon electrode (SPCE)18 was used for the immobilization of the DNA strand through the hydrophobic and/or π-stacking interaction between single-stranded DNA (ssDNA) and graphene oxide (GO), and the proximity-dependent surface hybridization led to the release of the immobilized DNA, which produced a signal-off detection strategy.
The readout of the electrochemical signal can generally be performed with electroactive species,12 enzymes, quantum dots19,20 or metallic nanoparticles as the labels. The latter can be directly stripped by anodic oxidation to obtain the current signal.21–24 In comparison with gold nanoparticles (AuNPs), silver nanoparticles (AgNPs) can be electrochemically oxidized at a relatively lower potential with a relatively sharp peak, thus, they are the more favorable signal tags than AuNPs. To improve the sensitivity, these metallic nanoparticles can be used as catalysts to further catalytically deposit AgNPs on the sensor surface.25–27 To introduce the catalytic silver deposition into the electrochemical signal readout, here ssDNA functionalized AuNPs were prepared and immobilized on the GO modified SPCE. Using carcino-embryonic antigen (CEA) that plays a key role in the diagnosis and screening for colon cancer, colorectal cancer and other malignancies28,29 as a model tumor marker, the ssDNA functionalized AuNPs could conveniently detach from the GO surface upon its hybridization with a complementary DNA strand.30 Thus, the target-induced proximity hybridization was introduced to form a proximate complex for the design of a regulated DNA biogate, which provided the complementary DNA strand for the detachment of ssDNA functionalized AuNPs by using two DNA strand-labeled antibodies to recognize the target protein. The formed sequence could hybridize with the immobilized ssDNA to take away AuNPs from the sensor surface, which decreased AuNP-catalyzed deposition of AgNPs and thus the anodic stripping signal (Scheme 1).
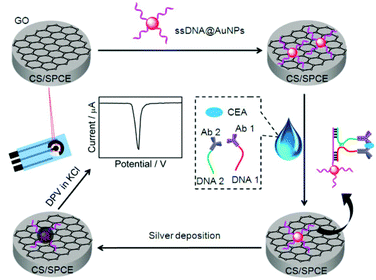 | ||
| Scheme 1 Schematic representation of preparation of immunosensor and detection strategy by stripping analysis of AgNPs catalytically deposited on the immunosensor surface by gold nanolabels. | ||
The electrochemical immunoassay methods for CEA with enzymes or nanomaterials as labels have been extensively developed.31–34 In comparison with these methods, the immunological recognition of the proposed method happened in homogeneous solution, and both the silver deposition enhancement and the well-defined silver stripping peak improved the detection sensitivity. Moreover, the positive potential range for anodic stripping excluded the interference of dissolved oxygen. These advantages greatly improved the analytical performance, thus the proposed method shows potential application for point-of-care testing.
Experimental
Materials and reagents
CEA, anti-CEA antibody (anti-CEA, mouse monoclonal antibodies, clone no. Z-2011 and Z-2012) and prostate-specific antigen (PSA) were purchased from Keybiotech Co. Ltd (Beijing, China). Sulfosuccinimidyl-4-(N-maleimidomethyl) cyclohexane-1-carboxylate (SMCC) was supplied by Heowns Biochem LLC (China), and dithiothreitol (DTT) was from Sangon Biotechnology Co. Ltd (Shanghai, China). Chitosan (CS, ≥95%) and silver enhancer solution were obtained from Sigma-Aldrich Chemical Co. (St. Louis, MO). Chloroauric acid (HAuCl4·4H2O) and trisodium citrate were obtained from Shanghai Reagent Co. (Shanghai, China). GO was obtained from XFNano Materials Tech Co., Ltd (Nanjing, China). Ultrapure water obtained from a Millipore water purification system (≥18 MΩ cm, Milli-Q, Millipore) was used in all assays. TE buffer (10 mM, containing 1 mM EDTA and 0.3 M NaCl, pH 7.9) was used for the preparation of oligonucleotide stock solutions. PBS1 (55 mM, containing 150 mM NaCl and 20 mM EDTA, pH 7.2) and PBS2 (55 mM, containing 150 mM NaCl and 5 mM EDTA, pH 7.2) were used to prepare DNA-labeled antibodies. 10 mM PBS containing 150 mM NaCl (pH 7.4) was used for proximity ligation. The washing buffer was 10 mM (pH 7.4) PBS containing 0.01% Tween-20.Human serum samples were generously provided by Jiangsu Province Tumor Hospital. All DNA oligonucleotides were synthesized by Sangon Inc. (Shanghai, China), and their sequences are given below:
ssDNA for functionalization of AuNPs: 5′-SH-TTTTTTTTTTTTTTTAAGCGATCGATAGTC-3′
DNA 1: 5′-SH-TACGTCCAGAACTTTACCAAACCACACCCTTTTTTTGTCTTGGATCGCTT-3′
DNA 2: 5′-GACTATCATCAAGACTTTTTTTATCACATCAGGCTCTAGCGTATGCTATTG-SH-3′
Instrumentation
The scanning electron microscopy (SEM) images were obtained using an S-4800 scanning electron microscope (Hitachi, Japan). The UV-vis spectra were recorded on a UV-3600 UV-vis-NIR spectrophotometer (Shimadzu Co., Kyoto, Japan). The dynamic light scattering (DLS) measurement was performed with a BI-200SM light scattering apparatus (Brookhaven, U.S.A). Electrochemical experiments, including differential pulse voltammetric (DPV) measurements, were conducted on a CHI 660B electrochemical workstation (Shanghai CH Instruments, China).Preparation of ssDNA@AuNPs
AuNPs of 13 nm diameter were prepared according to the previous protocol.35 15 μL of ssDNA (40 μM) was then mixed with 200 μL of 5.0 nM AuNP solution and incubated for 0.5 h. Afterward, 25 μL of 100 mM PBS (pH 7.4) containing 0.1% Tween-20 was added to the mixture and incubated at room temperature for 20 min. Small aliquots of 2.0 M NaCl in 10 mM PBS (pH 7.4) containing 0.01% Tween-20 were added stepwise to raise the NaCl concentration to 1.0 M, during which 10 s sonication and 20 min incubation were required for each addition step of NaCl. The mixture was incubated over 16 h at room temperature. Subsequently, a centrifugation process was performed to remove the excess oligonucleotides and obtain the DNA functionalized AuNPs (ssDNA@AuNPs), which were resuspended in 200 μL of 10 mM PBS containing 150 mM NaCl, and stored at 4 °C prior to use.Preparation of DNA-labeled antibodies
The DNA-labeled antibodies were prepared using a modified coupling procedure.36 Anti-CEA (2 mg mL−1) first reacted with a 20-fold molar excess of SMCC in PBS1 for 2 h at room temperature. Meanwhile, 12 μL of 100 μM thiolated oligonucleotide (DNA 1 or DNA 2) was reduced with 16 μL of 100 mM DTT in PBS1 at 37 °C for 1 h. The obtained anti-CEA-SMCC and the reduced oligonucleotide were purified by ultrafiltration using a 100 kDa and 10 kDa Millipore respectively (10![[thin space (1/6-em)]](https://www.rsc.org/images/entities/char_2009.gif) 000 rpm, 10 min). Then, the two reaction products were mixed in PBS2 to incubate overnight at 4 °C, and the unreacted anti-CEA and DNA were removed by ultrafiltration using a 100 kDa Millipore (10
000 rpm, 10 min). Then, the two reaction products were mixed in PBS2 to incubate overnight at 4 °C, and the unreacted anti-CEA and DNA were removed by ultrafiltration using a 100 kDa Millipore (10![[thin space (1/6-em)]](https://www.rsc.org/images/entities/char_2009.gif) 000 rpm, 10 min) several times, and the obtained DNA-labeled antibodies were collected in 50 μL of PBS2.
000 rpm, 10 min) several times, and the obtained DNA-labeled antibodies were collected in 50 μL of PBS2.
Preparation of electrochemical sensor
The screen-printed carbon electrode (SPCE) containing a graphite working electrode (2 mm in diameter), a graphite auxiliary electrode and a silver pseudo-reference electrode was prepared according to our previous report.37 The insulating layer printed around the working area constituted an electrochemical microcell.The SPCE was pretreated electrochemically to generate the carboxylic acid groups on the working electrode by cyclic voltammetric scanning between −0.3 and +0.6 V for 10 cycles at 0.5 V s−1 in 0.01 M PBS (pH 7.4).38 Immediately, 2 μL 2.5 mg mL−1 CS was dropped on the working electrode for improving the adhesion force between the electrode and GO. After drying for 15 min, 3 μL of 1 mg mL−1 GO was coated on the chitosan surface and dried in air at room temperature. Then, 5 μL of the prepared ssDNA@AuNPs was cast onto the GO modified SPCE for about 40 min. After washing with washing buffer and pH 7.4 PBS, the SPCE was stored at 4 °C prior to use.
Detection of CEA
The immunoassay was performed by dropping a 5 μL mixture of 250 nM Ab1-DNA1 and Ab2-DNA2, various concentrations of CEA or serum sample on the prepared SPCE. After incubation at 37 °C for 40 min, the SPCE was rinsed with washing buffer and pH 7.4 PBS. Meanwhile, silver enhancer solutions A and B were 20-fold diluted and mixed in equal volumes. Then 3 μL of the mixture of silver enhancer solution was dropped into the electrochemical microcell for 4 min (under dark), followed by rinsing with water. Subsequently, the DPV measurement was performed from −0.15 to +0.25 V at 50 mV s−1 in 1.0 M KCl solution to record the stripping current.Results and discussion
Characterization of ssDNA@AuNPs
The UV-vis spectrum of AuNP solution showed an adsorption peak at 519 nm (Fig. 1A, curve a), from which the diameter of 13 nm was obtained. The DLS measurement of AuNPs showed an average hydrodynamic diameter of 17 nm (Fig. 1B). After the AuNPs were functionalized with ssDNA, the UV-vis spectrum of formed ssDNA@AuNPs showed a red shift of the absorption peak at 531 nm and a new absorption at approximately 260 nm (Fig. 1A, curve b) due to the DNA strand on the AuNP surface (Fig. 1A, curve c), while the hydrodynamic diameter increased to 29 nm (Fig. 1B), suggesting the successful formation of DNA functionalized AuNPs. The DLS results were in good agreement with previous work,39 confirming the good dispersity of ssDNA@AuNPs in aqueous media.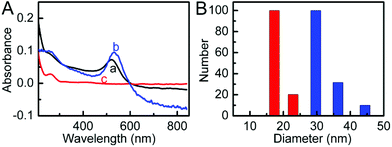 | ||
| Fig. 1 (A) UV-vis absorption spectra (a) AuNPs, (b) ssDNA@AuNPs, and (c) ssDNA, and (B) hydrodynamic diameters of AuNPs (red) and ssDNA@AuNPs (blue). | ||
Characterization of the immunosensor
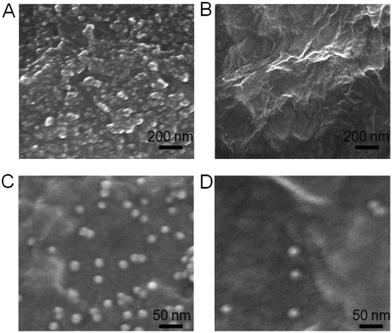
SEM was used to characterize the surface morphologies of the immunosensor before and after proximity ligation. Before coating CS on the working electrode, the bare SPCE showed a rough surface (Fig. 2A). After the SPCE was coated with CS and then GO, the GO could be observed on the immunosensor surface (Fig. 2B), implying that the CS and GO were successfully immobilized on the working electrode. Afterward, the coating of ssDNA@AuNPs on the electrode brought a lot of AuNPs on the surface (Fig. 2C), indicating the assembly of ssDNA@AuNPs on GO via the strong interaction. After the proximity ligation of two DNA labeled antibodies with target CEA and the hybridization of the formed complex with ssDNA, the number of ssDNA@AuNPs on the surface obviously decreased (Fig. 2D). This appearance demonstrated the successful formation of the DNA2-Ab2/target CEA/DNA1-Ab1 complex and its hybridization with ssDNA@AuNPs to weaken the interaction between DNA and GO, which led to the release of AuNPs from the immunosensor surface.Optimization of immunosensor preparation and detection conditions
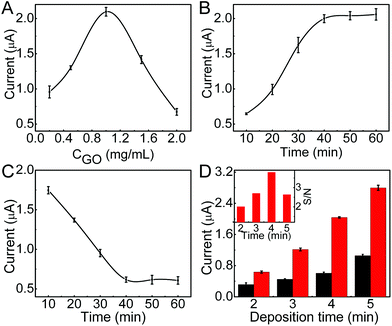
To obtain the excellent analytical performance, the conditions for immunosensor preparation were firstly optimized. Due to the low electric conduction of GO, high concentration of GO would increase the resistance of the immunosensor, thus the DPV stripping current of deposited AgNPs decreased (Fig. 3A). Contrarily, too low concentration of GO could not meet the saturated coverage of ssDNA@AuNPs, which also led to low stripping current. The optimized concentration of GO was 1.0 mg mL−1. On this modified electrode, the stripping current increased with the increasing incubation time of ssDNA@AuNPs and tended toward constant values after an incubation time of 40 min (Fig. 3B), which was used for the preparation of the immunosensor.The time for proximity ligation of the two DNA labeled antibodies with the target protein and hybridization of the ligation product with the immobilized ssDNA@AuNPs played an important role in the immunoassay. The stripping current quickly decreased with the increasing reaction time, indicating the increasing release of AuNPs from the electrode surface (Fig. 3C). The release reached a steady state at about 40 min. Thus, the whole reaction time for proximity ligation and hybridization was selected as 40 min.
In the proposed immunoassay, silver deposition was a key step. The deposition time was optimized with the ratio of signal to noise (inset in Fig. 3D). Here the noise was the stripping current of AgNPs deposited on GO modified SPCE with the same silver deposition step. When the stripping current of the immunosensor increased with the increasing deposition time, the noise also increased (Fig. 3D), and the maximum ratio of signal to noise occurred at a deposition time of 4 min. Thus, 4 min was adopted as the optimal silver deposition time in this work.
Analytical performance of immunosensing method
Under optimal conditions, the DPV response decreased proportionally with the increasing concentration of CEA (Fig. 4A). The calibration plot showed a good linear relationship between the DPV peak current and the logarithmic value of CEA concentration in the range of 0.01 to 100 ng mL−1 with a correlation of 0.9965 (Fig. 4B). The linear regression equation was I (μA) = −0.3549![[thin space (1/6-em)]](https://www.rsc.org/images/entities/char_2009.gif) log[C] (ng mL−1) + 1.3549. The detection limit corresponding to a signal-to-noise ratio of 3 was 3.9 pg mL−1. Such a detection limit was lower than 10 pg mL−1 (ref. 40 and 41) and 5 pg mL−1 (ref. 31) with other signal amplification strategies.
log[C] (ng mL−1) + 1.3549. The detection limit corresponding to a signal-to-noise ratio of 3 was 3.9 pg mL−1. Such a detection limit was lower than 10 pg mL−1 (ref. 40 and 41) and 5 pg mL−1 (ref. 31) with other signal amplification strategies.
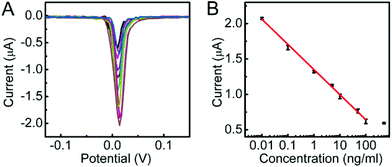 | ||
| Fig. 4 (A) DPV responses to 0, 10−2, 10−1, 1, 5, 10, 50, 100 and 500 ng mL−1 CEA (from high to low) and (B) calibration curve of the proposed method for CEA detection. | ||
The non-specific binding characteristic of the proposed immunoassay was evaluated by comparing the current responses toward solutions containing either CEA or other antigen only, for example prostate-specific antigen (PSA), or a mixture of CEA and PSA. The DPV responses in the absence of both target CEA and PSA and in the presence of only 100 ng mL−1 PSA were 2.28 μA and 2.05 μA, respectively, while the DPV responses to 100 ng mL−1 CEA or the mixture of 100 ng mL−1 PSA and 100 ng mL−1 CEA were 0.641 and 0.638 μA. As expected, the immunoassay method showed obvious response to target CEA, and negligible response to PSA was observed, indicating little non-specific binding of the non-specific antigen. Both the intra-assay and interassay precisions of the immunosensor were examined with 1 ng mL−1 CEA. The relative standard deviations (RSD) for five measurements were 4.3% and 5.8%, respectively, showing good precision and acceptable fabrication reproducibility.
Real sample analysis
To assess the application of the proposed method in complex biological systems, the analysis of CEA in clinical serum samples was carried out. The assay results in five clinical serum samples were in good agreement with the reference values from the commercial electrochemiluminescent single-analyte test as shown in Table 1. The relative errors less than 9.46% indicated that this method possessed good reliability, promising a powerful protocol for point-of-care analysis.| Samples | Proposed method (ng mL−1) | Reference method (ng mL−1) | Relative error (%) |
|---|---|---|---|
| 1 | 0.72 | 0.70 | 1.7 |
| 2 | 1.43 | 1.48 | −3.4 |
| 3 | 4.56 | 4.88 | −6.6 |
| 4 | 19.2 | 17.55 | 9.7 |
| 5 | 90.7 | 95.8 | −5.3 |
Conclusions
A simple electrochemical immunoassay method is proposed by a designed proximity hybridization regulated deposition of AgNPs followed by electrochemical stripping on a disposable immunosensor. The immunosensor can conveniently be prepared by casting ssDNA@AuNPs on a graphene oxide modified SPCE. The homogeneous proximity ligation and the hybridization of the product with the immobilized ssDNA can be completed in a single step. The AuNP catalyzed silver deposition improves the analytical sensitivity. Using CEA as a model target, the proposed assay shows a wide detection, high sensitivity, convenient operability, and acceptable stability and accuracy. This methodology can conveniently be extended to detect a wide range of analytes with available affinity ligands to form the proximate complex and thus provides a great promise in clinical application.Acknowledgements
We gratefully acknowledge the National Natural Science Foundation of China (21375060, 21135002, 21121091) and Priority development areas of the National Research Foundation for the Doctoral Program of Higher Education of China (20130091130005).References
- D. Sidransky, Nat. Rev. Cancer, 2002, 2, 210–219 CrossRef CAS PubMed.
- J. Wu, F. Yan, X. Q. Zhang, Y. T. Yan, J. H. Tang and H. X. Ju, Clin. Chem., 2008, 54, 1481–1488 CAS.
- J. D. Wulfkuhle, L. A. Liotta and E. F. Petricoin, Nat. Rev. Cancer, 2003, 3, 267–275 CrossRef CAS PubMed.
- B. Y. Cao, G. Z. He, H. Yang, H. F. Chang, S. Q. Li and A. P. Deng, Talanta, 2013, 115, 624–630 CrossRef CAS PubMed.
- X. Cao, N. Wang, S. Jia, L. Guo and K. Li, Biosens. Bioelectron., 2013, 39, 226–230 CrossRef CAS PubMed.
- F. Y. Kong, B. Y. Xu, J. J. Xu and H. Y. Chen, Biosens. Bioelectron., 2013, 39, 177–182 CrossRef CAS PubMed.
- J. Y. Hou, T. C. Liu, G. F. Lin, Z. X. Li, L. P. Zou, M. Li and Y. S. Wu, Anal. Chim. Acta, 2012, 734, 93–98 CrossRef CAS PubMed.
- L. X. Zhao, L. Sun and X. G. Chu, Trends Anal. Chem., 2009, 28, 404–415 CrossRef CAS.
- R. D. L. Rica and M. M. Stevens, Nat. Nanotechnol., 2012, 7, 821–824 CrossRef PubMed.
- J. M. Hu, T. Y. Wang, J. Kim, C. Shannon and C. J. Easle, J. Am. Chem. Soc., 2012, 134, 7066–7072 CrossRef CAS PubMed.
- Y. L. Zhang, Y. Huang, J. H. Jiang, G. L. Shen and R. Q. Yu, J. Am. Chem. Soc., 2007, 129, 15448–15449 CrossRef CAS PubMed.
- K. W. Ren, J. Wu, F. Yan and H. X. Ju, Sci. Rep., 2014, 4, 4360–4365 Search PubMed.
- S. Fredriksson, W. Dixon, H. Ji, A. C. Koong, M. Mindrinos and R. W. Davis, Nat. Methods, 2007, 4, 327–329 CAS.
- R. Y. Nong, D. Wu, J. H. Yan, M. Hammond, G. J. Gu, M. Kamali-Moghaddam and U. Landegren, Nat. Protocols, 2013, 8, 1234–1248 Search PubMed.
- T. Z. G. Torre, R. Q. Ke, A. Mezger, P. Svedlindh, M. Stromme and M. Nilsson, Small, 2012, 8, 2174–2177 CrossRef PubMed.
- K. W. Ren, J. Wu, F. Yan, Y. Zhang and H. X. Ju, Biosens. Bioelectron., 2015, 66, 345–349 CrossRef CAS PubMed.
- C. Zong, J. Wu, M. M. Liu, L. L. Yang, L. Liu, F. Yan and H. X. Ju, Anal. Chem., 2014, 86, 5573–5578 CrossRef CAS PubMed.
- J. Wu, F. Yan, J. H. Tang, C. Zhai and H. X. Ju, Clin. Chem., 2007, 53, 1495–1502 CAS.
- L. Chen, C. Chen, R. Li, Y. Li and S. Q. Liu, Chem. Commun., 2009, 2670–2672 RSC.
- G. D. Liu, J. Wang, J. Kim and M. R. Jan, Anal. Chem., 2004, 76, 7126–7130 CrossRef CAS PubMed.
- J. A. Ho, H.-C. Chang, N.-Y. Shih, L.-C. Wu, Y. F. Chang, C.-C. Chen and C. Chou, Anal. Chem., 2010, 82, 5944–5950 CrossRef CAS PubMed.
- X. M. Pei, B. Zhang, J. Tang, B. Q. Liu, W. Q. Lai and D. P. Tang, Anal. Chim. Acta, 2013, 758, 1–18 CrossRef CAS PubMed.
- Y. Wan, Y. Wang, J. Wu and D. Zhang, Anal. Chem., 2010, 83, 648–653 CrossRef PubMed.
- J. Wang, D. K. Xu, A.-N. Kawde and R. Polsky, Anal. Chem., 2001, 73, 5576–5581 CrossRef CAS PubMed.
- X. Chu, X. Fu, K. Chen, G. L. Shen and R. Q. Yu, Biosens. Bioelectron., 2005, 20, 1805–1812 CrossRef CAS PubMed.
- G. S. Lai, J. Wu, H. X. Ju and F. Yan, Adv. Funct. Mater., 2011, 21, 2938–2943 CrossRef CAS.
- B. P. Ting, J. Zhang, M. Khan, Y. Y. Yang and J. Y. Ying, Chem. Commun., 2009, 6231–6233 RSC.
- J. Y. Wang, R. Tang and J. M. Chiang, Dis. Colon Rectum, 1994, 37, 272–277 CrossRef CAS PubMed.
- P. Thomas, A. Gangopadhyay, G. Steele Jr., C. Andrews, H. Nakazato, S. Oikawa and J. M. Jessup, Cancer Lett., 1995, 92, 59–66 CrossRef CAS PubMed.
- O. Zagorodko, J. Spadavecchia, A. Y. Serrano, I. Larroulet, A. Pesquera, A. Zurutuza, R. Boukherroub and S. Szunerits, Anal. Chem., 2014, 86, 11211–11216 CrossRef CAS PubMed.
- Q. Li, D. Tang, J. Tang, B. Su, J. Huang and G. Chen, Talanta, 2011, 84, 538–546 CrossRef CAS PubMed.
- H. W. Shu, W. Wen, H. Y. Xiong, X. H. Zhang and S. F. Wang, Electrochem. Commun., 2013, 37, 15–19 CrossRef CAS.
- G. Q. Sun, J. J. Lu, S. G. Ge, X. R. Song, J. H. Yu, M. Yan and J. D. Huang, Anal. Chim. Acta, 2013, 775, 85–92 CrossRef CAS PubMed.
- D. Tang and J. Ren, Anal. Chem., 2008, 80, 8064–8070 CrossRef CAS PubMed.
- G. S. Lai, F. Yan and H. X. Ju, Anal. Chem., 2009, 81, 9730–9736 CrossRef CAS PubMed.
- O. Söderberg, M. Gullberg, M. Jarvius, K. Ridderstråle, K. Leuchowius, J. Jarvius, K. Wester, P. Hydbring, F. Bahram, L. G. Larsson and U. Landegren, Nat. Methods, 2006, 3, 995–1000 CrossRef PubMed.
- J. Wu, J. H. Tang, Z. Dai, F. Yan, H. X. Ju and N. E. Murr, Biosens. Bioelectron., 2006, 22, 102–108 CrossRef CAS PubMed.
- W. P. Deng, B. Xu, J. Y. Hu, W. Hu, S. P. Song, Z. Feng and C. H. Fan, Sci. Rep., 2013, 3, 1789 Search PubMed.
- L. Tong, J. Wu, J. Li, H. X. Ju and F. Yan, Analyst, 2013, 138, 4870–4876 RSC.
- H. F. Chen, J. A. Tang, B. Su, G. Chen, J. X. Huang and D. P. Tang, Anal. Chim. Acta, 2010, 678, 169–175 CrossRef CAS PubMed.
- Z. Y. Zhong, W. Wu, D. Wang, D. Wang, J. Shan, Y. Qing and Z. Zhang, Biosens. Bioelectron., 2010, 25, 2379–2383 CrossRef CAS PubMed.
| This journal is © The Royal Society of Chemistry 2016 |

