A validated chemiluminescence immunoassay for methotrexate (MTX) and its application in a pharmacokinetic study
Zhaorui
Song
a,
Yufen
Wang
a,
Yaqing
Dong
a,
Kun
Xu
a,
Hao
Long
a,
Chuan
Deng
ab,
Yongmei
Yin
a,
Sergei A.
Eremin
c,
Meng
Meng
*a and
Rimo
Xi
*a
aCollege of Pharmacy, State Key Laboratory of Medicinal Chemical Biology, Tianjin Key Laboratory of Molecular Drug Research, Nankai University, Tianjin 300071, China. E-mail: xirimo@nankai.edu.cn; mengmeng@nankai.edu.cn; Fax: +86-22-23507760; Tel: +86-22-23499986
bTianjin Sungene Biotech Co., Ltd., Tianjin 300450, China
cFaculty of Chemistry, M.V. Lomonosov Moscow State University, Moscow 119991, Russia
First published on 13th November 2015
Abstract
For routine monitoring of the pharmacokinetic behavior of anticancer drug methotrexate (MTX), polyclonal antibodies for MTX were originally produced, and a sensitive chemiluminescence immunoassay (CLIA) was developed for the determination of plasma MTX. Three kinds of coupling reagents (EDC, CDI and isobutyl chloroformate) were utilized to synthesize MTX immunogens. The coupling ratio, titer and sensitivity of polyclonal antibodies for each immunogen were evaluated. Consequently, MTX–EDC–cBSA was found to be the optimal immunogen since it showed the highest coupling ratio and yielded antibodies with the highest sensitivity. Under optimal conditions, the developed CLIA showed a limit of detection (LOD) of 4.3 ng mL−1 in buffer and 9.1 ng mL−1 in plasma with acceptable coefficients of variations (<14.9%). The method exhibited no cross-reaction with the MTX metabolite (7-OH MTX) and structural analogs. When applied in a pharmacokinetic study, the CLIA results were statistically consistent with the HPLC method in measuring key pharmacokinetic parameters (t1/2, Cmax, AUC0–12 and MRT0–12). In conclusion, the CLIA method showed advantages of simple sample preparation, low cost, high sensitivity and good reproducibility. These properties make it a potential tool in the rapid detection of MTX for therapeutic drug monitoring (TDM).
1. Introduction
Methotrexate (MTX), an anti-folate drug, can reduce the transformation of dihydrofolate to tetrahydrofolate by the activity of dihydrofolate reductase (DHFR). As a result, tumor cell proliferation is thus inhibited.1 MTX is effective in treatment of cancer in breast, head and neck, leukemia, lung and neoplasms.2 When administered with a high dose of MTX, patients are probably susceptible to the toxicity of myelo-suppression, gastrointestinal mucositis, nervous system and pulmonary complications.3,4 The safety threshold for MTX usually ranges from 45 ng mL−1 to 900 ng mL−1 in the clinic.4 However, pharmacokinetic properties may vary more than 5-fold among different patients.5 In view of this situation, blood samples need to be tested at least 7 different time points within 24 h to monitor their pharmacokinetic behavior,6–8 so that the dose in MTX chemotherapy can be adjusted until the plasma MTX level reaches an acceptable concentration range.9Analytical methods of HPLC,10–12 RP-HPLC,13,14 surface plasmon resonance (SPR),4 LC-MS/MS,15,16 and capillary electrophoresis (CE)17 have been reported for the detection of the plasma MTX concentration. However, these methods are not suitable for clinical laboratories since they require expensive instruments, specialized operators and complicated sample preparations. Immunoassays could offer on-site analysis based on fast binding of an antigen with its antibody.18–20 Clinical laboratories usually use a fluorescence polarization immunoassay (FPIA) analyzer (TDx™)21 to detect MTX in clinical samples. The FPIA reagent can be only employed along with the TDx™ FPIA analyzer (Abbott Laboratories). The instrument and fluorescence-labeled reagents are expensive, and fluorescent molecules in biological samples could affect FPIA measurements. More importantly, as a key component in an immunoassay, MTX antibodies have not been systematically investigated in terms of immunogen design, titer and specificity. The unnegligible influence of metabolites on the MTX test is still a major problem for the FPIA analyzer. Hence, the development of novel immunosensors for MTX has been greatly limited in TDM.
In this study, we aimed to synthesize three types of immunogens, using ethylcarbodiimide (EDC), carbonyldiimidazole (CDI) and isobutyl chloroformate (IC) as coupling reagents, respectively. Molar ratios of MTX with carrier proteins were measured. The antibody titer, sensitivity and dynamic detection range were evaluated for each group of antibodies. An optimal antibody product was used to develop a chemiluminescence immunoassay (CLIA). The characteristics of this method in terms of sensitivity, specificity, recovery ratios, precision and matrix effect of plasma were studied. The proposed method was validated by a HPLC method, and successfully employed in a pharmacokinetic study for the intravenous (i.v.) administration of MTX in rats. The CLIA method possesses high sensitivity and specificity. The instrumentation and sample preparation are more simple than traditional methods. Therefore, it is a potential screening tool in the rapid detection of MTX in clinical samples. Also, the procedures for MTX antibody preparation are helpful in the development of novel immunoassays for MTX.
2. Materials and methods
2.1 Ethical statement
The animal studies in this work conformed to the guidelines of Chinese Association for Laboratory Animal Sciences, and were approved by the Institutional Review Board at the Nankai University. The animal study did not involve any endangered or protected species. Animals were housed under controlled conditions at a temperature of 22–24 °C for rats and 18–20 °C for rabbits. Humidity was controlled at 40–60%. Rats had free access to solid rodent chow and tapwater, and were housed in a 12 h light–dark cycle. Animals were allowed a one-week acclimatization period before entry into any experimental procedure. The entire laboratory protocol was performed under the surveillance of the Animal Center of the Institute of Surgery Research of Nankai University, China.2.2 Chemicals and reagents
Methotrexate, 7-hydroxymethotrexate (7-OH MTX), tetrahydrofolic acid (THFA), dihydrofolic acid (DHFA), folic acid, vincristine, cyclophosphamide, bovine serum albumin (BSA), ovalbumin (OVA), Freund's complete adjuvant (cFA), Freund's incomplete adjuvant (iFA), 4-dimethylaminopyridine (DMAP), 1-(3-dimethylaminopropyl)ethylcarbodiimide hydrochloride (EDC·HCl), N,N-carbonyldiimidazole (CDI), luminol, and p-iodophenol were supplied by Sigma-Aldrich (St. Louis, MO, USA). Isobutyl chloroformate was obtained from J&K Chemical (J&K Scientific Ltd., Guangdong, China). Goat anti-rabbit IgG labeled with horseradish peroxidase (HRP) was from Tianjin Sungene Biotech Co., Ltd. (Tianjin, China). Polystyrene microtiter plates (96-well) were from Jet Bio-filtration Products, Co., Ltd. (Jet Biofil, Beijing, China). Substrate buffer is a mixture of 0.5 mM luminol, 0.2 mM p-iodophenol and H2O2 (1![[thin space (1/6-em)]](https://www.rsc.org/images/entities/char_2009.gif) :
:![[thin space (1/6-em)]](https://www.rsc.org/images/entities/char_2009.gif) 1
1![[thin space (1/6-em)]](https://www.rsc.org/images/entities/char_2009.gif) :
:![[thin space (1/6-em)]](https://www.rsc.org/images/entities/char_2009.gif) 2, v/v/v).
2, v/v/v).
2.3 Preparation of immunogens and coating antigens
Carrier proteins of BSA and OVA were modified with ethylenediamine to prepare cationized BSA (cBSA) and OVA (cOVA). Therefore, carboxylic acid groups in proteins were converted to primary amino groups, and the conjugation efficiency would increase.22 As shown in Fig. 1, three kinds of coupling reagents (EDC, CDI, IC) were applied to synthesize the activated intermediate of MTX immunogens. For the EDC method, 8.2 mg MTX, 20.5 mg EDC·HCl and 10.4 mg NHS were dissolved in 2 mL of DMF with stirring for 10 h at room temperature. The mixture was then slowly added to 4 mL of PBS (0.1 M, pH 7.4) containing 40 mg cBSA and stirred overnight at room temperature. For the CDI method, 8.2 mg MTX, 6.0 mg CDI and 0.22 mg DMAP were dissolved in 2 mL of DMF and coupled with 40 mg cBSA. For the isobutyl chloroformate (IC) method, 8.2 mg MTX was dissolved into 1 mL of DMF, and then 4.1 μL of triethylamine was added to react for 30 min at 4 °C. Then 5 μL of isobutyl chloroformate was added with stirring at room temperature for 12 h. After that, 50 mg cBSA was added. The products of MTX immunogens were dialyzed against PBS (0.1 M, pH 7.4) for three days, and then in distilled water for three days. Finally, the product was lyophilized and stored at −20 °C. To eliminate the binding of the coating antigen with the MTX antibody, cOVA was employed instead of cBSA in the preparation of the coating antigen. The synthesis procedures for coating antigens were the same as those for immunogens.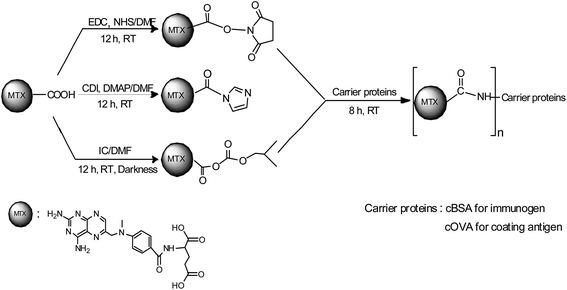 | ||
| Fig. 1 Synthesis of the methotrexate (MTX) immunogen and the coating antigen (IC = isobutyl chloroformate). | ||
2.4 CLIA procedure
Two male New Zealand white rabbits (1–2 kg) were immunized for each type of immunogen, as reported in our previous work.23 Antiserum was allowed to clot at 4 °C overnight, and then centrifuged at 8000 rpm for 15 min. The supernatant was applied in the next experiments.In a checkerboard experiment, the concentration of the coating antigen was optimized to be 1 μg mL−1 and the dilution ratio of the MTX antibody was 1![[thin space (1/6-em)]](https://www.rsc.org/images/entities/char_2009.gif) :
:![[thin space (1/6-em)]](https://www.rsc.org/images/entities/char_2009.gif) 10
10![[thin space (1/6-em)]](https://www.rsc.org/images/entities/char_2009.gif) 000. In a 96-well polystyrene microtiter plate, 100 μL of coating antigen solution (1 μg mL−1) in 0.05 mol L−1 carbonate buffer (pH 9.6) was added into each well and incubated for 2 h at 37 °C. The microtiter plate was washed with washing buffer (PBS containing 0.05% Tween 20) three times and blocked with 250 μL of blocking buffer (PBS containing 1% of OVA and 0.05% Tween 20). After incubation for 2 h, the plate was washed again. Then, 50 μL of MTX solution (0.2–200 μg mL−1) was added into the 96-well microtiter and incubated with 50 μL of diluted antibody solution for 0.5 h at 37 °C. After the washing steps, 100 μL of HRP-conjugated goat anti-rabbit IgG (1
000. In a 96-well polystyrene microtiter plate, 100 μL of coating antigen solution (1 μg mL−1) in 0.05 mol L−1 carbonate buffer (pH 9.6) was added into each well and incubated for 2 h at 37 °C. The microtiter plate was washed with washing buffer (PBS containing 0.05% Tween 20) three times and blocked with 250 μL of blocking buffer (PBS containing 1% of OVA and 0.05% Tween 20). After incubation for 2 h, the plate was washed again. Then, 50 μL of MTX solution (0.2–200 μg mL−1) was added into the 96-well microtiter and incubated with 50 μL of diluted antibody solution for 0.5 h at 37 °C. After the washing steps, 100 μL of HRP-conjugated goat anti-rabbit IgG (1![[thin space (1/6-em)]](https://www.rsc.org/images/entities/char_2009.gif) :
:![[thin space (1/6-em)]](https://www.rsc.org/images/entities/char_2009.gif) 10
10![[thin space (1/6-em)]](https://www.rsc.org/images/entities/char_2009.gif) 000 in PBS) was added and incubated for 0.5 h. After washing the plate, substrate solution was added. One minute later, the CL intensity was measured by using a BHP9504-Microplate Luminometer (Hamamatsu Photon Techniques Inc., Beijing, China).
000 in PBS) was added and incubated for 0.5 h. After washing the plate, substrate solution was added. One minute later, the CL intensity was measured by using a BHP9504-Microplate Luminometer (Hamamatsu Photon Techniques Inc., Beijing, China).
2.5 Method validation by high performance liquid chromatography (HPLC)
High performance liquid chromatography (HPLC) with an Ultimate 3000 liquid chromatography system (Dionex, Sunnyvale, CA, USA) was applied as a reference analysis. An InertSustain C18 column (150 × 4.6 mm i.d., Shimadzu-GL, Shanghai, China) was used, and the mobile phase was a mixture of acetonitrile and 0.025 M sodium acetate–acetic acid buffer (12![[thin space (1/6-em)]](https://www.rsc.org/images/entities/char_2009.gif) :
:![[thin space (1/6-em)]](https://www.rsc.org/images/entities/char_2009.gif) 88, v/v, pH 3.9). The flow rate was 1.0 mL min−1 with detection at 307 nm. An aliquot of 20 μL of the MTX sample was injected into the HPLC system. The peak area of MTX was recorded and the concentration was calculated based on the standard curve.
88, v/v, pH 3.9). The flow rate was 1.0 mL min−1 with detection at 307 nm. An aliquot of 20 μL of the MTX sample was injected into the HPLC system. The peak area of MTX was recorded and the concentration was calculated based on the standard curve.
For analysis of MTX in plasma, 100 μL of plasma sample was mixed with 200 μL of acetonitrile for 1 min. The samples were centrifuged at 8000 rpm for 15 min at 4 °C and a clear supernatant was collected. After being lyophilized, the samples were dissolved in 100 μL of mobile phase and injected into the chromatographic system.
2.6 Application of CLIA in a pharmacokinetic study
Four male Sprague-Dawley (SD) rats (Vital Laboratory Animal Center, Beijing, China), weighing about 200 g, were acclimated for one week in a standardized environment. Under anesthesia, MTX saline (12 mg mL−1) was intravenously (i.v.) injected into rats through the tail vein. One milliliter of blood was collected from the orbital sinus before and at specific time points (0.5, 1, 2, 5, 8, 12, and 24 h) after administration. The blood was placed in a tube containing 10 μL of heparin sodium and centrifuged at 8000 rpm for 15 min (4 °C). The supernatant was stored at −20 °C and used to be analyzed by CLIA and HPLC.3. Results and discussion
3.1 Characterization of immunogens and coating antigens
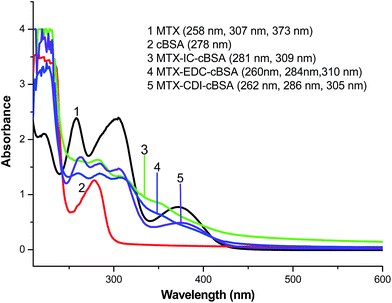
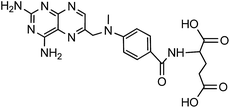
As a small molecule, MTX needs to be coupled with carrier proteins to be immunogenic. Therefore, immunogen design is important for antibody preparation. The carboxyl groups in MTX molecules were conjugated with ε-amino groups in carrier proteins using EDC, CDI and IC as coupling reagents, respectively. The UV spectra (Shimadzu-1800, Kyoto, Japan) of immunogens were recorded. As indicated in Fig. 2, the characteristic absorption peak of MTX is at 307 nm, and cBSA possesses a maximal absorption peak at 278 nm. Three immunogen products showed absorption peaks near 278 nm and 307 nm. These results preliminarily prove the successful conjugation of MTX to cBSA.The molar ratios of MTX to carrier proteins in immunogens and coating antigens were estimated by TNBS assays. The reagent of trinitrobenzene sulfonic acid (TNBS) reacted with ε-amino groups in carrier proteins, resulting in characteristic absorbance at 335 nm. After conjugation with MTX, the absorbance of the carrier at 335 nm decreased. A standard linear relationship for BSA (50–200 μg mL−1) was established: B = 0.0011m − 0.0093 (R2 = 0.9931), where B is the absorbance value of BSA at 335 nm, and m means the amount of BSA. It is reported that BSA and OVA have 59 and 20 TNBS reactive amino groups, respectively, so the number of ε-amino groups in immunogens and coating antigens was calculated. Then, the conjugation ratio of MTX to carrier proteins could be acquired. As shown in Table 1, the immunogen of MTX–EDC–cBSA provided the highest molar content of MTX (35![[thin space (1/6-em)]](https://www.rsc.org/images/entities/char_2009.gif) :
:![[thin space (1/6-em)]](https://www.rsc.org/images/entities/char_2009.gif) 1), which would be beneficial for preparing the MTX antibody with higher quality.
1), which would be beneficial for preparing the MTX antibody with higher quality.
| Sample | ε-Amino groups | Coupling ratio |
|---|---|---|
| BSA | 59 | — |
| cBSA | 72 | — |
| MTX–EDC–cBSA | 37 | 35![[thin space (1/6-em)]](https://www.rsc.org/images/entities/char_2009.gif) : :![[thin space (1/6-em)]](https://www.rsc.org/images/entities/char_2009.gif) 1 1 |
| MTX–CDI–cBSA | 60 | 12![[thin space (1/6-em)]](https://www.rsc.org/images/entities/char_2009.gif) : :![[thin space (1/6-em)]](https://www.rsc.org/images/entities/char_2009.gif) 1 1 |
| MTX–IC–cBSA | 41 | 31![[thin space (1/6-em)]](https://www.rsc.org/images/entities/char_2009.gif) : :![[thin space (1/6-em)]](https://www.rsc.org/images/entities/char_2009.gif) 1 1 |
| OVA | 20 | — |
| cOVA | 53 | — |
| MTX–EDC–cOVA | 21 | 22![[thin space (1/6-em)]](https://www.rsc.org/images/entities/char_2009.gif) : :![[thin space (1/6-em)]](https://www.rsc.org/images/entities/char_2009.gif) 1 1 |
| MTX–CDI–cOVA | 37 | 16![[thin space (1/6-em)]](https://www.rsc.org/images/entities/char_2009.gif) : :![[thin space (1/6-em)]](https://www.rsc.org/images/entities/char_2009.gif) 1 1 |
| MTX–IC–cOVA | 34 | 19![[thin space (1/6-em)]](https://www.rsc.org/images/entities/char_2009.gif) : :![[thin space (1/6-em)]](https://www.rsc.org/images/entities/char_2009.gif) 1 1 |
3.2 Characterization of the CLIA method
The three immunogens were used to produce polyclonal antibodies for MTX, and the antibodies were evaluated in titer, sensitivity and linear range. Combined with different coating antigens, antibody titers were measured as the dilution of antiserum with an absorbance value twice as that for the negative group. The results (Table 2) showed that the titer of antibodies in EDC/NHS groups (1/64![[thin space (1/6-em)]](https://www.rsc.org/images/entities/char_2009.gif) 000 versus MTX–CDI–cOVA and 1/48
000 versus MTX–CDI–cOVA and 1/48![[thin space (1/6-em)]](https://www.rsc.org/images/entities/char_2009.gif) 000 versus MTX–IC–cOVA) was higher than those in other groups, demonstrating the higher concentration of the antibody produced by MTX–EDC–cBSA.
000 versus MTX–IC–cOVA) was higher than those in other groups, demonstrating the higher concentration of the antibody produced by MTX–EDC–cBSA.
| Immunogen | Coating antigen | Antibody titer | CLIA sensitivity (IC50, ng mL−1) | Detection linear range (ng mL−1) |
|---|---|---|---|---|
| MTX–EDC–cBSA | MTX–CDI–cOVA | 1/64![[thin space (1/6-em)]](https://www.rsc.org/images/entities/char_2009.gif) 000 000 |
41.3 | 4.3–392.8 |
| MTX–IC–cOVA | 1/48![[thin space (1/6-em)]](https://www.rsc.org/images/entities/char_2009.gif) 000 000 |
68.3 | 20.7–225.3 | |
| MTX–CDI–cBSA | MTX–EDC–cOVA | 1/20![[thin space (1/6-em)]](https://www.rsc.org/images/entities/char_2009.gif) 000 000 |
161.2 | 41.8–621.0 |
| MTX–IC–cOVA | 1/16![[thin space (1/6-em)]](https://www.rsc.org/images/entities/char_2009.gif) 000 000 |
167.9 | 50.4–686.8 | |
| MTX–IC–cBSA | MTX–EDC–cOVA | 1/40![[thin space (1/6-em)]](https://www.rsc.org/images/entities/char_2009.gif) 000 000 |
93.7 | 17.0–516.5 |
| MTX–CDI–cOVA | 1/32![[thin space (1/6-em)]](https://www.rsc.org/images/entities/char_2009.gif) 000 000 |
109.1 | 15.7–756.6 |
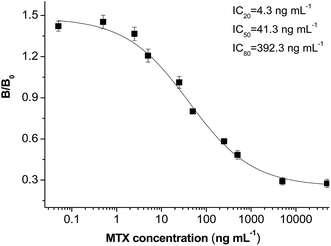
The CLIA methods were developed using antibodies in the group of MTX–EDC–cBSA and the coating antigen of MTX–CDI–cOVA. The results were expressed by percent inhibition as follows: %inhibition = %B/B0, where B is the absorbance value of the MTX sample and B0 is the absorbance value of the blank sample. The sensitivity of the CLIA method was expressed as an IC50 value, the MTX concentration leading to a 50% decrease of B0. Using MTX–CDI–cOVA as the coating antigen, the antibody from MTX–EDC–cBSA showed the highest sensitivity of 41.3 ng mL−1 (Table 2). This optimal CLIA method provided a competitive inhibition curve (Fig. 3), with a limit of detection (LOD, IC20) of 4.3 ng mL−1 obtained. The standard calibration curve is y = 1.131–0.327x, (R2 = 0.993) from 4.3 to 392.8 ng mL−1. Generally, the safety threshold ranges from 45 ng mL−1 to 900 ng mL−1 in clinic, so the proposed method is sensitive enough.
CL kinetic curves were plotted by measuring the CL intensity in MTX solutions (0, 10, 100, and 500 ng mL−1) every minute after the substrate buffer was added. As shown in Fig. 4, in the first 3 min, the CL intensity decreased by 6.4%, 5.1%, 7.9% and 5.5% for standard solutions containing 0, 10, 100 and 500 ng mL−1 MTX, respectively. After 3 min, the intensity reduced dramatically. Therefore, the CL signal should be detected at a fixed time of 3 min after substrate solution was added.
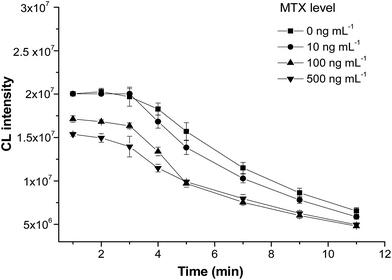 | ||
| Fig. 4 Kinetics of the chemiluminescence reaction against samples with different concentrations of MTX (n = 3). | ||
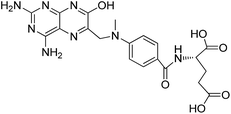
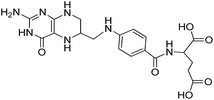
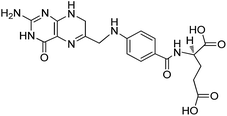
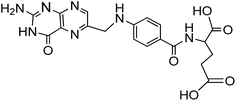
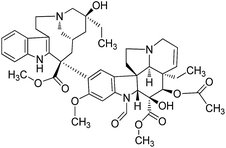
In autoimmunoassay application for TDM of MTX, a major problem is the unnegligible cross-reaction of the MTX antibody with its metabolite, 7-hydroxymethotrexate (7-OH MTX).24 The cross-reaction of the MTX antibody was evaluated among the MTX metabolite (7-OH MTX), structurally related compounds (tetrahydrofolic acid, dihydrofolic acid, folic acid) and functional analogs (vincristine, cyclophosphamide). Cross-reactions (CR) were calculated according to the formula:
| CR (%) = (IC50 of MTX/IC50 of related compounds) × 100% |
As demonstrated in Table 3, the MTX antibody showed no reaction with 7-OH MTX (<0.01%) and structurally similar compounds. These results suggest the good specificity of the MTX antibody, and also indicate the fragment of 2,4-diaminopteridin-6-yl group as a characteristic determinant in MTX antibody production.
For precision assessment, MTX standard solutions (20, 40 and 120 ng mL−1) were measured four times in one day and continued for three days. As shown in Table 4, the intra-assay coefficient of variation (CV) ranged from 1.9% to 14.9% and the inter-assay CV was less than 11.4%. Furthermore, the recoveries in PBS were from 98.7% to 112.1%, which proves that the method is stable and accurate in the PBS system.
| MTX sample (ng mL−1) | Day | Detected MTX (ng mL−1) | Recovery (%) | Intra-assay CV (%) (n = 5) | Inter-assay CV (%) (n = 3) |
|---|---|---|---|---|---|
| In PBS | |||||
| 20 | 1 | 21.3 ± 3.2 | 106.4 | 14.9 | 11.4 |
| 2 | 20.1 ± 1.4 | 105.6 | 7.2 | ||
| 3 | 19.9 ± 1.4 | 99.4 | 1.9 | ||
| 40 | 1 | 44.8 ± 1.4 | 112.1 | 3.1 | 7.4 |
| 2 | 42.9 ± 3.2 | 107.3 | 7.3 | ||
| 3 | 41.0 ± 4.1 | 102.6 | 9.9 | ||
| 120 | 1 | 126.1 ± 4.3 | 105.8 | 3.4 | 4.7 |
| 2 | 118.8 ± 6.2 | 99.0 | 5.2 | ||
| 3 | 118.4 ± 4.2 | 98.7 | 3.5 | ||
![[thin space (1/6-em)]](https://www.rsc.org/images/entities/char_2009.gif) |
|||||
| In plasma | |||||
| 30 | 1 | 29.4 ± 4.3 | 98.0 | 14.6 | 12.7 |
| 2 | 30.6 ± 4.4 | 102.0 | 14.3 | ||
| 3 | 32.2 ± 3.3 | 107.2 | 10.3 | ||
| 60 | 1 | 54.7 ± 3.4 | 91.2 | 6.3 | 7.8 |
| 2 | 56.1 ± 4.7 | 93.5 | 8.4 | ||
| 3 | 56.0 ± 5.6 | 93.3 | 9.9 | ||
| 150 | 1 | 150.3 ± 6.9 | 88.6 | 4.6 | 4.8 |
| 2 | 140.9 ± 5.3 | 94.0 | 3.7 | ||
| 3 | 140.6 ± 5.9 | 97.6 | 4.2 | ||
3.3 Analysis of MTX in plasma
In CLIA analysis, plasma samples are simply diluted to decrease the matrix effect. An appropriate dilution of plasma is important to obtain high sensitivity with a low matrix effect. The blank plasma was diluted at 1![[thin space (1/6-em)]](https://www.rsc.org/images/entities/char_2009.gif) :
:![[thin space (1/6-em)]](https://www.rsc.org/images/entities/char_2009.gif) 10 and 1
10 and 1![[thin space (1/6-em)]](https://www.rsc.org/images/entities/char_2009.gif) :
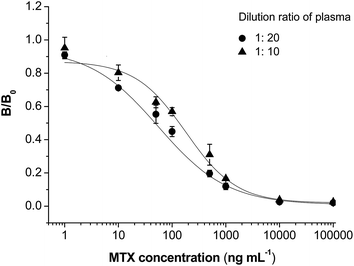
:![[thin space (1/6-em)]](https://www.rsc.org/images/entities/char_2009.gif) 20 to prepare samples with different concentrations of MTX. When analyzed by the CLIA method, a competitive inhibition curve could also be built (Fig. 5). IC50 values were calculated to be 179.7 ng mL−1 and 56.3 ng mL−1 for plasma of 1
20 to prepare samples with different concentrations of MTX. When analyzed by the CLIA method, a competitive inhibition curve could also be built (Fig. 5). IC50 values were calculated to be 179.7 ng mL−1 and 56.3 ng mL−1 for plasma of 1![[thin space (1/6-em)]](https://www.rsc.org/images/entities/char_2009.gif) :
:![[thin space (1/6-em)]](https://www.rsc.org/images/entities/char_2009.gif) 10 and 1
10 and 1![[thin space (1/6-em)]](https://www.rsc.org/images/entities/char_2009.gif) :
:![[thin space (1/6-em)]](https://www.rsc.org/images/entities/char_2009.gif) 20, respectively. Showing a sensitivity close to that in buffer (IC50 = 41.3 ng mL−1), the plasma was diluted 20 folds in the following studies. Twenty samples of blank plasma were analyzed by the CLIA method to calculate an average detected MTX value (average) and standard deviation (σ). The LOD of this method in plasma was calculated to be LOD = average + 3σ. As a result, the LOD value was 9.1 ng mL−1 in blank plasma.
20, respectively. Showing a sensitivity close to that in buffer (IC50 = 41.3 ng mL−1), the plasma was diluted 20 folds in the following studies. Twenty samples of blank plasma were analyzed by the CLIA method to calculate an average detected MTX value (average) and standard deviation (σ). The LOD of this method in plasma was calculated to be LOD = average + 3σ. As a result, the LOD value was 9.1 ng mL−1 in blank plasma.
Three different concentrations of MTX (30, 60 and 150 ng mL−1) were spiked into blank plasma. The samples were detected five times a day and continued for three days to calculate the recovery and coefficient of variations (CVs). As shown in Table 4, analytical recoveries of MTX were 88.6–107.2%. When spiked with a low concentration of MTX (30 ng mL−1), intra-assay and inter-assay CVs were higher than groups with a higher MTX concentration (60 and 150 ng mL−1). CVs in plasma ranged from 3.7% to 14.6% for intra-assay and lower than 12.7% for inter-assay evaluation. These results demonstrate that CLIA for MTX is also credible and stable in plasma.
3.4 Method validation and application of CLIA in a pharmacokinetic study
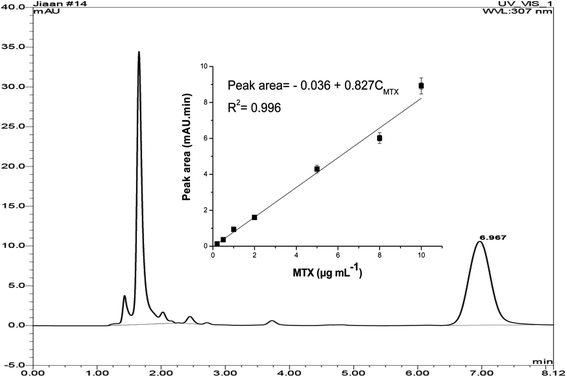
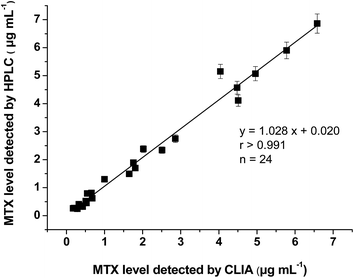
The HPLC method was developed for method validation. In HPLC analysis, MTX could be detected at a retention time of 6.97 min (Fig. 6). In the range of 0.2–10 μg mL−1, a peak area of MTX showed a good linear relationship with the MTX concentration. The limit of quantification (LOQ) of the HPLC method is 200 ng mL−1 towards MTX, which confirms that the proposed CLIA method is much more sensitive.Four Sprague-Dawley (SD) rats were intravenously administered with MTX solutions and plasma samples were taken at seven time points (0.5, 1, 2, 5, 8, 12, and 24 h) after administration. The plasma MTX concentration in these samples was determined by CLIA and HPLC methods. A good correlation of results between two assays was obtained (Fig. 7, r > 0.991), which shows that the CLIA method yields reliable results for monitoring the plasma MTX level.
A typical plasma concentration–time curve was thus plotted for both methods (Fig. 8). A dynamic range of the MTX concentration in the range of 0.2 to 5 μg mL−1 could be detected within 12 h. Pharmacokinetic parameters of the terminal half-life (t1/2), peak plasma concentration (Cmax), mean total area under the plasma concentration–time curve from 0 h to 12 h (AUC0–12) and MRT0–12 were calculated by using a non-compartment model using Drug and Statistics Software (DAS.2.1, Mathematical Pharmacology Professional Committee of China) and analyzed using a paired Student's t-test. There are no significant differences for these parameters between two groups (p > 0.05, Table 5), which confirmed that the CLIA method could be successfully used in pharmacokinetic studies of MTX. Compared with other methods in the determination of MTX in serum or plasma, the CLIA method showed obvious advantageous in rapid detection, wider dynamic range and simple sample preparation (Table 6). On the other hand, the CLIA is as rapid as the TDx™ FPIA analyzer (Abbott Laboratories). These properties make the proposed method a promising tool for the determination of MTX in clinical fields.
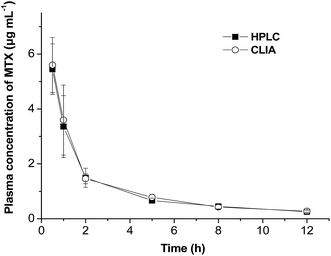 | ||
| Fig. 8 Plasma MTX concentration–time profiles evaluated by CLIA and HPLC methods following i.v. injection of MTX solution (n = 4). | ||
| Parameters | CLIA | HPLC | p value | ||||||||||||||||||||||||||||||||||||||||||||||||||||||||||||||||||||||||||||||||||||||||||||||||
|---|---|---|---|---|---|---|---|---|---|---|---|---|---|---|---|---|---|---|---|---|---|---|---|---|---|---|---|---|---|---|---|---|---|---|---|---|---|---|---|---|---|---|---|---|---|---|---|---|---|---|---|---|---|---|---|---|---|---|---|---|---|---|---|---|---|---|---|---|---|---|---|---|---|---|---|---|---|---|---|---|---|---|---|---|---|---|---|---|---|---|---|---|---|---|---|---|---|---|---|
| a t 1/2, terminal elimination half-life; Cmax, peak plasma concentration; AUC0–12, mean total area under the plasma concentration–time curve from 0 h to 12 h; MRT0–12: mean residual time in vivo from 0 h to 12 h. | |||||||||||||||||||||||||||||||||||||||||||||||||||||||||||||||||||||||||||||||||||||||||||||||||||
| t 1/2 (h) | 3.8 ± 0.9 | 3.4 ± 0.7 | 0.686 | ||||||||||||||||||||||||||||||||||||||||||||||||||||||||||||||||||||||||||||||||||||||||||||||||
| C max (μg mL−1) | 3.4 ± 1.1 | 3.1 ± 0.8 | 0.304 | ||||||||||||||||||||||||||||||||||||||||||||||||||||||||||||||||||||||||||||||||||||||||||||||||
| AUC0–12 (μg × h mL−1) | 13.9 ± 2.8 | 14.6 ± 2.2 | 0.254 | ||||||||||||||||||||||||||||||||||||||||||||||||||||||||||||||||||||||||||||||||||||||||||||||||
| MRT0–12 (h) | 3.3 ± 0.9 | 3.1 ± 0.4 | 0.604 | ||||||||||||||||||||||||||||||||||||||||||||||||||||||||||||||||||||||||||||||||||||||||||||||||
| Assay | Sensitivity (ng mL−1) | Linear range (ng mL−1) | Sample | Sample preparation | Assay durationa (h) | Reference | |||||||||||||||||||||||||||||||||||||||||||||||||||||||||||||||||||||||||||||||||||||||||||||
|---|---|---|---|---|---|---|---|---|---|---|---|---|---|---|---|---|---|---|---|---|---|---|---|---|---|---|---|---|---|---|---|---|---|---|---|---|---|---|---|---|---|---|---|---|---|---|---|---|---|---|---|---|---|---|---|---|---|---|---|---|---|---|---|---|---|---|---|---|---|---|---|---|---|---|---|---|---|---|---|---|---|---|---|---|---|---|---|---|---|---|---|---|---|---|---|---|---|---|---|
| a Assay duration is the time including sample treatment, instrument warming up and detection. | |||||||||||||||||||||||||||||||||||||||||||||||||||||||||||||||||||||||||||||||||||||||||||||||||||
| CLIA | 9.1 | 9.1–728 | Plasma | Dilution | 1.2 h for 60 samples | This work | |||||||||||||||||||||||||||||||||||||||||||||||||||||||||||||||||||||||||||||||||||||||||||||
| SPR | 9.1 | 12.7–227 | Serum | Dilution | >2 | 4 | |||||||||||||||||||||||||||||||||||||||||||||||||||||||||||||||||||||||||||||||||||||||||||||
| HPLC | 12 | 205–16![[thin space (1/6-em)]](https://www.rsc.org/images/entities/char_2009.gif) 700 700 |
Serum | 1. Deproteinization | >1.5 | 10 | |||||||||||||||||||||||||||||||||||||||||||||||||||||||||||||||||||||||||||||||||||||||||||||
| 2. Extraction separation | |||||||||||||||||||||||||||||||||||||||||||||||||||||||||||||||||||||||||||||||||||||||||||||||||||
| RP-HPLC | 50 | 50–5000 | Serum | 1. Adding internal standard | >1.5 | 13 | |||||||||||||||||||||||||||||||||||||||||||||||||||||||||||||||||||||||||||||||||||||||||||||
| 2. Deproteinization | |||||||||||||||||||||||||||||||||||||||||||||||||||||||||||||||||||||||||||||||||||||||||||||||||||
| 3. Neutralization | |||||||||||||||||||||||||||||||||||||||||||||||||||||||||||||||||||||||||||||||||||||||||||||||||||
| CZE-LIF | 0.2 | 2.3–4540 | Serum | 1. Deproteinization | >1 | 17 | |||||||||||||||||||||||||||||||||||||||||||||||||||||||||||||||||||||||||||||||||||||||||||||
| 2. Extraction separation | |||||||||||||||||||||||||||||||||||||||||||||||||||||||||||||||||||||||||||||||||||||||||||||||||||
| 3. Dryness | |||||||||||||||||||||||||||||||||||||||||||||||||||||||||||||||||||||||||||||||||||||||||||||||||||
| 4. Reconstitution | |||||||||||||||||||||||||||||||||||||||||||||||||||||||||||||||||||||||||||||||||||||||||||||||||||
| FPIA analyzer | 22.7 | 22.7–367![[thin space (1/6-em)]](https://www.rsc.org/images/entities/char_2009.gif) 740 740 |
Serum | Dilution | About 0.15 | 21 | |||||||||||||||||||||||||||||||||||||||||||||||||||||||||||||||||||||||||||||||||||||||||||||
4. Conclusion
In this study, a sensitive chemiluminescence immunoassay has been developed for the determination of MTX in plasma. The synthesis of immunogen and production of anti-MTX polyclonal antibodies were firstly reported. The CLIA shows a detection range of 4.3–392.8 ng mL−1 for MTX. The recovery rates and CVs of this method are acceptable in plasma. No cross-reactivity was observed for the MTX antibody to its metabolite 7-OH MTX. The detection results of MTX in plasma by CLIA correlated well with those by the HPLC method. Finally, the CLIA method was used in a pharmacokinetic study for i.v. administration of MTX in rats, and the results are comparable with those of the HPLC method. In summary, CLIA is more fast and convenient than instrumental analysis, therefore exhibits promising potential in preliminary monitoring of MTX in clinical samples.Acknowledgements
This work was supported by the financial support from the International Science & Technology Cooperation Program of China (No. 2015DFR40460), the National Natural Science Foundation (No. 81173017, 81402896), the National High-Tech Research and Development Program of China (863 Program) (No. 2014AA022303) and the Tianjin Research Program of Application Foundation and Advanced Technology (13JCZDJC29700). We also appreciate the support from the State Key Laboratory of Medicinal Chemical Biology (201503013), Nankai University, China.References
- B. Ferrua, G. Milano, J. Y. Guennec and R. Masseyeff, J. Immunol. Methods, 1983, 60, 257–268 CrossRef CAS PubMed.
- R. B. Natale, A. Yagoda, R. C. Watson, W. F. Whitemore, M. Blumenreich and D. W. Braun, Cancer, 1981, 47, 1246–1250 CrossRef CAS PubMed.
- F. Albertioni, C. Rask, S. Eksborg, J. H. Poulsen, B. Pettersson, O. Beck, H. Schroeder and C. Peterson, Clin. Chem., 1996, 42, 39–44 CAS.
- S. S. Zhao, N. Bukar, J. L. Toulouse, D. Pelechacz, R. Robitaille, J. N. Pelletiter and J. F. Masson, Biosens. Bioelectron., 2015, 64, 664–670 CrossRef CAS PubMed.
- G. Stagni and C. Shukla, J. Controlled Release, 2004, 93, 283–292 CrossRef.
- J. K. Popović and D. T. Spasić, Comm. Nonlinear Sci. Numer. Simulat., 2015, 22, 451–471 CrossRef.
- N. Martelli, O. Mathieu, G. Margueritte and M. C. Bozonnat, J. Clin. Pharm. Ther., 2011, 36, 237–245 CrossRef CAS PubMed.
- K. B. Bischoff, R. L. Dedrick and D. S. Zaharko, J. Pharm. Sci., 1970, 59, 149–154 CrossRef CAS PubMed.
- H. T. Abelson, M. T. Fosburg, G. P. Beardsley, A. M. Goorin, C. Gorika, M. Link and D. Link, J. Clin. Oncol., 1983, 1, 208–216 CAS.
- M. Cociglio, D. Hillaire-Buys and C. Alric, J. Chromatogr. B: Biomed. Sci. Appl., 1995, 674, 101–110 CrossRef CAS PubMed.
- S. Belz, C. Frickel, C. Wolfrom, H. Nau and G. Henze, J. Chromatogr. B: Biomed. Sci. Appl., 1994, 661, 109–118 CrossRef CAS PubMed.
- D. A. El-Hady, J. Pharm. Biomed. Anal., 2005, 37, 919–925 CrossRef PubMed.
- B. F. Li, H. P. Feng, J. R. Jia, Y. F. Chen and Z. M. Ye, Chin. Pharm. J., 2010, 19, 7–8 Search PubMed.
- T. Sartori, F. Seigi Murakami, A. Pinheiro Cruz and A. Machado de Campos, J. Chromatogr. Sci., 2008, 46, 505–509 CAS.
- I. Rodin, A. Braun, A. Stavrianidi and O. Shpigun, J. Chromatogr. B: Anal. Technol. Biomed. Life Sci., 2013, 937, 1–6 CrossRef CAS PubMed.
- K. Sharma, K. Giri, V. Dhiman, A. Dixit, M. Zainuddin and R. Mullangi, Biomed. Chromatogr., 2014, 29, 722–732 CrossRef PubMed.
- M. C. Roach, P. Gozel and R. N. Zare, J. Chromatogr., 1988, 1, 129–140 CrossRef.
- S. M. Wang, G. Lei, X. R. Song, J. H. Yu, S. G. Ge, J. D. Huang and Z. Fang, Biosens. Bioelectron., 2012, 31, 212–218 CrossRef CAS PubMed.
- Z. J. Yang, J. Zhu, H. Dai, J. Li, J. Shen, X. N. Jiao, X. Y. Hu and H. X. Ju, Biosens. Bioelectron., 2014, 51, 356–361 CrossRef CAS PubMed.
- C. Zong, J. Wu, M. M. Liu, L. L. Yang, L. Liu, F. Yan and H. X. Ju, Anal. Chem., 2014, 86, 5573–5578 CrossRef CAS PubMed.
- M. A. Pesce and S. H. Bodourian, Ther. Drug Monit., 1986, 8, 115–121 CrossRef CAS PubMed.
- Y. Zhang and S. Lu, J. Agric. Food Chem., 2007, 55, 211–218 CrossRef CAS PubMed.
- L. L. Ren, M. Meng, P. Wang, Z. H. Xu, S. A. Eremin, J. H. Zhao, Y. M. Yin and R. M. Xi, Talanta, 2014, 121, 136–143 CrossRef CAS PubMed.
- Z. X. Yu and D. Westerlund, J. Chromatogr. B: Biomed. Sci. Appl., 1977, 689, 379–386 CrossRef.
| This journal is © The Royal Society of Chemistry 2016 |

