How strong are the metallocene–metallocene interactions? Cases of ferrocene, ruthenocene, and osmocene†
Alba Vargas-Caamala,
Sudip Panb,
Filiberto Ortiz-Chic,
Jose Luis Cabellosa,
Roberto A. Botod,
Julia Contreras-Garciad,
Albeiro Restrepo*e,
Pratim K. Chattaraj*b and
Gabriel Merino*a
aDepartamento de Física Aplicada, Centro de Investigación y de Estudios Avanzados, Unidad Mérida. km 6 Antigua Carretera a Progreso. Apdo. Postal 73, Cordemex, 97310, Mérida, Yuc., Mexico. E-mail: gmerino@mda.cinvestav.mx
bDepartment of Chemistry and Center for Theoretical Studies, Indian Institute of Technology, Kharagpur, 721302, India. E-mail: pkc@chem.iitkgp.ernet.in
cInstituto Tecnólogico Superior de Calkiní, Av. Ah-Canul s/n, Carr. Fed. Calkiní-Campeche, CP 24900, Calkiní, Campeche, Mexico
dLaboratoire de Chimie Théorique and CNRS, UMR 7616, 75252 Paris Cedex 05, Paris, France
eInstituto de Química, Universidad de Antioquia UdeA, Calle 70 No. 52-21, Medellín, Colombia. E-mail: albeiro.restrepo@udea.edu.co
First published on 11th November 2015
Abstract
An exhaustive exploration of the potential energy surfaces of ferrocene, ruthenocene and osmocene dimers has been performed. Our computations involving dispersion show that only four different isomers are present in each metallocene dimer. The collective action of small interaction energies of dispersive nature leads to a dissociation energy of 7.5 kcal mol−1 for the ferrocene dimer. Dispersion has strong effects on the geometrical parameters, reducing the M⋯M distances by almost 1 Å. Our results also reveal that inclusion of entropic factors modifies the relative stability of the complexes. The nature of bonding is examined using the energy decomposition analysis and the non-covalent interaction index. Both analyses indicate that dispersion is the major contributing factor in stabilizing a metallocene dimer.
Introduction
In 1951, with the discovery and subsequent elucidation of the sandwich structure of ferrocene1 an entire new branch, metallocene chemistry, emerged in organometallic chemistry. Gradually, the importance of metallocenes became tremendous due to their versatile applications in several fields such as biological chemistry,2 medicinal chemistry,3 catalysis,4 and non-linear optics,5 among others. Promising new applications in the field of supramolecular chemistry were uncovered by studying several self-aggregated metallocene derivatives interacting through non-covalent interactions (mainly H-bonds).Recently, Bogdanović and Novaković6 evaluated the frequency of occurrence of the ferrocene dimer in crystals reported in the Cambridge Structural Databank.7 They found that 46.8% of ferrocene derivative crystals contain a dimer where both units are in a parallel orientation, with one of the ferrocene units shifted along the z-axis by half of the Cp–Fe bond length (see Fig. 1).
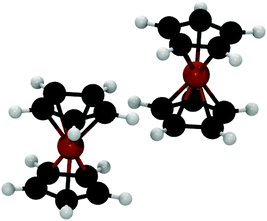 | ||
| Fig. 1 Building block identified by Bogdanović and Novaković in ferrocene derivative crystals.6 | ||
Keeping in mind the study of Bogdanović and Novaković, a detailed analysis of the bonding and nature of the ferrocene dimer will be worth pursuing in order to understand the pattern of its supramolecular arrangements.8 In the present work, we exhaustively explored the potential energy surfaces (PESs) of the ferrocene dimers. In addition, we extended this search to the PESs of ruthenocene and osmocene dimers. Our Kohn–Sham density functional theory (KS-DFT) computations involving dispersion show that only four different isomers are present in each metallocene dimer in the gas phase. Interestingly, the collective action of small interaction energies of dispersive nature leads to a higher dissociation energy for the ferrocene dimer (7.5 kcal mol−1) at low temperatures than that computed for a typical hydrogen bond in the water dimer (4.8 kcal mol−1). Our calculations also reveal that inclusion of entropic factors modifies the relative stability of the complexes. The nature of bonding is examined using the energy decomposition analysis (EDA)9 and the non-covalent interaction (NCI) index.10 Particularly, EDA shows a delicate balance between dispersion and electrostatic contributions.
Computational details
The correct treatment of noncovalent interactions is a known problem in standard KS-DFT. Several different ways of treating dispersion forces within the KS-DFT framework have been presented in the past years and have emerged as standard in the field. Readers interested in the subject are directed to recent reviews, for example, in ref. 11.Our computational procedure employs a modified-kick heuristic algorithm implemented in Bilatu to systematically explore the potential energy surfaces (PESs) of molecular clusters.12 The readers interested in details about this metaheuristic are referred to ref. 13. Final equilibrium geometries are reported at the PBE14/def2-TZVP15 and PBE-D2/def2-TZVP levels. To describe the scalar relativistic effects, an effective core potential was used for Ru and Os, describing the behavior of 28 and 60 core electrons, respectively. The latter approach includes the D2 version of Grimme’s dispersion corrections.16 The energy differences discussed here include the harmonic zero point energy (ZPE) correction. In order to evaluate the thermal effects, we use the procedure described by Irikura17 as is implemented in thermo code,18 where the standard molar entropy and enthalpy changes are computed from the molecular partition function. All the quantities needed are taken from the harmonic vibrational frequency computations. All the computations are done using the Gaussian 09 program.19
The nature of the interactions is analyzed by EDA20 at the revPBE-D321/TZ2P//PBE-D2/def2-TZVP level using the ADF (2013.01) package.22 We do not use the frozen core approximation; rather, an all-electron basis set is used. Scalar relativistic effects are considered using the zeroth-order regular approximation (ZORA). In EDA, bond formation between the interacting fragments is divided into four steps, which can be interpreted in a plausible way. In the first step the fragments, which are calculated with the frozen geometry of the entire molecule, are superimposed without electronic relaxation, yielding the quasiclassical electrostatic attraction ΔEelstat. In the second step the product wave function becomes antisymmetrized and renormalized, which gives the repulsive term ΔEPauli, termed Pauli repulsion. In the third step the molecular orbitals relax to their final form to yield the stabilizing orbital interaction ΔEorb. The latter term can be divided into contributions of orbitals having different symmetries. As it has already been mentioned, the dispersion corrected revPBE-D3 functional is employed, hence the dispersion correction term, ΔEdisp, will be added to the interaction energy (ΔEint) values to describe the total bond energy as
| ΔEint = ΔEPauli + ΔEelstat + ΔEorb + ΔEdisp | (1) |
| −De = ΔEprep + ΔEint | (2) |
Additionally, the interactions are analyzed using the NCI index.10 In NCI analysis, the mapping of localized binding interactions is done by employing two scalar fields, the electron density (ρ), and the reduced density gradient (s). These two quantities are connected by
 | (3) |
 | (4) |
 | (5) |
To perform such integrations, it is necessary to establish a unique definition of the NCI region. Because the difference between the interacting and noninteracting monomers is directly reflected in the s(ρ) diagram, it is possible to define the NCI region as the points in 3D space with (ρ, s) values lying in the s(ρ) peak. To identify this region, both the monomer and dimer densities must be computed and compared. The lower edge of the monomer s(ρ) curve is splined and all the points of the dimer s(ρ) plot lying below the splined curve are localized in real space. In practice, these integrations are performed numerically, by summation over a cubic grid with 0.1 a.u. increments and cutoffs of ρ = 0.2 a.u. and s = 2.0.
Structures and energetics
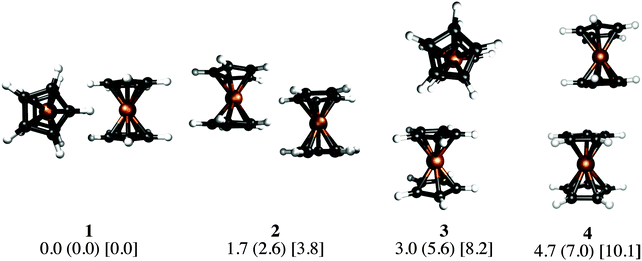
Our KS-DFT computations reveal a scarce diversity of structures within a range of 10 kcal mol−1. At higher energies there are several arrangements with one or more covalent bonds between two cyclopentadienyl rings, which are irrelevant for this study. Without dispersion, we found five different forms for ferrocene, seven for ruthenocene, and four for osmocene dimers (see Fig. S1, ESI†). The lowest-lying energy forms for Fe, Ru, and Os are 3, 1, and 2, respectively, (Fig. 2).The inclusion of dispersion via Grimme's corrections induces the collapse of some of these isomers, resulting in only four dimers for each metallocene dimer (Fig. 2). Remarkably, regardless of the conformation of the monomers in the initial guess (eclipsed or staggered), dimers have only eclipsed units. When dispersion is involved, structure 1, in which two metallocenes are oriented perpendicular to each other, becomes the most stable one in all cases. Structure 2 is the one described by Bogdanović and Novaković, and is the second most stable form.6 In the higher energy forms, one cyclopentadienyl ring of the first unit interacts perpendicularly (3) or in a parallel manner (4) to the second unit. In the case of ferrocene, while 1 is only 1.7 kcal mol−1 lower in energy than 2, isomers 3 and 4 are 3.0 and 4.7 kcal mol−1 above the global minimum, respectively. The same energy order is noticed for the ruthenocene and osmocene dimers, but the energy differences increase considerably (see Fig. 2).
Dispersion has strong effects on the geometrical parameters. The M⋯M distances without dispersion in isomer 1 are 5.80 (Fe), 5.56 (Ru), and 5.48 (Os) Å. These distances are reduced to 4.84 (Fe), 4.72 (Ru), and 4.64 (Os) Å by applying the D2 correction to PBE, i.e., the intermolecular dispersion reduces the M⋯M distances by almost 1 Å. Note that a reduction in the M⋯M distance from Fe to Os is independent of the dispersion inclusion, indicating a stronger interaction for the osmocene dimer. A similar shortening of the M⋯M distance is perceived in the other three isomers as a consequence of the dispersion inclusion. At the PBE-D2/def2-TZVP level, with inclusion of the ZPE correction, the computed bond dissociation energies (BDE) for 1 without dispersion are 0.7 (Fe), 1.3 (Ru), and 1.0 (Os) kcal mol−1. These values are remarkably increased to 7.5 (Fe), 10.0 (Ru), and 13.7 (Os) kcal mol−1, when dispersion is included.
Thermal effects
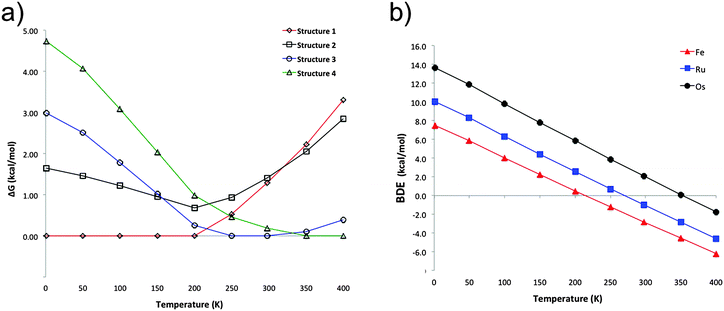
The previous discussion is based on the energies computed at 0 K. Our computations show that in the particular case of ferrocene, the relative free energy at room temperature between structures 1 and 2 is reduced only to 0.1 kcal mol−1 (at the PBE-D2/def2-TZVP level). Most interesting is that at this temperature structure 3 becomes the lowest lying isomer by 1.3 kcal mol−1 with respect to 1. Single-crystal X-ray diffraction analysis at 298 K indicated that the crystal structure of ferrocene is monoclinic P21/n (a = 5.9252 Å, b = 7.6035 Å, c = 9.0354 Å, β = 93.165°),25 with motifs similar to dimers 2 and 3. Although 2 is a very common building block in crystal structures and 1 is the most stable in the gas phase at low temperatures, the other motifs (3 and 4) are stabilized by entropic factors. Fig. 3a shows the dominant regions of each structure as a function of temperature for the ferrocene dimers. For ruthenocene and osmocene, the energetic order computed at 0 K is maintained at room temperature, but it is also altered at higher temperatures (Fig. S2 and S3, ESI†). It is also apparent from Fig. 3a and Fig. S2 (ESI†) that isomer 1 will be dominant until 200, 320, and 400 K for Fe, Ru, and Os, respectively.Temperature also significantly affects the dissociation energies. Fig. 3b indicates that while the ferrocene dimer is stable until 220 K, the ruthenocene and osmocene dimers are stable complexes until 270 and 350 K, respectively. The main reason is that at high temperatures, the contact area between the two units decreases and less compact clusters are obtained. In other words, the ideal gas behavior (no intermolecular interactions, thus no cluster formation) is recovered at high temperatures.
Bonding
What is the nature of the interactions in a metallocene dimer? In principle, at low temperatures, dissociation energies are higher than the computed interaction energy of the water dimer (4.8 kcal mol−1), a system that exhibits a single hydrogen bond. There is comprehensive literature dealing with the important problem of the nature and strength of interactions stabilizing the water and benzene dimers, this literature is too extensive to be reviewed here and this problem falls outside the scope of this work. Nonetheless, we point out that MP2 calculations overestimate deformation energies in the water monomer when compared to the highly sophisticated CCSD(T) methods26 and that experimentally measured dissociation energies for the benzene dimer27 are 2.4 ± 0.4 kcal mol−1 which are in outstanding agreement with our results in Table 1. Obviously, these interactions are of different nature since metallocenes lack a permanent dipole moment, thus the driving force behind the formation of metallocene dimers is of dispersive origin as discussed above. Additionally, it is important to remark that a ferrocene dimer has many more atoms than a water dimer, so the collective action of very small interaction energies of dispersive nature is responsible for the stabilization of the metallocene dimers. On the other hand, the ferrocene dimer has a quadrupole moment, and the quadrupole–quadrupole interaction decreases more slowly (1/R5) at long distances than the dispersion interaction.| M | Cluster | ΔEelstat | ΔEPauli | ΔEorb | ΔEdisp | ΔEtotal |
|---|---|---|---|---|---|---|
| The percentage values within the parentheses show the contribution towards the total attractive interactions (ΔEelstat + ΔEorb + ΔEdisp). | ||||||
| Fe | 1 | −9.3 (30.0) | 23.3 | −5.3 (17.1) | −16.4 (52.9) | −7.7 |
| 2 | −6.2 (28.4) | 16.1 | −3.7 (17.0) | −11.9 (54.6) | −5.7 | |
| Ru | 1 | −11.1 (31.4) | 26.5 | −6.6 (18.6) | −17.7 (50.0) | −9.0 |
| 2 | −8.2 (32.2) | 18.8 | −4.6 (18.0) | −12.7 (49.8) | −6.7 | |
| Os | 1 | −13.4 (32.1) | 30.2 | −7.5 (17.9) | −20.9 (50.0) | −11.6 |
| 2 | −9.7 (32.7) | 21.5 | −5.2 (17.5) | −14.8 (49.8) | −8.2 | |
| (H2O)2 | −8.8 (59.9) | 9.9 | −4.7 (32.0) | −1.2 (8.2) | −4.8 | |
| (C6H6)2 | −2.5 (24.5) | 7.3 | −1.1 (10.8) | −6.6 (64.7) | −2.8 | |
Bogdanović and Novaković found an electrostatic complementarity between the two ferrocene units in structure 2.6 This complementarity occurs in a very large area, including the four “puzzle-like” regions of mutual compatibility and recognition. Fig. 4 shows molecular electrostatic potential isosurfaces for the four local minima of ferrocene. It is apparent that this complementarity concept is also applicable to structure 1. However, this does not apply to 3 and 4, where the overlap of the negative regions interrupts the complementarity.
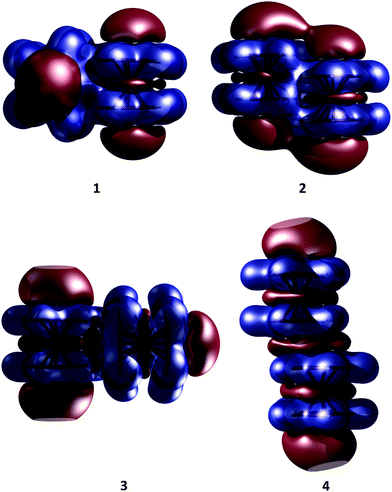 | ||
| Fig. 4 Molecular electrostatic potential maps of the ferrocene dimers. Isosurfaces are plotted with an isovalue of 0.01. Positive regions are in red and negative regions in blue. | ||
Charge density difference plots give a precise representation of the electron redistribution upon dimer formation (Fig. 5). Clearly, the electron redistribution in the three dimers is negligible. The most relevant changes are perceived in the density of the C–H bond involved in the contact. While the hydrogen atoms lose density, carbon atoms gain it. So, a very poor polarization contribution is expected (vide infra). Note that dispersion forces always will be attractive even without any charge transfer.
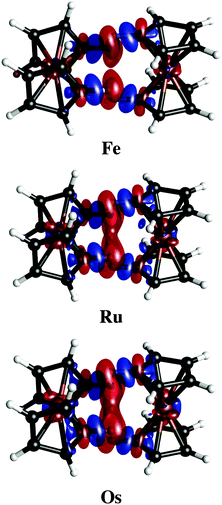 | ||
| Fig. 5 Electron density differences in isosurfaces (Δρ = 0.0005 a.u.). Negative and positive regions are in red and blue, respectively. | ||
The strength of the overall contributions of dispersion and electrostatic terms to the interactions can be quantitatively estimated by EDA. Table 1 gives the EDA values at the revPBE-D3/TZ2P//PBE-D2/def2-TZVP level calculated for the two most stable isomers. It becomes apparent that the electrostatic contribution is not the sole term stabilizing the dimers. It contributes ca. 28–32% towards the total attraction. ΔEdisp is found to be the major contributor towards the total attraction with ≈50%. The contribution from ΔEorb is the least towards the total attraction (less than 20%) as a consequence of negligible orbital overlapping between two monomers. Note that the interaction energy gradually increases on moving from Fe to Os. It is also important to mention that monomers do not suffer any significant structural variation, thus preparation energy is negligible. Clearly, EDA shows a delicate balance between dispersion and electrostatic contributions in order to stabilize a metallocene dimer.
Note that although the magnitude of the interaction energy between two metallocene units is quite close to typical H-bond energy, the nature of the bonding between them is quite different. As a reference point, the water dimer is considered (see Table 1). In this H-bonded dimer, the ΔEelstat contribution is found to be the most significant (60%), whereas the contributions from ΔEorb and ΔEdisp terms to the total attractive interaction are 32 and 8.2%, respectively. Therefore, according to EDA, in the water dimer, as in most cases, the H-bonding is mainly electrostatic in nature.28 We have also compared the title cases with the parallel-displaced benzene dimer with C2h symmetry. EDA indicates that the benzene dimer is stabilized mainly by dispersion (65%). So, the nature of bonding of metallocene dimers is similar to that of the benzene dimer, but the interaction energy is higher in the first cases.
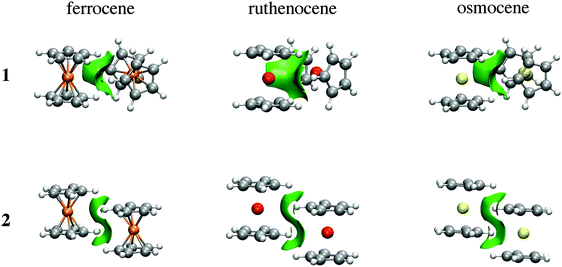
As the name suggests, the NCI method of Johnson and co-workers has been specifically developed to reveal non-covalent interactions.10Fig. 6 depicts NCI isosurfaces for isomers 1 and 2 to illustrate the nature of the intermolecular interactions. As is mentioned above, a continuous color-coding scheme based on the second derivative of the electron density is used, where strong attractive interactions are represented in blue, weak attractive interactions in green, and strong repulsive interactions in red. The images of both isomers correspond to a typical dimer stabilized mainly by dispersion where attractive surfaces cover a very large area between both units. So, NCI analysis supports the fact that there is a collective action of small interaction energies of dispersive nature distributed in an ample area between both monomers. Furthermore, the area of the green surface in 1 is larger than that in 2. Integration of the volume of this surface for Fe (see ESI†) gives 87.47 a.u. for the parallel conformer and 104.03 a.u. for the perpendicular one. The charges involved within these surfaces are also larger for the orthogonal conformation (1.78 |e| in the parallel case vs. 1.90 |e| for the orthogonal one). These values are in agreement with the relative weight of dispersive and electrostatic contributions in the EDA partition.
Conclusions
In summary, our computations show that dispersion is the major contribution to stabilize a metallocene dimer. Dispersion has also strong effects on the geometrical parameters, reducing the M⋯M distances by almost 1 Å. The potential energy surface analysis, including dispersion, shows the presence of four local minima for all cases. At low temperatures, the lowest lying energy structure of (MCp2)2 (M = Fe, Ru, Os) is one in which the two fragments are oriented perpendicular to each other. At higher temperatures, relative and dissociation energies for the different isomers will be strongly affected. The interaction energy gradually increases on moving from Fe to Os. Our bonding analysis shows that the contribution from the ΔEelstat term is important, but amounts to only about 30% of the total attraction energy. The most important attractive contribution is dispersion (almost 50%). The NCI analysis reveals the occurrence of attractive surfaces of dispersive nature between two metallocene units as the main factor responsible for the stability of the dimers. A larger area of the attractive surface in 1 indicates a larger dispersion interaction than in 2. So, the collective action of very small interaction energies of dispersive nature is responsible for the stabilization of the metallocene dimers. An investigation on the effects of dispersion on ferrocene crystals is in progress.Conflict of interest
The authors declare no competing financial interest.Acknowledgements
Moshinsky Foundation and Tecnológico Nacional de México (Grant 069-14-PD) supported the work in México. PKC thanks DST, New Delhi for the J. C. Bose National Fellowship. SP thanks CSIR for his fellowship. AVC and JLC acknowledge Conacyt for the PhD and postdoctoral fellowships, respectively. AR acknowledges partial financial support from the “Estrategia de Sostenibilidad”, Universidad de Antioquia.References
- (a) T. J. Kealy and P. L. Pauson, Nature, 1951, 168, 1039–1040 CrossRef CAS; (b) E. O. Fischer and W. Pfab, Z. Naturforsch., B: Chem. Sci., 1952, 7, 377–379 CrossRef; (c) S. A. Miller, J. A. Tebboth and J. F. Tremaine, J. Chem. Soc., 1952, 632–635 RSC; (d) G. Wilkinson, M. Rosenblum, M. C. Whiting and R. B. Woodward, J. Am. Chem. Soc., 1952, 74, 2125–2126 CrossRef CAS; (e) P. Laszlo and R. Hoffmann, Angew. Chem., Int. Ed., 2000, 39, 123–124 CrossRef CAS.
- D. R. van Staveren and N. Metzler-Nolte, Chem. Rev., 2004, 104, 5931–5985 CrossRef CAS PubMed.
- (a) M. F. R. Fouda, M. M. Abd-Elzaher, R. A. Abdelsamaia and A. A. Labib, Appl. Organomet. Chem., 2007, 21, 613–625 CrossRef CAS; (b) C. Ornelas, New J. Chem., 2011, 35, 1973–1985 RSC.
- (a) L. X. Dai, T. Tu, S. L. You, W. P. Deng and X. L. Hou, Acc. Chem. Res., 2003, 36, 659–667 CrossRef CAS PubMed; (b) R. G. Arrayas, J. Adrio and J. C. Carretero, Angew. Chem., Int. Ed., 2006, 45, 7674–7715 CrossRef PubMed; (c) H. H. Brintzinger, D. Fischer, R. Mulhaupt, B. Rieger and R. M. Waymouth, Angew. Chem., Int. Ed. Engl., 1995, 34, 1143–1170 CrossRef CAS; (d) T. Maschmeyer, F. Rey, G. Sankar and J. M. Thomas, Nature, 1995, 378, 159–162 CrossRef CAS; (e) M. Bochmann, J. Chem. Soc., Dalton Trans., 1996, 255–270 RSC; (f) W. Kaminsky, Macromol. Chem. Phys., 1996, 197, 3907–3945 CrossRef CAS; (g) W. Kaminsky and M. Arndt, Adv. Polym. Sci., 1997, 127, 143–187 CrossRef CAS; (h) W. Kaminsky and A. Laban, Appl. Catal., A, 2001, 222, 47–61 CrossRef CAS; (i) H. G. Alt and A. Koppl, Chem. Rev., 2000, 100, 1205–1221 CrossRef CAS PubMed; (j) D. Astruc, C. Ornelas and J. Ruiz, Acc. Chem. Res., 2008, 41, 841–856 CrossRef CAS PubMed.
- (a) J. C. Calabrese, L. T. Cheng, J. C. Green, S. R. Marder and W. Tam, J. Am. Chem. Soc., 1991, 113, 7227–7232 CrossRef CAS; (b) N. J. Long, Angew. Chem., Int. Ed. Engl., 1995, 34, 21–38 CrossRef CAS; (c) S. Barlow, H. E. Bunting, C. Ringham, J. C. Green, G. U. Bublitz, S. G. Boxer, J. W. Perry and S. R. Marder, J. Am. Chem. Soc., 1999, 121, 3715–3723 CrossRef CAS; (d) E. Manias, A. Touny, L. Wu, K. Strawhecker, B. Lu and T. C. Chung, Chem. Mater., 2001, 13, 3516–3523 CrossRef CAS; (e) S. Barlow and S. R. Marder, Chem. Commun., 2000, 1555–1562 RSC.
- G. A. Bogdanović and S. B. Novaković, CrystEngComm, 2011, 13, 6930–6932 RSC.
- F. H. Allen, Acta Crystallogr., Sect. B: Struct. Sci., 2002, 58, 380–388 CrossRef.
- D. Braga, F. Grepioni and G. R. Desiraju, Chem. Rev., 1998, 98, 1375–1405 CrossRef CAS PubMed.
- M. von Hopffgarten and G. Frenking, Wiley Interdiscip. Rev.: Comput. Mol. Sci., 2012, 2, 43–62 CrossRef CAS.
- E. R. Johnson, S. Keinan, P. Mori-Sanchez, J. Contreras-Garcia, A. J. Cohen and W. T. Yang, J. Am. Chem. Soc., 2010, 132, 6498–6506 CrossRef CAS PubMed.
- (a) S. Grimme, J. Antony, T. Schwabe and C. Muck-Lichtenfeld, Org. Biomol. Chem., 2007, 5, 741–758 RSC; (b) S. Grimme, Wiley Interdiscip. Rev.: Comput. Mol. Sci., 2011, 1, 211–228 CrossRef CAS; (c) S. N. Steinmann and C. Corminboeuf, J. Chem. Theory Comput., 2010, 6, 1990–2001 CrossRef CAS; (d) A. Tkatchenko and M. Scheffler, Phys. Rev. Lett., 2009, 102, 073005 CrossRef PubMed; (e) A. Tkatchenko, R. A. DiStasio, R. Car and M. Scheffler, Phys. Rev. Lett., 2012, 108, 236402 CrossRef PubMed.
- (a) J. Cabellos, F. Ortiz-Chi, A. Ramírez and G. Merino, Bilatu 1.0, Cinvestav, Mérida, Yucatán, México, 2013; (b) A. Vargas-Caamal, F. Ortiz-Chi, D. Moreno, A. Restrepo, G. Merino and J. L. Cabellos, Theor. Chem. Acc., 2015, 134, 9 CrossRef.
- (a) R. Grande-Aztatzi, P. R. Martínez-Alanis, J. L. Cabellos, E. Osorio, A. Martínez and G. Merino, J. Comput. Chem., 2014, 35, 2288–2296 CrossRef CAS PubMed; (b) A. Ramirez-Manzanares, J. Pena, J. M. Azpiroz and G. Merino, J. Comput. Chem., 2015, 36, 1456–1466 CrossRef CAS PubMed.
- J. P. Perdew, K. Burke and M. Ernzerhof, Phys. Rev. Lett., 1996, 77, 3865–3868 CrossRef CAS PubMed.
- F. Weigend and R. Ahlrichs, Phys. Chem. Chem. Phys., 2005, 7, 3297–3305 RSC.
- S. Grimme, J. Comput. Chem., 2006, 27, 1787–1799 CrossRef CAS PubMed.
- K. K. Irikura, in Computational Thermochemistry, ed. K. K. Irikura and D. J. Frurip, ACS Symposium Series 677, American Chemical Society, Washington, DC, 1998 Search PubMed.
- K. K. Irikura, National Institute of Standards and Technology, 2002, http://thermo.pl.
- M. J. Frisch, G. W. Trucks, H. B. Schlegel, G. E. Scuseria, M. A. Robb, J. R. Cheeseman, G. Scalmani, V. Barone, B. Mennucci, G. A. Petersson, H. Nakatsuji, M. Caricato, X. Li, H. P. Hratchian, A. F. Izmaylov, J. Bloino, G. Zheng, J. L. Sonnenberg, M. Hada, M. Ehara, K. Toyota, R. Fukuda, J. Hasegawa, M. Ishida, T. Nakajima, Y. Honda, O. Kitao, H. Nakai, T. Vreven, J. A. Montgomery Jr., J. E. Peralta, F. β. Ogliaro, M. J. Bearpark, J. Heyd, E. N. Brothers, K. N. Kudin, V. N. Staroverov, R. Kobayashi, J. Normand, K. Raghavachari, A. P. Rendell, J. C. Burant, S. S. Iyengar, J. Tomasi, M. Cossi, N. Rega, N. J. Millam, M. Klene, J. E. Knox, J. B. Cross, V. Bakken, C. Adamo, J. Jaramillo, R. Gomperts, R. E. Stratmann, O. Yazyev, A. J. Austin, R. Cammi, C. Pomelli, J. W. Ochterski, R. L. Martin, K. Morokuma, V. G. Zakrzewski, G. A. Voth, P. Salvador, J. J. Dannenberg, S. Dapprich, A. D. Daniels, ñ. n. Farkas, J. B. Foresman, J. V. Ortiz, J. Cioslowski and D. J. Fox, Gaussian, Inc., Wallingford, CT, USA, 2009 Search PubMed.
- T. Ziegler and A. Rauk, Theor. Chim. Acta, 1977, 46, 1–10 CrossRef CAS.
- (a) Y. K. Zhang and W. T. Yang, Phys. Rev. Lett., 1998, 80, 890 CrossRef CAS; (b) S. Grimme, S. Ehrlich and L. Goerigk, J. Comput. Chem., 2011, 32, 1456–1465 CrossRef CAS PubMed.
- G. te Velde, F. M. Bickelhaupt, E. J. Baerends, C. F. Guerra, S. J. A. Van Gisbergen, J. G. Snijders and T. Ziegler, J. Comput. Chem., 2001, 22, 931–967 CrossRef CAS.
- J. Contreras-Garcia, E. R. Johnson, S. Keinan, R. Chaudret, J.-P. Piquemal, D. N. Beratan and W. Yang, J. Chem. Theory Comput., 2011, 7, 625–632 CrossRef CAS PubMed.
- J. Contreras-Garcia, W. T. Yang and E. R. Johnson, J. Phys. Chem. A, 2011, 115, 12983–12990 CrossRef CAS PubMed.
- C. P. Brock and Y. G. Fu, Acta Crystallogr., Sect. B: Struct. Sci., 1997, 53, 928–938 Search PubMed.
- W. Klopper, J. van Duijneveldt-van de Rijdt and F. B. Duijneveldt, Phys. Chem. Chem. Phys., 2000, 2, 2227–2234 RSC.
- J. R. Grover, E. A. Walters and E. T. Hui, J. Phys. Chem., 1987, 91, 3233 CrossRef CAS.
- G. Frenking and G. F. Caramori, Angew. Chem., Int. Ed., 2015, 54, 2596–2599 CrossRef CAS PubMed.
Footnote |
| † Electronic supplementary information (ESI) available: Optimized Cartesian coordinates for all species. See DOI: 10.1039/c5cp05956a |
| This journal is © the Owner Societies 2016 |

