Unexpected multiple activated steps in the excited state decay of some bis(phenylethynyl)-fluorenes and -anthracenes†
G.
Cacioppa
,
B.
Carlotti
,
F.
Elisei
,
P. L.
Gentili
,
A.
Marrocchi
and
A.
Spalletti
*
Department of Chemistry, Biology and Biotechnology and Centro di Eccellenza sui Materiali Innovativi Nanostrutturati (CEMIN), University of Perugia, via, Elce di Sotto 8, 06123 Perugia, Italy. E-mail: anna.spalletti@unipg.it
First published on 16th November 2015
Abstract
The temperature effect on the photophysical parameters of four acetylene-derivatives [bis(phenylethynyl)-anthracenes and -fluorenes with substituents of different electron acceptor efficiencies] has been investigated by absorption and emission spectroscopy, using stationary and pulsed (ns/fs resolution) techniques. The nature of the central nucleus (anthracene or fluorene) and the peripheral electron-withdrawing group (nitro or formyl) strongly affect the deactivation of the excited states of these push–pull molecules. In some cases the study evidenced an interesting role of two activated steps in the deactivation of the excited singlet state, namely an activated inter-system crossing to an upper triplet state of n,π* nature (previously hypothesized on the basis of TD-DFT calculations) and a sort of activated internal conversion, discussed also on the basis of maximum entropy method analysis of the fluorescence decay data. Nicely, an efficient ISC was found for the fluorene-derivatives where small energy gaps between S1 (π,π*) and Tn (n,π*) states had been calculated while no activated ISC was evidenced in the case of anthryl-derivatives where higher S1–Tn energy gaps are expected. A peculiar temperature effect for a fluorene-derivative was pointed out and also explained on the basis of quantum-mechanical calculations at the DFT level taking into account the solvation effects by means of the conductor-like polarizable continuum model CPCM. The presence of dual emission, at first evidenced by a shoulder in the emission spectrum of the fluorene-derivative featuring a peripheral formyl group in dichloromethane at low temperatures, was nicely confirmed by femtosecond up-conversion measurements at room temperature.
Introduction
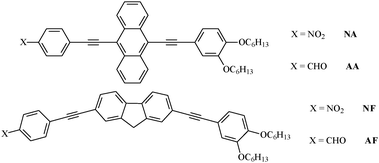
The present contribution is part of a research project on the excited state properties of organic dyes such as bis(phenylethynyl)-anthracenes and -fluorenes1,2 with substituents of different electron acceptor efficiencies (Chart 1). Acetylene-based materials are really interesting for applications in organic electronic devices including light emitting diodes, field-effect transistors, organic photovoltaic cells and fluorescent sensors.3–5 Moreover, the presence of electron-acceptor units on one side of the molecules and the mild electron-donor alkoxy groups on the other side give these systems a push–pull character that can induce intramolecular charge transfer (ICT), as observed in ethene-derivatives,6 and solvent effects of potential interest for applications in nonlinear optics (NLO).7 In fact, the decay processes of the excited states of these compounds may be complicated by the involvement of ICT processes occurring during their lifetime.8In a previous work8 the spectral and photophysical behaviour of ethynyl-fluorenes and -anthracenes in solvents of different polarities were investigated by stationary, fast/ultrafast spectroscopy and theoretical DFT calculations. A substantial positive fluorosolvatochromism was observed and the photobehaviour was found to dramatically change upon increasing the medium polarity, also strongly depending on the structure of the aromatic central units.8,9 Namely, when the central unit was the anthracene a significantly red-shifted absorption spectrum was observed making these systems promising for applications as absorbers in organic solar cells.3 On the other hand, when the central unit was the fluorene transitions with high CT character were favoured, making these molecules more appealing for NLO applications.7 Both the ICT character of the lowest excited states and the population of the triplet state decrease in the order NO2 > CHO > CN, in agreement with the electron affinity of the side groups and the energy of the 3(n,π*) state. Therefore, only in the case of the fluorene-derivatives and the nitro-anthracene compound the fs transient absorption measurements evidenced the presence of two singlet excited states, namely a locally excited (LE) state, produced by absorption, and an ICT state originating from the LE state, their lifetimes being strongly affected by the solvent polarity. Moreover, a dramatic reduction of the fluorescence quantum yield (ϕF) and the parallel decrease of the triplet production in polar solvents indicated that an efficient internal conversion (IC) plays a fundamental role in the deactivation of the strongly stabilized ICT state, due to the small S1–S0 energy gap.8 In the other two anthracene-derivatives, having CHO and CN as substituents, no ICT states have been found in agreement with their high ϕF in both non-polar and polar solvents.
A peculiar behaviour of the ISC rate constant (kISC) was found for some of them in agreement with a previous study on analogous compounds,10 characterized by an efficient ISC process in non-polar solvents that decreases by two orders of magnitude by slightly increasing the solvent polarity, while a further increase of the latter causes a new increase of kISC, which when investigated in more polar solvents (acetone and dimethylformamide) reaches values similar to that in cyclohexane (CH). This behaviour was interpreted on the basis of quantum-mechanical calculations at the DFT level of theory that predicted the presence of (n,π*) states at rather low energy for the fluorene-derivatives, where the lowest 3(n,π*) and 1(π,π*) states are located in the interval 3.1–3.9 eV in vacuum8 and can be differently stabilized in polar solvents (see Scheme 2 of ref. 8). In fact, it is well known that high spin–orbit coupling is expected for ISC between (n,π*) and (π,π*) states, according to the El-Sayed rules, and the increase of solvent polarity stabilises the (π,π*) states and destabilises the (n,π*) ones, thus their relative position and the energy gap between them becoming solvent dependent. Therefore, in solvents of intermediate polarity where the lowest excited state is 1LE* of π,π* nature, a 3(n,π*) state is expected to lie close to the optical 1(π,π*) state (see Chart 2) and then an activated singlet–triplet ISC can be operative, in agreement with the significant reduction of the kinetic constant. However, the further increase of kISC in highly polar solvents is due to the intrinsic nature of S1, the CT character of which increases with solvent polarity, and is, in this case, a measure of the efficient spin–orbit coupling between the 1CT* and low-lying 3(π,π*) states of different nature. For the anthryl-derivatives, where the 3(n,π*) state was predicted to be too high with respect to S1 (see Chart 2), the ISC was found to be very slow and practically inefficient at room temperature.8
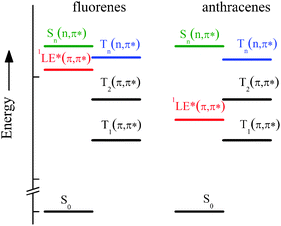 | ||
| Chart 2 Sketch of the ground and lowest excited states involved in the photobehaviour of the investigated compounds as derived by quantum-mechanical calculations.8 | ||
This paper reports a temperature effect on the photophysical parameters in solvents of suitable polarity carried out to highlight the presence of activated ISC pathways predicted on the basis of quantum-mechanical calculations and the effect of solvent polarity. New DFT calculations, MEM analysis applied to single photon counting decay kinetics and femtosecond up-conversion measurements were required to understand the results regarding the presence of additional activated steps and dual-fluorescence.
Results and discussion
The choice of the solvent
As discussed in the Introduction section, in the case of fluorene-derivatives a peculiar trend of kISC in different media as a function of dielectric constant (ε) was observed (Fig. 1) and explained on the basis of the presence of an efficient ISC between 1LE* of π,π* nature and a closely located 3(n,π*) state that becomes less likely after increasing the solvent polarity, probably because the different stabilization of the two involved states of different nature leads to an activated ISC from the 1LE* to 3(n,π*) state. The new increase of kISC due to a further increase of ε has been attributed to an increased CT character of the lowest excited singlet state that allows an efficient ISC from 1CT* to a low-lying 3(π,π*) state to become operative.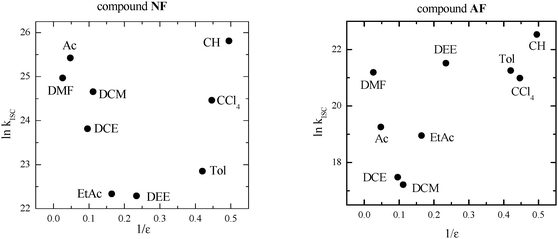 | ||
| Fig. 1 Trend of kISC by changing the dielectric constant (ε) of the medium in the case of the fluorene-derivatives. Data retrieved from ref. 8 (DEE = diethylether, EtAc = ethylacetate, DCE = dichloroethane, Ac = acetone, DMF = dimethylformamide). | ||
In this situation toluene (Tol) seemed to be a good solvent to explore the temperature range below 293 K, owing to its low melting point, the low dependence of its dielectric constant on the temperature and because it is at the beginning of a plateau in the plot shown in Fig. 1. In fact, kISC is expected not to change in this ε range (2.38–4.27) although the decrease of temperature causes some slight increase of ε. Moreover, fs transient absorption measurements ensured that only 1LE* is present for NF and AF in Tol and no sign of the ICT process was evidenced in this solvent. For AF the measurements at low T were also performed in dichloromethane (DCM) to explore a solvent where the lowest kISC value had been found even if in this medium an ICT process after excitation is expected on the basis of previous fs measurements.8
For the anthryl-derivatives methylcyclohexane (MCH) was considered a good low polar solvent suitable to explore high temperatures to favour an eventual population of high-energy 3(n,π*) states.
A different behaviour was observed for AF in the more polar DCM. In fact, in this solvent the emission spectrum (red-shifted by about 100 nm with respect to that in Tol) decreases in intensity and moves towards the red by cooling. The normalized fluorescence spectra in Fig. S2 (ESI†) evidenced that below 250 K the red-shift is accompanied by the appearance of a hypsochromic shoulder at ca. 420 nm (falling in the spectral region where AF emits in Tol). Probably this shoulder is present in the entire investigated temperature range but hidden at T > 250 K under the more intense and blue-shifted emission (see Fig. S5, ESI†).
| T/K | NA in MCH | AA in MCH | ||||
|---|---|---|---|---|---|---|
| ϕ F | τ F/ns | k F/108 s−1 | ϕ F | τ F/ns | k F/108 s−1 | |
| 293 | 0.98 | 2.63 | 3.7 | 0.90 | 2.63 | 3.4 |
| 303 | 1.02 | 2.64 | 3.9 | 0.89 | 2.62 | 3.4 |
| 313 | 1.05 | 2.66 | 4.0 | 0.90 | 2.64 | 3.4 |
| 323 | 1.06 | 2.68 | 4.0 | 0.81 | 2.67 | 3.0 |
| 333 | 1.07 | 2.71 | 4.0 | 0.79 | 2.70 | 2.9 |
| 343 | 1.06 | 2.73 | 3.9 | 0.78 | 2.64 | 2.9 |
| 358 | 1.05 | 2.73 | 3.9 | 0.75 | 2.61 | 2.8 |
| T/K | NF in Tol | AF in Tol | AF in DCM | ||||||
|---|---|---|---|---|---|---|---|---|---|
| ϕ F | τ F/ns | k F/108 s−1 | ϕ F | τ F/ns | k F/108 s−1 | ϕ F | τ F/ns | k F/108 s−1 | |
| a From fs measurements (ref. 8). b At 200 K. | |||||||||
| 293 | 0.013 | 0.045a | 2.9 | 0.15 | 0.28 | 5.4 | 0.17 | 0.88 | 1.9 |
| 280 | 0.026 | — | — | 0.19 | 0.34 | 5.6 | 0.14 | 0.74 | 1.9 |
| 265 | 0.055 | — | — | 0.23 | 0.40 | 5.8 | 0.10 | 0.59 | 1.7 |
| 250 | 0.12 | 0.41 | 2.9 | 0.28 | 0.47 | 6.0 | 0.08 | 0.47 | 1.7 |
| 235 | 0.24 | 0.73 | 3.3 | 0.33 | 0.53 | 6.2 | 0.05 | 0.38 | 1.3 |
| 220 | 0.42 | 1.22 | 3.4 | 0.37 | 0.61 | 6.1 | 0.05 | 0.33 | 1.5 |
| 205 | 0.62 | 1.79 | 3.5 | 0.41 | 0.68 | 6.0 | 0.04b | 0.33b | 1.2b |
| 195 | 0.71 | 2.07 | 3.4 | 0.43 | 0.74 | 5.8 | |||
The fluorene-derivatives studied in Tol below room T showed parallel increases of ϕF and τF by decreasing T, particularly marked for NF (where ϕF changes by almost one order of magnitude from 0.013 at 293 K to 0.71 at 195 K), maintaining the kinetic constant practically unchanged in the investigated T range.
An opposite trend was found for ϕF and τF of AF in DCM as a function of T. In fact, a significant reduction of their values was measured upon decreasing T. Such a trend is accompanied by a 40% reduction of kF pointing out a progressive change of the nature of the emitting state making fluorescence a less allowed process at low T.
| T/K | ΔA | ϕ T | k ISC/106 s−1 |
|---|---|---|---|
| 293 | 0.016 | 0.008 | 3.0 |
| 303 | 0.021 | 0.011 | 4.2 |
| 313 | 0.023 | 0.012 | 4.6 |
| 323 | 0.024 | 0.012 | 4.5 |
| 333 | 0.023 | 0.012 | 4.5 |
| 343 | 0.023 | 0.012 | 4.4 |
| 358 | 0.023 | 0.011 | 4.0 |
| T/K | NF in Tol | AF in Tol | AF in DCM | |||||||||
|---|---|---|---|---|---|---|---|---|---|---|---|---|
| ΔA | τ T/μs | ϕ T | k ISC /108 s−1 | ΔA | τ T/μs | ϕ T | k ISC /108 s−1 | ΔA | τ T/μs | ϕ T | k ISC /108 s−1 | |
| a For kISC = ϕT/τF, the τF value at 293 K is from fs measurements (ref. 8). b At 200 K. | ||||||||||||
| 293 | 0.358 | 2.9 | 0.38 | 84 | 0.219 | 1.1 | 0.37 | 13.2 | 0.033 | 21 | 0.036 | 0.40 |
| 280 | 0.349 | 3.2 | 0.37 | 0.228 | 0.39 | 11.5 | 0.031 | 18 | 0.034 | 0.46 | ||
| 265 | 0.342 | 3.8 | 0.37 | 0.238 | 3.3 | 0.40 | 10.0 | 0.026 | 12 | 0.028 | 0.47 | |
| 250 | 0.349 | 4.3 | 0.37 | 9.3 | 0.275 | 5.3 | 0.46 | 9.79 | 0.026 | 15 | 0.028 | 0.60 |
| 235 | 0.364 | 8.3 | 0.40 | 5.5 | 0.271 | 8.2 | 0.46 | 8.68 | 0.018 | 17 | 0.020 | 0.53 |
| 220 | 0.340 | 7.6 | 0.36 | 3.0 | 0.268 | 13 | 0.45 | 7.38 | 0.021 | 10 | 0.023 | 0.70 |
| 205 | 0.360 | 10 | 0.38 | 2.1 | 0.268 | 19 | 0.45 | 6.62 | 0.016b | 12b | 0.017b | 0.52b |
| 195 | 0.334 | 0.35 | 1.7 | 0.249 | 29 | 0.42 | 5.68 | |||||
The triplet population is not influenced by T for both NF and AF in Tol, but kISC strongly decreases on going from 293 K to 195 K confirming the presence in this solvent of an activated ISC to an upper triplet state of n,π* nature. In fact, the kISC value derived at room T was found to be particularly high (108–109 s−1) in agreement with the El-Sayed rules. In contrast, the slight decrease of ϕT observed for AF in DCM, that parallels the decrease of τF, leaves kISC practically unchanged in the 293–200 K range investigated. The triplet lifetime increases at low T for the two fluorene-derivatives, as expected, but it is roughly halved on going from 293 K to 200 K in DCM, probably due to an increased CT character of the triplet state upon increasing the dielectric constant at low T.
| AA in MCH | NF in Tol | AF in Tol | AF in DCM | ||||||||
|---|---|---|---|---|---|---|---|---|---|---|---|
| T/K | ϕ IC | k IC | T/K | ϕ IC | k IC | T/K | ϕ IC | k IC | T/K | ϕ IC | k IC |
| 293 | 0.092 | 0.35 | 293 | 0.61 | 135 | 293 | 0.48 | 17 | 293 | 0.79 | 9.0 |
| 303 | 0.099 | 0.38 | 280 | 0.60 | 280 | 0.42 | 12 | 280 | 0.83 | 11 | |
| 313 | 0.088 | 0.33 | 265 | 0.57 | 265 | 0.37 | 9.3 | 265 | 0.87 | 15 | |
| 323 | 0.18 | 0.67 | 250 | 0.51 | 13 | 250 | 0.26 | 5.4 | 250 | 0.89 | 19 |
| 333 | 0.20 | 0.74 | 235 | 0.36 | 4.9 | 235 | 0.21 | 4.0 | 235 | 0.93 | 24 |
| 343 | 0.21 | 0.78 | 220 | 0.22 | 1.8 | 220 | 0.18 | 3.0 | 220 | 0.93 | 28 |
| 358 | 0.24 | 0.88 | 205 | — | — | 205 | 0.14 | 2.1 | 200 | 0.94 | 28 |
| 195 | — | — | 195 | 0.15 | 2.0 | ||||||
Processing the fluorescence decay data by MEM analysis gave interesting results shown in Fig. 2 and Fig. S7–S10 (ESI†). In fact, at high T a broad distribution of lifetimes centered around the mean value was found in the case of compounds (AA in MCH, NF and AF in Tol) where an increase of kIC with T has been derived. This finding supports the presence at high T of a large set of conformations with slightly different geometries that deactivate through different pathways, IC being the predominant one in the twisted conformations. Decreasing the T, narrow distributions of τF are found pointing to a selection of more planar and rigid conformations where fluorescence prevails on IC as a deactivation route for S1.
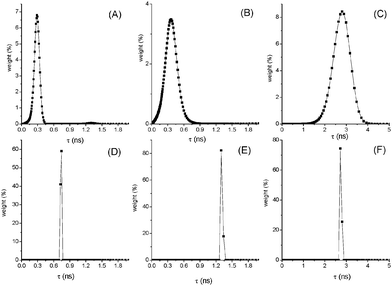 | ||
| Fig. 2 Distributions of lifetimes for AF in toluene at 293 K (A) and 205 K (D); NF in toluene at 250 K (B) and 220 K (E); AA in MCH at 358 K (C) and 293 K (F). | ||
Different is the case of AF in DCM where IC is the main deactivation pathway in all the investigated T range but ϕIC and kIC reach higher values at low T. This behaviour is due to the presence of a low-lying 1ICT* state in this solvent of medium polarity where AF deactivates to the ground state mainly through IC. The increase of ε (from 9.08 at 293 K to 12.57 at 200 K) causes an increased CT character of S1 implying an increase of kIC.
The fluorescence quantum yield (ϕF) and the kinetic constants for intersystem-crossing (kISC) and internal conversion (kIC) as a function of temperature were elaborated according to the following Arrhenius-type equations to derive the activation energy (Ea) and the pre-exponential factor (A) of different activated pathways:
 | (1) |
 | (2) |
 | (3) |
The fitting procedures usually allowed a good correlation (r2 in the range 0.999–0.98) and the obtained results are collected in Table 6.
The plots for the ϕF values as a function of T and their fittings according to eqn (3) are shown in Fig. 3 for NF and AF in Tol as an example (the other trends are reported in Fig. S11–S16, ESI†).
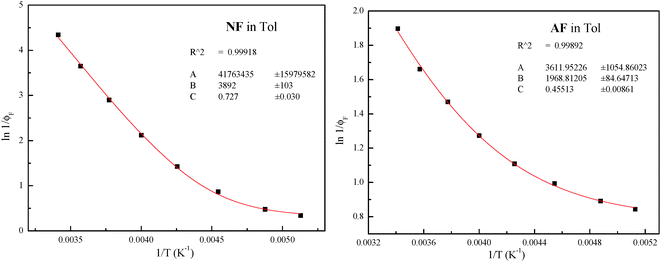 | ||
| Fig. 3 Trends of ϕF as a function of T and relative fittings (red curves) according to eqn (3) for NF and AF in Tol (the fitting parameters A, B and C are A/kF, Ea/RT and ϕlimF respectively). | ||
The different treatments agree with the presence of an activated IC (Eaca. 3.5 kcal mol−1) in the case of AA in MCH evidenced by both the trends of kIC and ϕF at different T; both activated ISC and IC processes with similar energy barriers (Eaca. 7.5 kcal mol−1) in the case of NF in Tol, and a slightly activated ISC (Ea = 1.1 kcal mol−1) and an activated IC with higher barrier (Eaca. 3 kcal mol−1) in the case of AF in Tol.
However, the results of the spectra and the photophysical parameters obtained for AF in Tol and DCM (in particular the opposite trend of ϕF with T, significantly increasing and decreasing at low T in Tol and DCM, respectively, see Table 2) prompted us to perform new quantum mechanical DFT calculations for this compound taking into account the solvation effects by means of the conductor-like polarizable continuum model CPCM.20 The achievements are reported in Tables S1, S2 and Fig. S17, S18 (ESI†). The results predicted the observed red-shift of the absorption spectrum and the increase of the 1(π,π*)–3(n,π*) energy gap on going from Tol (5.3 kcal mol−1) to the more polar solvent DCM (8.3 kcal mol−1), that makes the activated ISC less efficient.
Moreover, previous fs transient absorption measurements evidenced the presence of a 1CT* state for AF in DCM (produced by the charge transfer process from 1LE*) not observed in Tol. Therefore, the increase of ϕF at low T measured in Tol is explained by the decreased efficiency of the activated ISC and IC processes, while 3(n,π*) becomes inaccessible from the stabilized 1LE* in the more polar DCM, the activated ISC being no longer competitive with the fast ICT. Moreover, the decrease of ϕF at low T measured in DCM can be due to the increase of dielectric constant (from 9.08 at 293 K to 12.57 at 200 K) that causes an increased CT character of S1, the latter implying an increase of kIC (by roughly three times, see Table 5) and a decrease of kF (by ca. 40%, see Table 2).
A relaxed potential energy surface scan was performed by HF optimization in the case of AF in Tol, to confirm the eventual presence of sets of conformations for these flexible molecules at the investigated temperatures and the expected reduction of the energy gap between the S1 (π,π*) state and the upper excited singlet state of n,π* nature (Δ[S1–Sn]) in the more twisted geometries, as previously reported for analogous compounds.12,13 The results obtained are reported in Fig. S19 and Table S3 (ESI†). In fact, the relative stability of AF twisted conformations (shown in Fig. S19, ESI†), originated by rotation around the single bond adjacent to the benzaldehyde group (see Chart S1, ESI†), and the strong reduction of Δ[S1–Sn] observed for the twisted conformations (the two states becoming practically isoenergetic when θ = 90 deg, Table S3, ESI†), are in agreement with the presence of multiple species with slightly distorted geometries in the investigated 293–220 K range. These distorted conformations mainly contribute to the S1 deactivation through IC according to Lim's proximity effect.
| Compound | Solvent | τ UC/ps | τ TA /ps | Assignment |
|---|---|---|---|---|
| a From ref. 8. | ||||
| NA | CH | 0.45 | 0.85 | VC |
| 11 | 8.2 | VC | ||
| 985 | >2100 | S1(LE) | ||
| Rest | S1(LE) | |||
| AA | CH | 0.5 | 0.73 | VC |
| 14 | 11 | VC | ||
| 1100 | 1360 | S1 (LE) | ||
| Rest | S1 (LE) | |||
| AF | Tol | 1.2 | Solv. | |
| 18 | 10 | VC | ||
| 270 | 220 | S1 (LE) | ||
| Rest | T1 | |||
| AF | DCM | 0.69 | 0.47 | Solv. |
| 3.8 | 2.0 | Solv. | ||
| 100 | 83 | S1 (LE) | ||
| 995 | 1200 | S1 (ICT) | ||
| NF | Tol | 0.16 | 0.68 | Solv. |
| 7.8 | 8.4 | Solv. + VC | ||
| 48 | 45 | S1 (LE) | ||
| Rest | T1 | |||
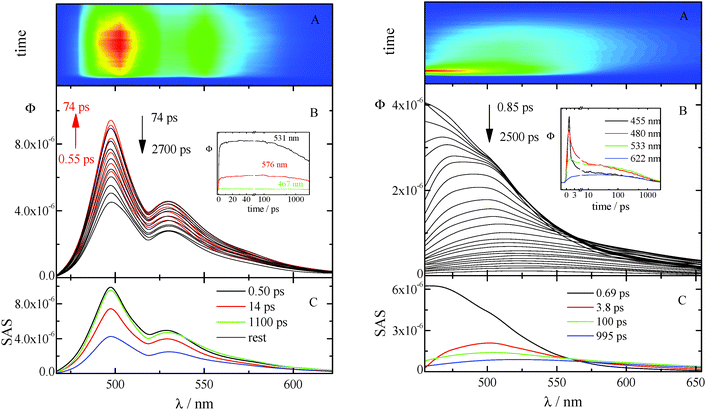
The kinetics acquired for AA in CH (see Fig. 4 left) show a fast rise followed by a slow decay (not completed in the investigated time window) at all the investigated wavelengths. The time resolved spectra are structured and do not exhibit any significant shift in time. The best fitting of these data was obtained when three exponential components are considered (characterized by lifetimes of 0.50, 14, and 1100 ps) together with the rest that corresponds to a longer-living transient not decaying in the considered temporal range. The first two lifetimes are in fair agreement with those previously obtained by femtosecond transient absorption measurements and are probably related to vibrational cooling, VC (see ref. 8 and Table 7). In fact, CH is known to be a non-polar solvent where no spectral relaxation due to solvation can be observed18 and previous studies,19 carried out in this solvent, suggested that the dynamics observed on a ∼10 ps time scale can be associated with vibrational relaxation processes. The two longer living transients can be both assigned to the decay of the locally excited (LE) S1 state: they show indeed the same SAS. In fact, the deactivation of the lowest excited singlet state in the highly concentrated solutions used for the up-conversion measurements of these compounds (characterized by a small Stokes shift) may be complicated by self-absorption of the emitted light (see Fig. S24, ESI†). Analogous results were obtained from the up-conversion study of the other anthracene derivative, NA in CH (Fig. S20, ESI† left).
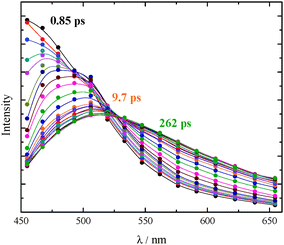
The ultrafast fluorescence data for AF in Tol (see Fig. S20, ESI† right) pointed out the occurrence of solvent relaxation of this non-dipolar solvent (1.2 ps, evidenced by the fast rise/decay dynamics in the kinetics acquired at different wavelengths) followed by vibrational cooling (18 ps) and decay of the LE S1 state (270 ps). Differently, a much more important spectral evolution in time was revealed for AF in the more polar DCM (see Fig. 4, right). The rise/decay dynamics in the recorded kinetics takes place in this case in a much longer time scale. The Global Fitting of these data revealed the presence of four exponential components whose lifetimes are 0.69, 3.8, 100 and 995 ps and whose assignment was supported by the Time Resolved Area Normalised Emission Spectra (TRANES) analysis (see Fig. 5).20–22 During the first 10 ps after photoexcitation (when the 0.69 and 3.8 ps components dominate the excited state deactivation, see Fig. S23, ESI†) a continuous shift is observed in the TRANES analysis indicating that solvation dynamics is occurring in this temporal interval. In contrast, an isoemissive point at 525 nm is observed in the 10–260 ps range, when the most abundant transients are the 100 and 995 ps components (see Fig. S23, ESI†). These species are therefore assigned to distinct local emissive minima on the potential energy surface of S1: the LE state produced upon light absorption and the ICT state stabilized in a polar solvent such as DCM. These results give a deep insight about the origin of the shoulder detected in the stationary fluorescence spectra of AF in DCM at low temperature (see Fig. S2, ESI†) that the finding can be now rationalized considering the dual emission from the LE and ICT states populated for this compound in a mildly polar solvent.23,24
Experimental
The compounds investigated are shown in Chart 1. They were re-synthesized following previously reported procedures.1,8 The solvents used (Fluka, spectroscopic grade) were cyclohexane (CH), methylcyclohexane (MCH), toluene (Tol) and dichloromethane (DCM).The absorption measurements were carried out using a Perkin-Elmer Lambda 800 spectrophotometer. The fluorescence spectra, corrected for the instrumental response, were recorded using a SPEX Fluorolog-2 F112AI spectrofluorometer. The fluorescence lifetimes (τF) were measured on an Edinburgh Instrument 199S spectrofluorometer equipped with a LED source (centered at 370 nm in the case of fluorene-derivatives and at 455 nm for the anthracene-derivatives), using the single-photon counting method with a resolution time of 0.2 ns. The values reported in the tables are averages of three independent experiments with a mean deviation of ≅10%. The kinetic traces were also analyzed by means of the Maximum Entropy Method (MEM) using MEMEXP Software available online.25 The method, which is based on the simultaneous maximization of the entropy (S) and the minimization of the Poisson deviance (C), gives back the distribution of lifetimes, as well as the number of transients (family of distributions around an average time) needed to describe the spectroscopic kinetics. These distributions describe the probability of having different lifetimes. The widths of the distributions are sensitive to the heterogeneous microenvironment and temperature a molecule can experience in the sample.26 Further details of MEM analysis are given in the ESI.†
The triplet properties were measured by a previously described laser flash photolysis setup27 exciting at 355 nm using the third harmonic of a Continuum (Surelite II) Nd:YAG laser (pulse width 7 ns and laser energy <5 mJ per pulse).
A cryostat (Oxford Instruments DN 1704) was used to control temperature in the 195–358 K range. For the measurements of the quantum yields of the photophysical processes as a function of temperature, the values at 293 K (from ref. 8) were used as reference, taking into account the changes in absorbance and refractive index with temperature. For all measurements, the solutions were deoxygenated by purging with nitrogen.
A detailed description of the experimental setup for ultrafast measurements was previously reported.28,29 The 400 nm excitation pulses of ca. 60 fs were generated by an amplified Ti:Sapphire laser system (Spectra Physics, Mountain View, CA). In the up-conversion set-up (Halcyone, Ultrafast Systems) the 400 nm pulses excite the sample whereas the remaining fundamental laser beam at 800 nm plays the role of the “optical gate” after passing through a delay line. The temporal resolution of the up-conversion equipment is about 250 fs, whereas the spectral resolution is 5 nm. Ultrafast spectroscopic data were fitted by Global and Target Analysis using Glotaran software.30
Quantum-mechanical calculations were carried out using the Gaussian 09 package.31 Density functional theory (DFT) based on the CAM-B3LYP method was used.32,33 In particular, for the ground state of the substrates HF optimization was employed, while transition energies and probabilities of the excited singlet states were obtained by TD-DFT CAM-B3LYP/6-31G(d). Tol and DCM solvation effects were included in the calculations by means of the conductor-like polarizable continuum model CPCM.34 A relaxed potential energy surface scan was performed by HF to investigate the relative stability of conformations originated by rotation around the single bond adjacent to the aromatic moieties.
Conclusions
The temperature effect on the photophysical properties confirmed the presence of an activated ISC to an upper triplet state only in the case of fluorene derivatives in non-polar Tol, as previously hypothesized on the basis of TDDFT quantum-mechanical calculations and ultrafast absorption spectroscopy. In fact, replacing the fluorene aromatic structure with an anthracene moiety, the energy of the (π,π*) states is significantly lowered (as also indicated by the bathochromic shift of the UV-Vis absorption spectrum of anthryl compounds compared with those of fluorene-derivatives) while the (n,π*) states are much less affected. Thus, the energy of the 3(n,π*) state of NA and AA is significantly higher than that of the lowest excited 1(π,π*) state in agreement with no activated ISC found to occur for the latter.An unexpected activated IC was also found to be operative in the deactivation of S1 competing with fluorescence and ISC, in the case of fluorene-derivatives in Tol. It was also present in the photorelaxation of AA in Tol above room T. With the help of the distributions of lifetimes (larger at high T and narrower at low T) obtained by MEM analysis of the fluorescence decay data, this behavior was explained by the presence in fluid solution at high T of different sets of twisted conformations (responsible for the increased IC yield) while more planar and stable forms (mainly deactivated through fluorescence) are selected at low T.
An interesting opposite trend of ϕF with T was observed for AF on going from Tol to the more polar DCM and explained on the basis of the increase of the 1(π,π*)–3(n,π*) energy gap predicted by DFT calculations in the more polar solvent (that makes the activated ISC less efficient) and the role of ICT states in solvents of higher dielectric constant. In fact, the increase of ϕF at low T measured in Tol is explained by the decreased efficiency of the activated ISC and IC processes, while the decrease of ϕF at low T measured in DCM is due to the increase of the dielectric constant that causes an increased CT character of S1, the latter implying an increase of kIC and a decrease of kF.
The presence of dual fluorescence of AF in DCM, suggested by the appearance of a hypsochromic shoulder in its emission spectrum at low T, was nicely confirmed by femtosecond up-conversion measurements that allowed reconstructing time resolved spectra revealing different emission bands. The detection of an isoemissive point in the TRANES analysis unequivocally indicated the presence of two excited states (1LE* and 1ICT*) for AF in DCM.
Acknowledgements
The authors acknowledge support from the Italian “Ministero per l'Università e la Ricerca Scientifica e Tecnologica”, MIUR (Rome, Italy) under the FIRB “Futuro in Ricerca” 2013, no. RBFR13PSB6 and PRIN ‘‘Programmi di Ricerca di Interesse Nazionale’’ 2010–2011, no. 2010FM738P.References
- R. Flamini, I. Tomasi, A. Marrocchi, B. Carlotti and A. Spalletti, J. Photochem. Photobiol., A, 2011, 223, 140 CrossRef CAS.
- A. Marrocchi, A. Spalletti, S. Ciorba, M. Seri, F. Elisei and A. Taticchi, J. Photochem. Photobiol., A, 2010, 211, 162 CrossRef CAS.
- For recent representative examples see: (a) M. Inagaki and F. Kang, J. Mater. Chem. A, 2014, 2, 13193 RSC; (b) A. Broggi, I. Tomasi, L. Bianchi, A. Marrocchi and L. Vaccaro, ChemPlusChem, 2014, 79, 486 CrossRef CAS; (c) C. Kastner, S. Rathgeber, D. A. M. Egbe and H. Hoppe, J. Mater. Chem. A, 2013, 1, 3961 RSC; (d) S. Rochat and T. M. Swager, ACS Appl. Mater. Interfaces, 2013, 5, 4488 CrossRef CAS PubMed; (e) E. Bartollini, M. Seri, S. Tortorella, A. Facchetti, T. J. Marks, A. Marrocchi and L. Vaccaro, RSC Adv., 2013, 3, 9288 RSC; (f) A. Marrocchi, I. Tomasi and L. Vaccaro, Isr. J. Chem., 2012, 52, 41 CrossRef CAS; (g) A. Operamolla, R. Ragni, O. H. Omar, G. Iacobellis, A. Cardone, F. Babudri and G. Farinola, Curr. Org. Synth., 2012, 9, 764 CrossRef CAS; (h) T. L. Andrew and T. M. Swager, J. Polym. Sci., Part B: Polym. Phys., 2011, 49, 476 CrossRef CAS; (i) A. Operamolla and G. Farinola, Eur. J. Org. Chem., 2011, 423 CrossRef CAS; (j) F. Silvestri and A. Marrocchi, Int. J. Mol. Sci., 2010, 11, 1471 CrossRef CAS PubMed.
- R. Flamini, B. Carlotti, A. Spalletti and A. Marrocchi, Org. Photonics Photovolt., 2014, 2, 1 Search PubMed.
- R. Flamini, A. Marrocchi and A. Spalletti, Photochem. Photobiol. Sci., 2014, 13, 1031 CAS.
- (a) B. Carlotti, A. Spalletti, M. Šindler-Kulyk and F. Elisei, Phys. Chem. Chem. Phys., 2011, 13, 4519 RSC; (b) I. Kikaš, B. Carlotti, I. Škorić, M. Šindler-Kulyk, U. Mazzucato and A. Spalletti, J. Photochem. Photobiol., A, 2012, 244, 38 CrossRef; (c) B. Carlotti, I. Kikaš, I. Škorić, A. Spalletti and F. Elisei, ChemPhysChem, 2013, 14, 970 CrossRef CAS PubMed; (d) B. Carlotti, F. Elisei, U. Mazzucato and A. Spalletti, Phys. Chem. Chem. Phys., 2015, 17, 14740 RSC; (e) B. Carlotti, G. Consiglio, F. Elisei, C. G. Fortuna, U. Mazzucato and A. Spalletti, J. Phys. Chem. A, 2014, 118, 3580 CrossRef CAS PubMed; (f) B. Carlotti, E. Benassi, V. Barone, G. Consiglio, F. Elisei, A. Mazzoli and A. Spalletti, ChemPhysChem, 2015, 16, 1440 CrossRef CAS PubMed.
- For representative examples see: (a) P. Sonar, S. P. Singh, Y. Li, Z. Ooi, T. Ha, I. Wong, M. S. Soh and A. Dodabalapur, Energy Environ. Sci., 2011, 4, 2288 RSC; (b) C. Aurisicchio, D. Bonifazi, B. Ventura and A. Barbieri, J. Phys. Chem. C, 2009, 113, 17927 CrossRef CAS; (c) Y. Gong, X. Guo, S. Wang, H. Su and A. Xia, J. Phys. Chem. A, 2007, 111, 5806 CrossRef CAS PubMed.
- B. Carlotti, R. Flamini, A. Spalletti, A. Marrocchi and F. Elisei, ChemPhysChem, 2012, 13, 724 CrossRef CAS PubMed.
- B. Carlotti, R. Flamini, I. Kikaš, U. Mazzucato and A. Spalletti, Chem. Phys., 2012, 407, 9 CrossRef CAS.
- B. Carlotti, F. Elisei and A. Spalletti, Phys. Chem. Chem. Phys., 2011, 13, 20787 RSC.
- K. Suzuki, A. Demeter, W. Kühnle, E. Tauer, K. A. Zachariasse, S. Tobita and H. Shizuka, Phys. Chem. Chem. Phys., 2000, 2, 981 RSC , and references therein.
- G. Marconi, G. Bartocci, U. Mazzucato, A. Spalletti, F. Abbate, L. Angeloni and E. Castellucci, Chem. Phys., 1995, 196, 383 CrossRef CAS.
- G. Marconi, G. Bartocci, U. Mazzucato, A. Spalletti, F. Abbate, L. Angeloni and E. Castellucci, Am. Inst. Phys., Conf. Proc., 1996, 364, 175 CAS and references therein.
- E. C. Lim, J. Phys. Chem., 1986, 90, 6770 CrossRef CAS.
- R. Flamini, A. Marrocchi and A. Spalletti, ChemPlusChem, 2015, 80, 1045 CrossRef CAS.
- P. L. Gentili, F. Ortica, A. Romani and G. Favaro, J. Phys. Chem. A, 2007, 111, 193 CrossRef CAS PubMed.
- E. Benassi, C. Cappelli, B. Carlotti and V. Barone, Phys. Chem. Chem. Phys., 2014, 16, 26963 RSC.
- L. Reynolds, J. A. Gardecki, S. J. V. Frankland, M. L. Horng and M. Maroncelli, J. Phys. Chem., 1996, 100, 10337 CrossRef CAS.
- M. L. Horng, J. A. Gardecki, A. Papazyan and M. Maroncelli, J. Phys. Chem., 1995, 99, 17311 CrossRef CAS.
- N. Periasamy and A. S. R. Koti, Proc. Indiana Acad. Sci., 2003, 69, 41 Search PubMed.
- L. Gutierrez-Arzaluz, C. A. Guarin, W. Rodrigez-Cordoba and J. Peon, J. Phys. Chem. B, 2013, 117, 12175 CrossRef CAS PubMed.
- M. Park, D. Im, Y. Ho Rhee and T. Joo, J. Phys. Chem. A, 2014, 118, 5125 CrossRef CAS PubMed.
- B. Carlotti, A. Cesaretti, C. G. Fortuna, A. Spalletti and F. Elisei, Phys. Chem. Chem. Phys., 2015, 17, 1877 RSC.
- E. Benassi, B. Carlotti, M. Segado, A. Cesaretti, A. Spalletti, F. Elisei and V. Barone, J. Phys. Chem. B, 2015, 119, 6035 CrossRef CAS PubMed.
- (a) P. J. Steinbach, R. Ionescu and C. R. Matthews, Biophys. J., 2002, 82, 2244 CrossRef CAS PubMed; (b) P. J. Steinbach, J. Chem. Inf. Comput. Sci., 2002, 42, 1476 CrossRef CAS PubMed.
- (a) M. Penconi, P. L. Gentili, G. Massaro, F. Elisei and F. Ortica, Photochem. Photobiol. Sci., 2014, 13, 48 RSC; (b) P. L. Gentili, C. Clementi and A. Romani, Appl. Spectrosc., 2010, 64, 923 CrossRef CAS PubMed; (c) P. L. Gentili, Dyes Pigm., 2014, 110, 235 CrossRef CAS.
- H. Gorner, F. Elisei and G. G. Aloisi, J. Chem. Soc., Faraday Trans., 1992, 88, 29 RSC.
- B. Carlotti, E. Benassi, A. Cesaretti, C. G. Fortuna, A. Spalletti, V. Barone and F. Elisei, Phys. Chem. Chem. Phys., 2015, 17, 20981 RSC.
- A. Cesaretti, B. Carlotti, P. L. Gentili, C. Clementi, R. Germani and F. Elisei, J. Phys. Chem. B, 2014, 118, 8601 CrossRef CAS PubMed.
- J. J. Snellenburg, S. Laptenok, R. Seger, K. M. Mullen and I. H. M. van Stokkum, J. Stat. Soft., 2012, 49, 1 Search PubMed.
- M. J. Frisch, G. W. Trucks, H. B. Schlegel, G. E. Scuseria, M. A. Robb, J. R. Cheeseman, G. Scalmani, V. Barone, B. Mennucci, G. A. Petersson, H. Nakatsuji, M. Caricato, X. Li, H. P. Hratchian, A. F. Izmaylov, J. Bloino, G. Zheng, J. L. Sonnenberg, M. Hada, M. Ehara, K. Toyota, R. Fukuda, J. Hasegawa, M. Ishida, T. Nakajima, Y. Honda, O. Kitao, H. Nakai, T. Vreven, J. A. Montgomery, Jr., J. E. Peralta, F. Ogliaro, M. Bearpark, J. J. Heyd, E. Brothers, K. N. Kudin, V. N. Staroverov, T. Keith, R. Kobayashi, J. Normand, K. Raghavachari, A. Rendell, J. C. Burant, S. S. Iyengar, J. Tomasi, M. Cossi, N. Rega, J. M. Millam, M. Klene, J. E. Knox, J. B. Cross, V. Bakken, C. Adamo, J. Jaramillo, R. Gomperts, R. E. Stratmann, O. Yazyev, A. J. Austin, R. Cammi, C. Pomelli, J. W. Ochterski, R. L. Martin, K. Morokuma, V. G. Zakrzewski, G. A. Voth, P. Salvador, J. J. Dannenberg, S. Dapprich, A. D. Daniels, O. Farkas, J. B. Foresman, J. V. Ortiz, J. Cioslowski and D. J. Fox, Gaussian 09, Revision B.01, Gaussian, Inc., Wallingford, CT, 2010 Search PubMed.
- T. Yanai, D. P. Tew and N. C. Handy, Chem. Phys. Lett., 2004, 393, 51 CrossRef CAS.
- T. Yanai, R. J. Harrison and N. C. Handy, Mol. Phys., 2005, 103, 413 CrossRef CAS.
- V. Barone and M. Cossi, J. Phys. Chem. A, 1998, 102, 1995 Search PubMed.
Footnote |
| † Electronic supplementary information (ESI) available. See DOI: 10.1039/c5cp06025g |
| This journal is © the Owner Societies 2016 |

![[thin space (1/6-em)]](https://www.rsc.org/images/entities/char_2009.gif)
